Ethereum Daily Analysis: Ethereum at 13-Month Low Below All Moving Averages
Market Overview
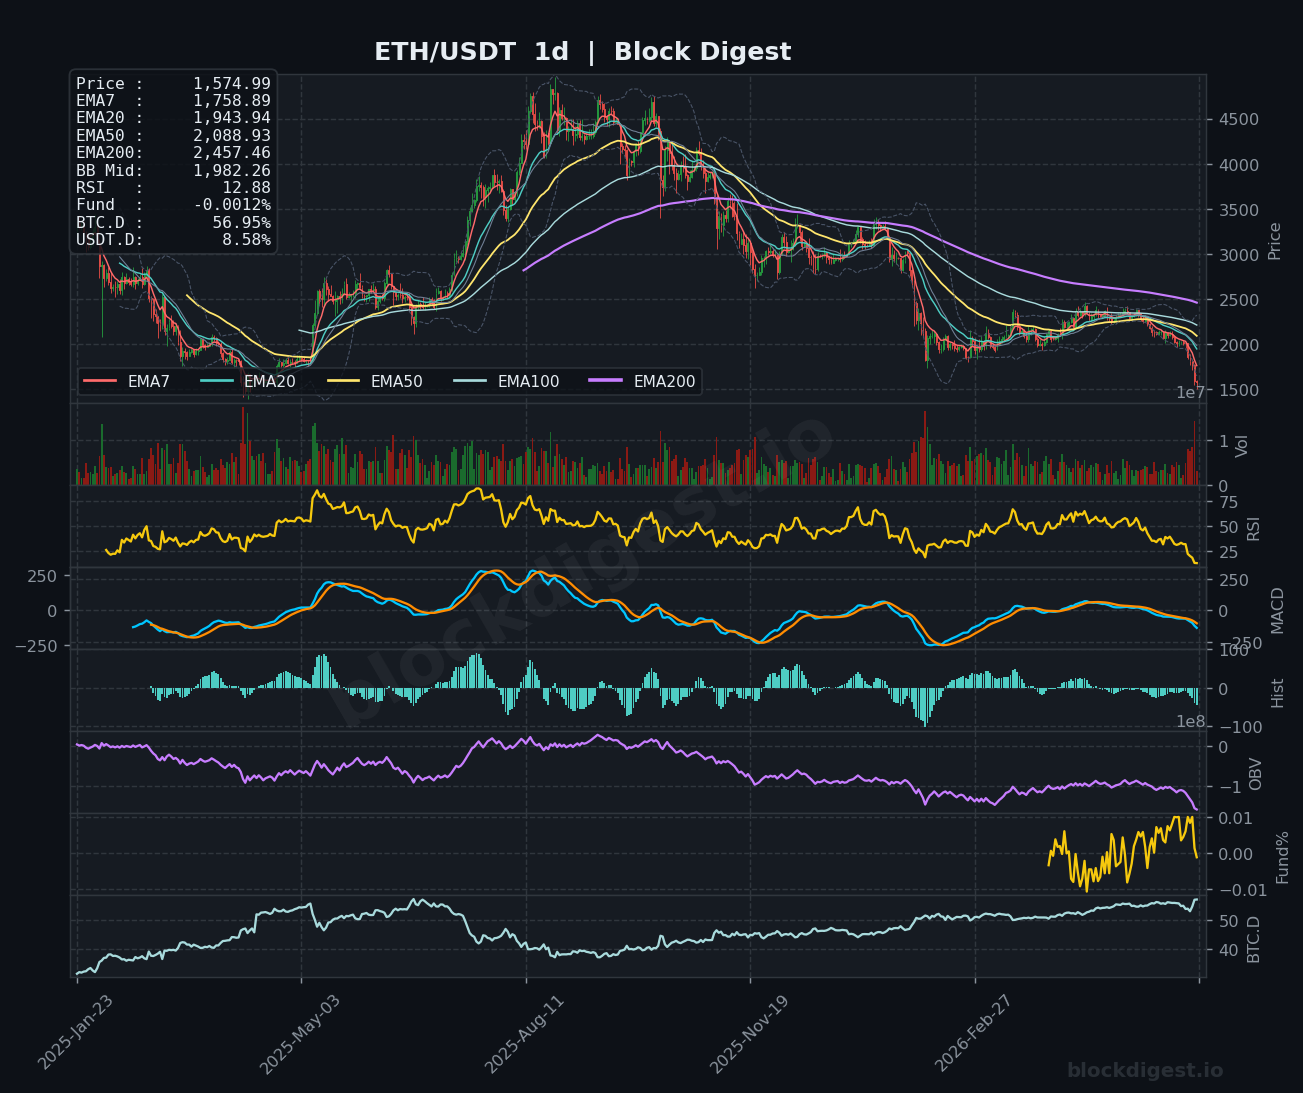
Ethereum is trading at $1,574.99 as of June 6, 2026, deep in bearish territory and printing a 13-month low as the latest leg of selling pressure accelerates. Price is trading well below every major moving average across all timeframes — the daily EMA7 sits at $1,758.89, EMA20 at $1,943.94, EMA50 at $2,088.93, and the EMA200 at a distant $2,457.46 — confirming a fully bearish EMA stack with no near-term dynamic support in sight. On the daily chart, price has broken through the lower Bollinger Band (BB Mid: $1,982.26), indicating an extreme oversold extension. The dominant trend on the daily timeframe is unambiguously bearish, with each rally attempt over the past several months failing at progressively lower highs.
Multi-Timeframe Confluence
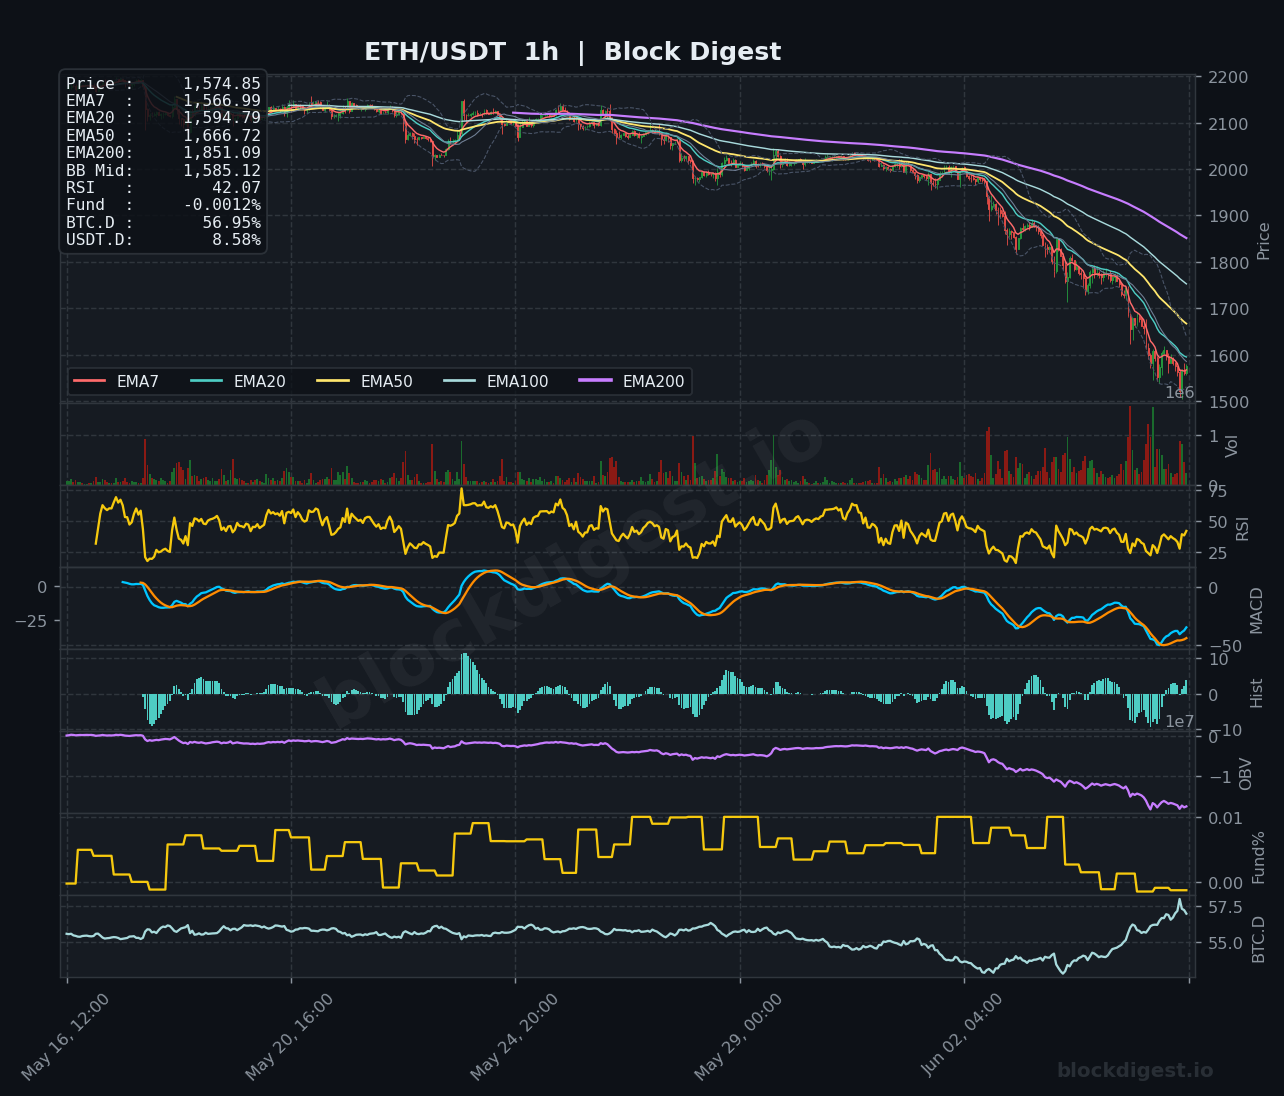
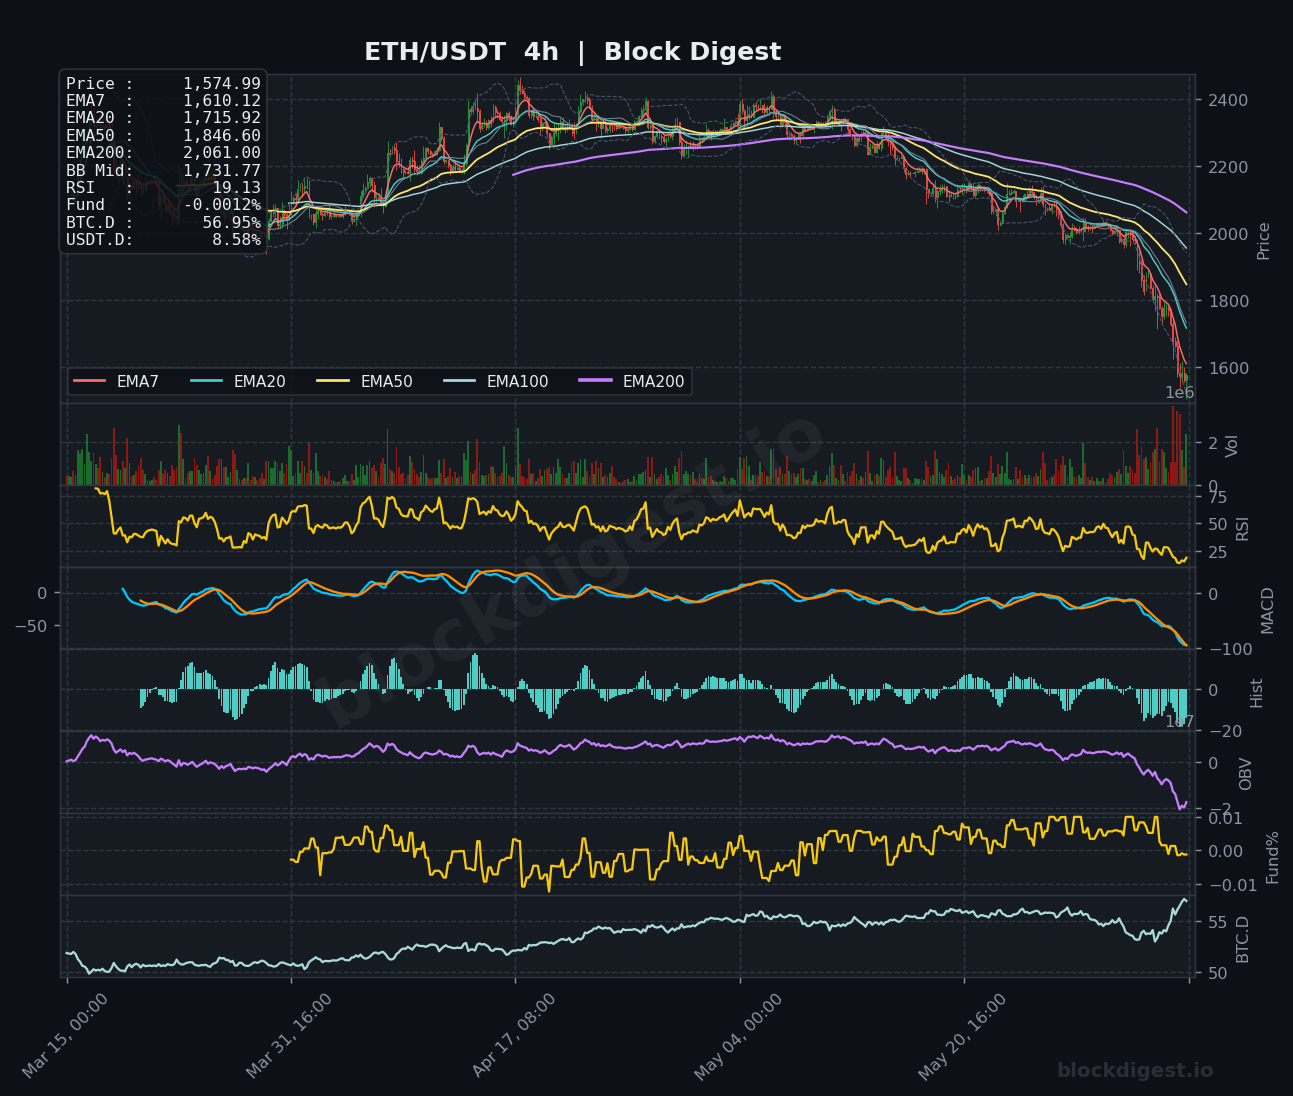
All three timeframes are in complete bearish alignment — there is no divergence between short-term and higher timeframe structure, which compounds downside risk. On the 1-hour chart, price at $1,574.85 is below all EMAs (EMA7: $1,566.99, EMA20: $1,594.79), with the entire EMA ribbon fanned downward in a classic bearish cascade. The 4-hour chart reinforces this, with the EMA7 at $1,610.12 and EMA20 at $1,715.92 acting as immediate overhead resistance zones, and price printing below the BB Mid ($1,731.77) by a wide margin. The daily timeframe confirms the macro structure: ETH has failed to reclaim any meaningful moving average for months, and the current breakdown has wiped out all recovery gains from early 2026.
Key Levels to Watch
- Resistance: $1,610–$1,615 — 1h/4h EMA7 cluster; the first dynamic ceiling bulls must reclaim for any short-term relief
- Resistance: $1,715–$1,732 — 4h EMA20 and 4h BB Mid confluence; a major gatekeeping zone that, if reclaimed, would begin neutralizing near-term bearish structure
- Resistance: $1,850–$1,946 — 4h EMA50 and daily EMA20; a critical structural zone that would need to flip for any meaningful trend reversal
- Support: $1,550 — Psychological round number and near-term chart low; a close below this level would open the path to deeper multi-year support
- Support: $1,480–$1,500 — Key structural support from the April 2025 consolidation base; represents the last meaningful demand zone before a retest of sub-$1,400 territory
- Support: $1,300–$1,350 — Major macro support corresponding to 2023 resistance-turned-support; a catastrophic breakdown scenario target
Momentum & On-Chain Signals
The RSI readings across all timeframes paint an extremely oversold picture: the 1-hour RSI sits at 42.07 (mildly oversold with room to drop further), the 4-hour RSI has collapsed to 19.13 (deeply oversold, historically extreme), and the daily RSI has cratered to 12.88 — among the lowest readings seen in ETH’s history, suggesting severe capitulation-level selling. The MACD on both the 1-hour and 4-hour charts shows the signal and MACD lines deeply negative with no bullish crossover in sight, while the histogram remains red and expanding to the downside on the 4-hour. OBV across all timeframes is in a sustained downtrend, confirming persistent distribution and no evidence of accumulation; the 1-hour OBV has dropped sharply in the latest sessions, validating the move lower with volume conviction. The funding rate at -0.0012% is mildly negative, indicating modest short-side premium — not yet at extreme levels that would typically precede a violent short squeeze.
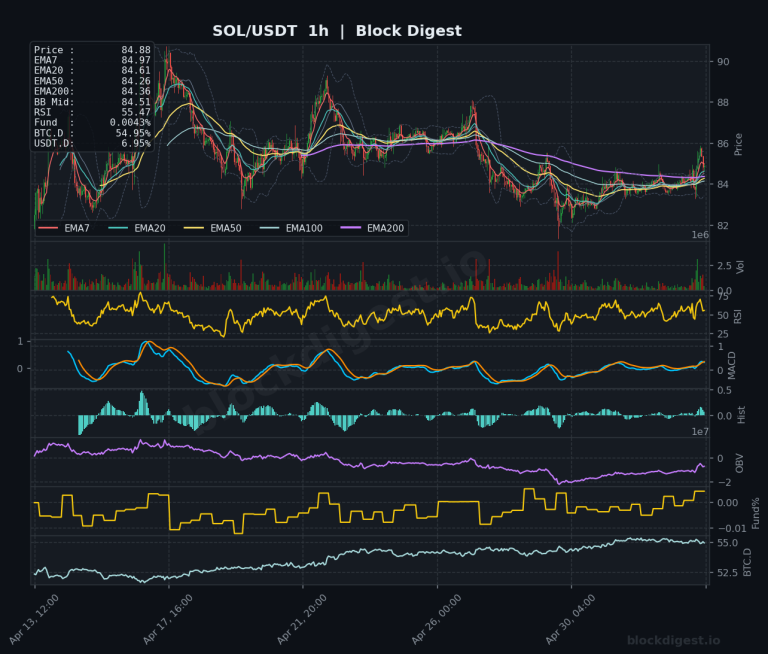
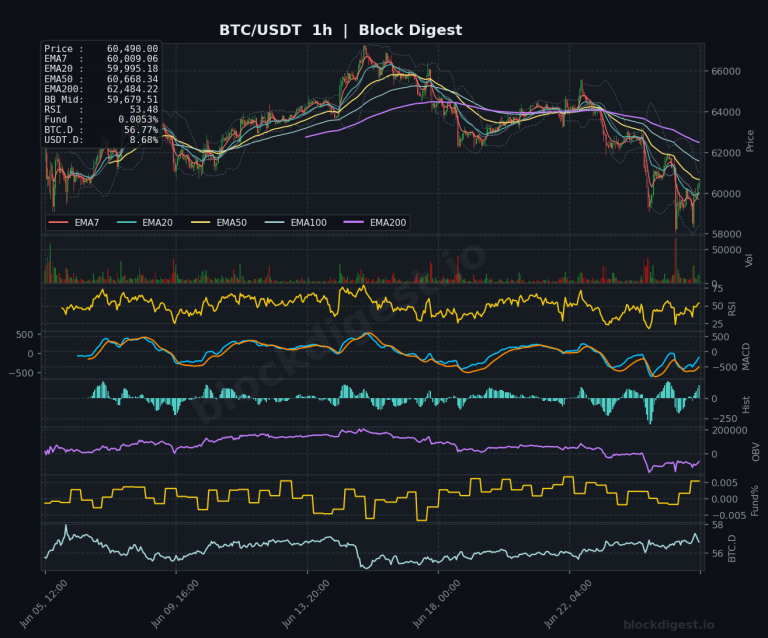
BTC Dominance & Market Sentiment
BTC dominance (BTC.D) is currently at 56.95% and trending sharply higher on the 1-hour chart, a clear signal that capital is rotating out of altcoins and into Bitcoin as a relative safe haven within crypto. USDT.D at 8.58% reflects a notable increase in stablecoin holdings, indicating broad risk-off behavior and capital exiting into cash positions rather than redeploying. For ETH specifically, the rising BTC.D is a headwind — historically, sustained BTC dominance above 57% suppresses altcoin performance and can accelerate ETH/BTC pair weakness even if nominal BTC prices stabilize.
Risk Scenarios
- Bullish case: A reclaim of the $1,610–$1,615 EMA cluster on the 1-hour with a 4-hour RSI bounce above 30 would signal a short-term relief rally, with an initial target toward $1,715–$1,732. Broader recovery would require ETH to close above $1,850 on the daily with confirming volume and a BTC.D reversal lower.
- Bearish case: A confirmed 1-hour close below $1,550 would expose the $1,480–$1,500 structural support zone, with continued institutional outflows and BTC.D expansion potentially driving a flush to the $1,300–$1,350 macro support region.
Outlook
The bias remains decisively bearish with no credible technical signal of a reversal at this stage — all EMAs are stacked against price across every timeframe, OBV confirms distribution, and the macro backdrop of 13 consecutive ETF outflow days and institutional de-risking provides fundamental confirmation of the chart structure. The extreme daily RSI reading of 12.88 warrants close attention over the next 24–48 hours, as such readings can precede sharp but temporary counter-trend bounces driven by short covering; however, oversold conditions alone are not a buy signal in a trending market. The critical level to watch is $1,550 — a sustained break below would invalidate any near-term bounce thesis and accelerate selling toward the $1,480 zone. Until ETH can reclaim the $1,715 area on the 4-hour with conviction, any upside should be treated as a relief rally within a dominant downtrend.
Disclaimer: This analysis is for informational purposes only and does not constitute financial advice. Cryptocurrency markets are highly volatile and unpredictable. All trading decisions should be made based on your own research and risk tolerance. Block Digest is not responsible for any financial losses incurred as a result of acting on this content.