Ethereum Daily Analysis: ETH Deep Below EMA200 and Bollinger Midline
Market Overview
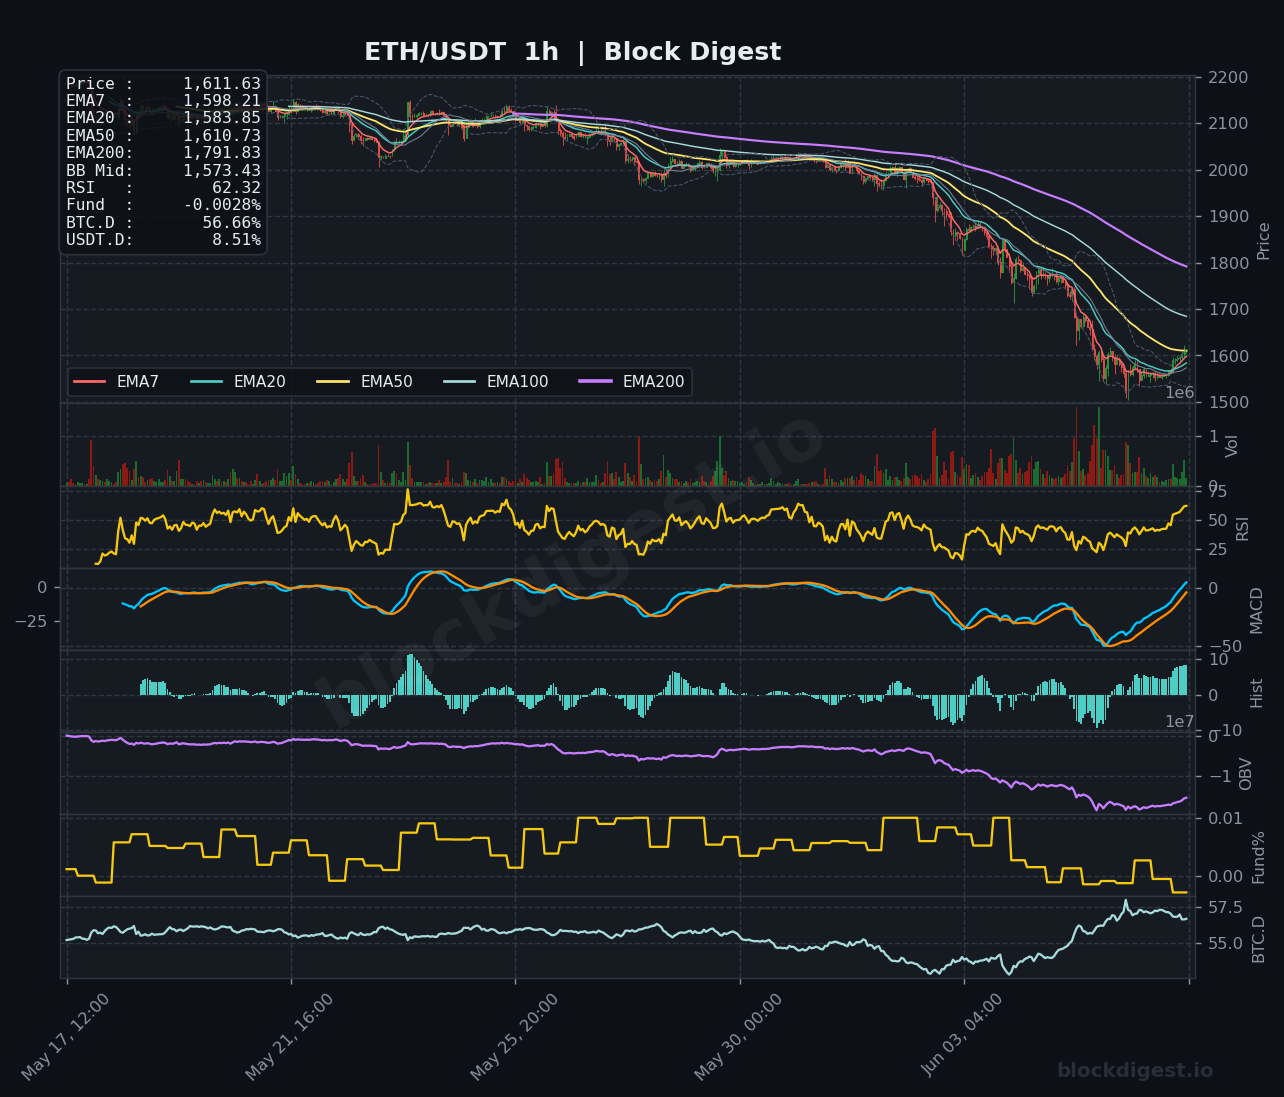
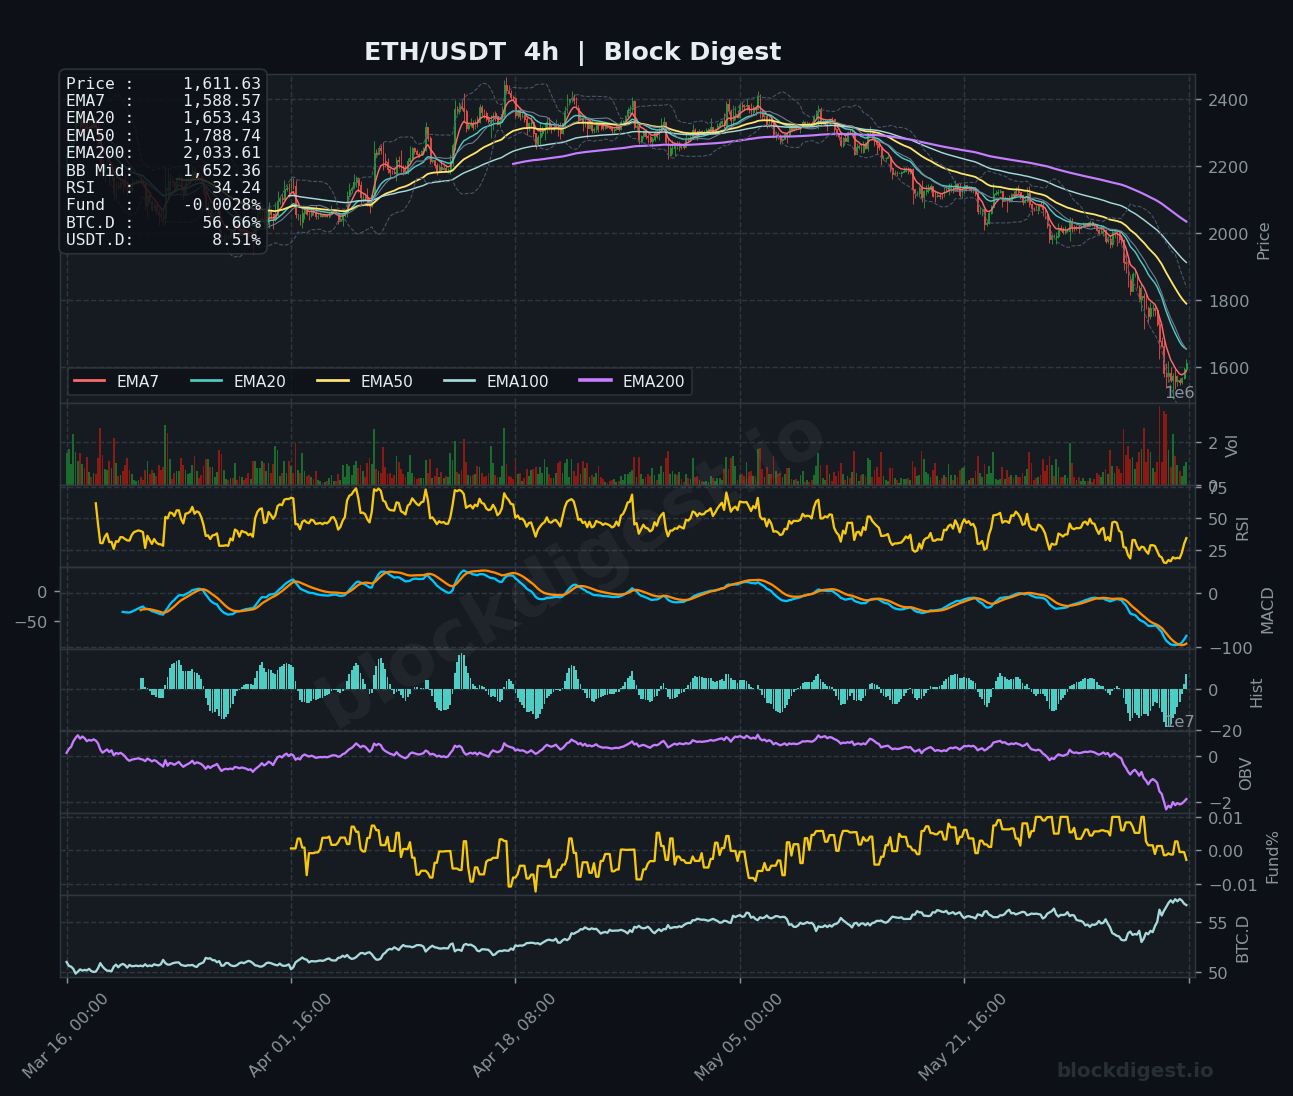
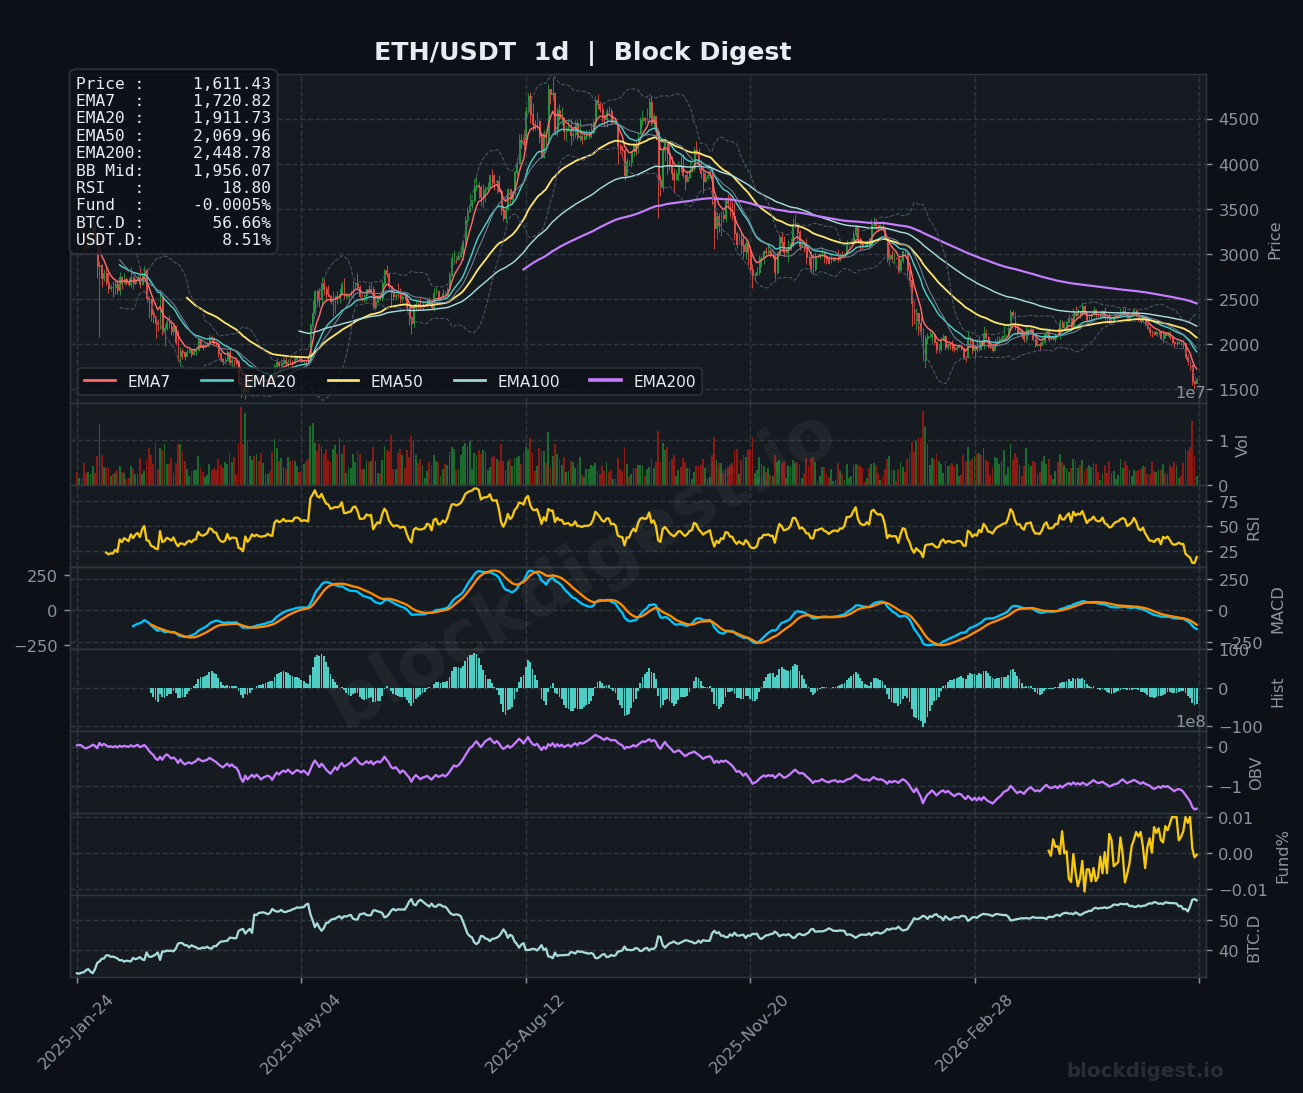
ETH/USDT is currently trading at $1,611.63, deep in bearish territory across all major timeframes. Price sits well below its daily EMA200 ($2,448.78), EMA50 ($2,069.96), and EMA20 ($1,911.73), confirming a structurally damaged downtrend that has been in place since late 2025. On the daily chart, price is also trading significantly beneath the Bollinger Band midline at $1,956.07, suggesting sustained selling pressure with no meaningful mean-reversion attempt. The dominant trend remains firmly bearish, and the recent acceleration lower has pushed ETH to multi-year lows relative to its moving average stack.
Multi-Timeframe Confluence
Across all three timeframes, the bearish alignment is near-unanimous. On the 4H chart, price is trading below all EMAs — with the EMA200 at $2,033.61 acting as distant overhead resistance — and the EMA7 ($1,588.57) and EMA20 ($1,653.43) are both sloping sharply downward. The 1H chart offers the only tentative sign of short-term stabilization, with RSI recovering to 62.32 and price briefly reclaiming the EMA50 at $1,610.73 — however, this bounce is occurring within a broader downtrend and should be treated with caution. The daily and 4H structures overwhelmingly dominate, and any intraday strength is likely corrective rather than a trend reversal.
Key Levels to Watch
- Resistance: $1,653 — 4H EMA20, the nearest dynamic overhead resistance coinciding with recent breakdown structure
- Resistance: $1,720–$1,791 — Daily EMA7 at $1,720.82 and 1H EMA200 at $1,791.83, a confluence zone that would need to be reclaimed to shift short-term bias
- Resistance: $1,956 — Daily Bollinger Band midline and EMA20 zone, a level that would represent genuine structural recovery
- Support: $1,570–$1,575 — 1H Bollinger Band midline at $1,573.43, near-term intraday floor
- Support: $1,500 — Psychological round number and visible chart low; a breakdown here would open deeper downside
- Support: $1,450–$1,480 — Broader macro support zone based on prior consolidation structure visible on the daily chart
Momentum & On-Chain Signals
The daily RSI at 18.80 is in deeply oversold territory, a reading that historically precedes at minimum a technical bounce, though oversold conditions can persist during strong trends. On the 4H timeframe, RSI sits at 34.24 — recovering from lower levels but still below the neutral 50 threshold, indicating no momentum shift yet. The MACD on both the 4H and daily is deeply negative, with the histogram showing slightly contracting bearish bars on the 1H suggesting short-term momentum exhaustion. OBV on all timeframes continues to trend lower, confirming ongoing net distribution and a lack of meaningful accumulation at current levels — a concerning signal for any prospective recovery.
BTC Dominance & Market Sentiment
BTC dominance currently reads 56.66%, sitting at elevated levels consistent with capital rotation away from altcoins and into Bitcoin. USDT dominance at 8.51% signals that a notable portion of market participants remain in stablecoins, reflecting risk-off sentiment and a reluctance to deploy capital into altcoin positions. For ETH specifically, this environment is historically unfavorable — high BTC.D combined with elevated USDT.D typically suppresses altcoin recoveries and suggests that any ETH bounce may face persistent selling pressure from market-wide de-risking.
Risk Scenarios
- Bullish case: A sustained hourly close above $1,653 (4H EMA20) followed by a reclaim of $1,720 (daily EMA7) would indicate short-term trend repair, opening a measured move toward the $1,791–$1,956 resistance cluster. Confirmation would require OBV stabilization and RSI on the 4H breaking above 50.
- Bearish case: Failure to hold the $1,570–$1,575 support zone on the 1H, especially on elevated volume, would signal the current bounce is exhausted and target a move toward $1,500 and potentially $1,450. A continuation of BTC dominance expansion above 57% would reinforce this scenario.
Outlook
The directional bias remains bearish on all higher timeframes, though the daily RSI at 18.80 warrants caution about aggressively chasing shorts at current levels given the elevated risk of a technical relief rally. In the next 24–48 hours, the key trigger to watch is whether ETH can sustain a hold above $1,610–$1,653 — a failure at this zone would confirm the bounce is purely technical and renew downside momentum. Conversely, a clean break above $1,720 with expanding volume would be the earliest credible signal of a short-term structural shift. Until price reclaims at minimum the daily EMA7 on a closing basis, the path of least resistance structurally remains lower.
Disclaimer: This analysis is for informational purposes only and does not constitute financial advice. Cryptocurrency markets are highly volatile and unpredictable. All trading decisions should be made based on your own research and risk tolerance. Block Digest is not responsible for any financial losses incurred as a result of acting on this content.