
daily analysis
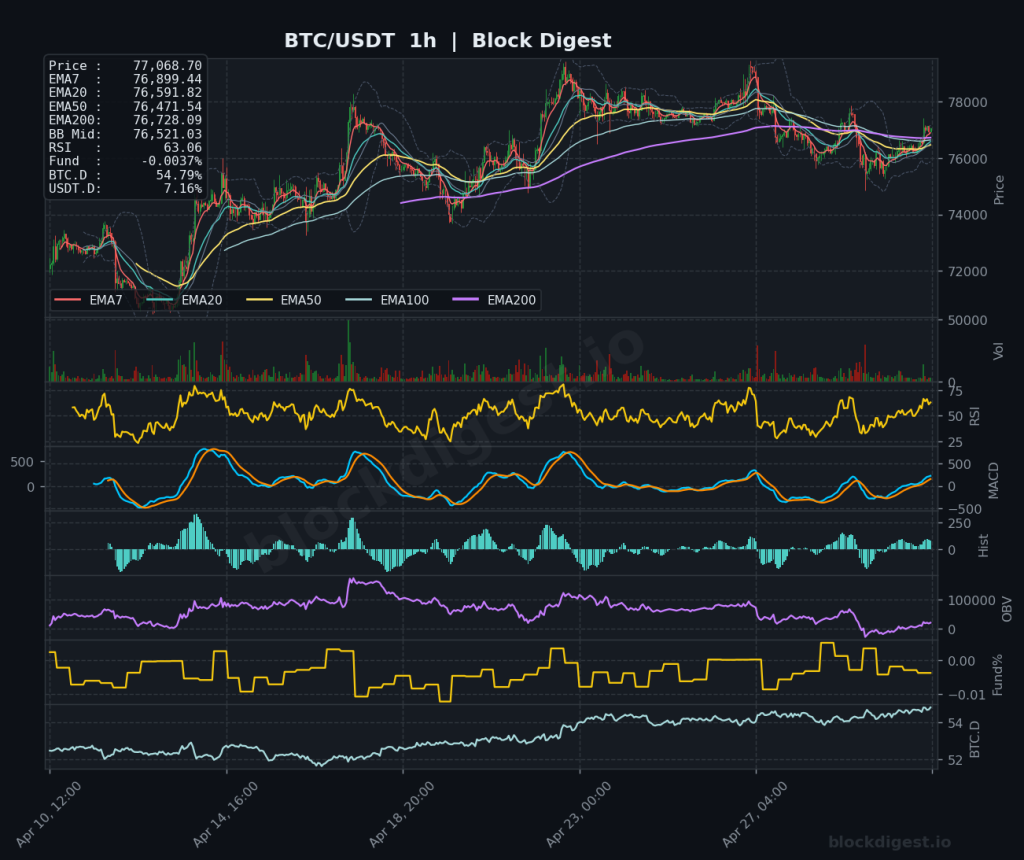
BTC Daily Analysis — May 01, 2026
**BTC Daily Analysis – May 01, 2026** **Market Overview** Bitcoin is trading at $77,068, positioned above all major EMAs across the 1-hour and 4-hour timeframes, signaling short-term bullish momentum. Price is currently testing the middle of the Bollinger Band range at $76,521 on the 1-hour chart, having recently bounced from the lower band zone around...
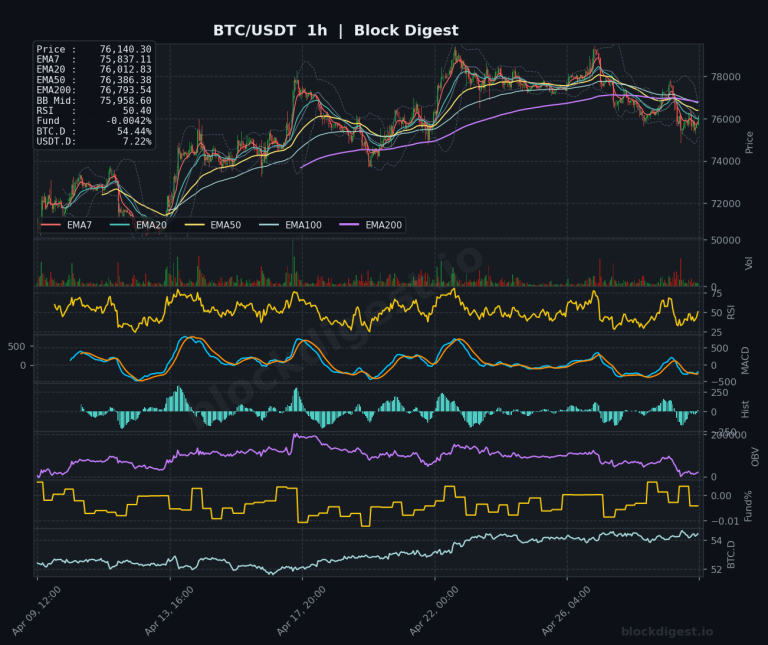
BTC Daily Analysis — April 30, 2026
BTC Daily Analysis – April 30, 2026 Market Overview Bitcoin is trading at $76,133.30, positioned precariously below its short-term moving averages while attempting to stabilize after recent weakness. The daily timeframe reveals price trading beneath the EMA50 ($73,624) but above the critical EMA200 ($82,432.63), indicating a corrective phase within a broader trend that has lost...
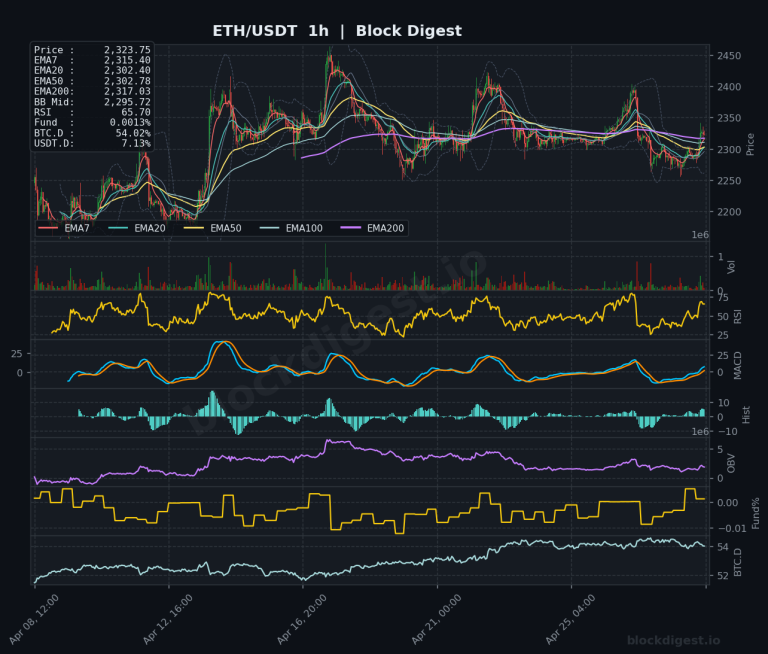
ETH Daily Analysis — April 29, 2026
ETH Daily Analysis – April 29, 2026 Market Overview ETH is currently trading at $2,323.75, consolidating within a tight range just above the key $2,300 psychological level. Price action remains compressed between the EMA20 ($2,302.40) and EMA50 ($2,302.78) on the 1-hour timeframe, indicating short-term indecision. On the daily chart, ETH is positioned above the EMA7...
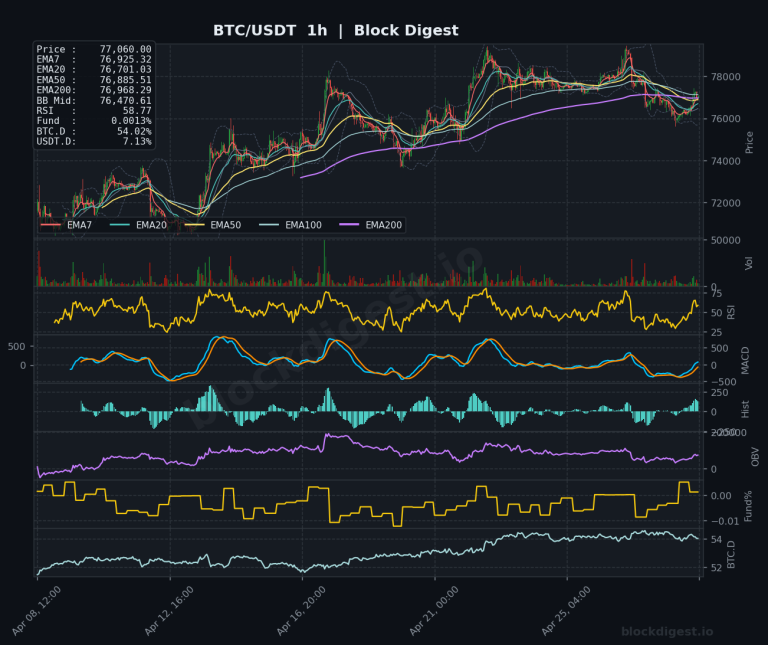
BTC Daily Analysis — April 29, 2026
BTC Daily Analysis – April 29, 2026 Market Overview Bitcoin is currently trading at $77,060, positioned slightly above the critical cluster of short-term EMAs while facing significant resistance from higher timeframe moving averages. The price sits above the EMA7 ($77,080 on daily), EMA20 ($75,538), and EMA50 ($73,573), but remains decisively below the EMA200 ($82,509), indicating...
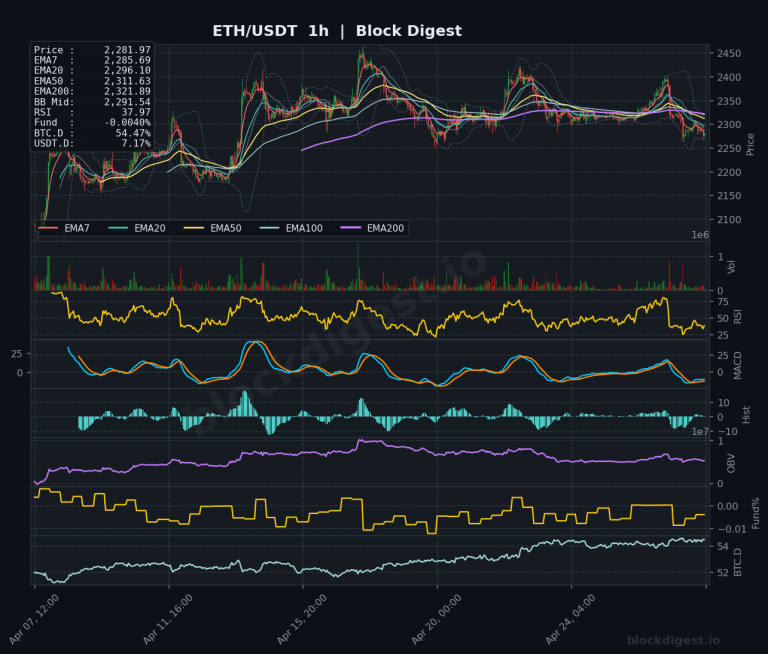
ETH Daily Analysis — April 28, 2026
Market Overview Ethereum is trading at $2,281.97, positioned below all major exponential moving averages on the 1-hour timeframe, signaling short-term bearish pressure. The daily chart reveals price trading near the lower Bollinger Band with the EMA structure showing a bearish configuration as shorter-term EMAs (EMA7 at $2,316.01) remain below longer-term averages (EMA200 at $2,627.13). The...
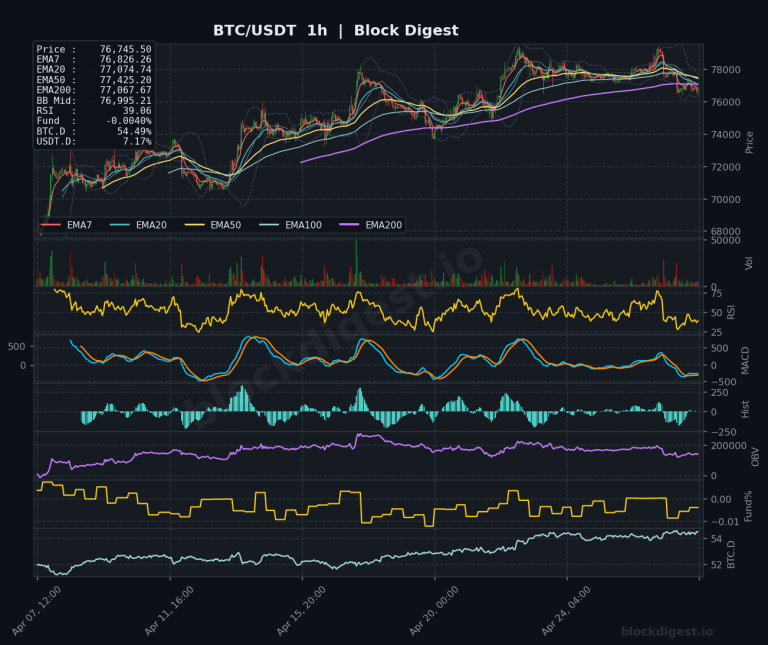
BTC Daily Analysis — April 28, 2026
Market Overview Bitcoin is trading at $76,745, exhibiting signs of weakness as price action has breached below multiple short-term exponential moving averages on the hourly timeframe. The current price sits below the EMA7 ($76,826), EMA20 ($77,074), EMA50 ($77,425), and EMA200 ($77,067), indicating immediate bearish pressure. On the daily chart, BTC remains structurally compromised below the...

ETH Daily Analysis — April 27, 2026
Market Overview Ethereum is trading at $2,319.81, consolidating just below the short-term moving averages in what appears to be a corrective phase within a broader neutral-to-bearish structure. The price is positioned below the EMA7 ($2,346.22) and EMA20 ($2,351.92) on the 1-hour chart, indicating near-term weakness, while on the daily timeframe ETH remains compressed between the...
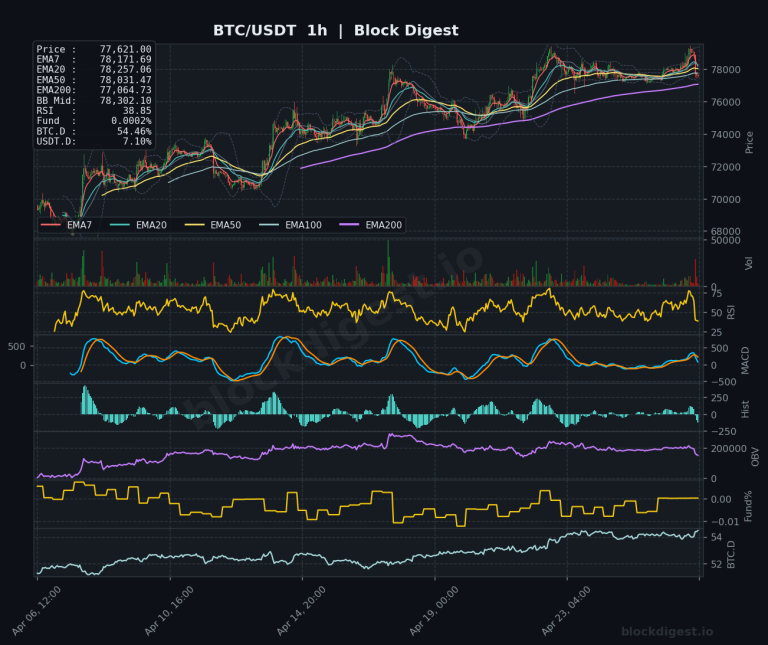
BTC Daily Analysis — April 27, 2026
Market Overview Bitcoin is trading at $77,621, consolidating just above the middle Bollinger Band at $78,302 on the 1-hour chart while maintaining position above the EMA7 ($78,171). The daily timeframe reveals BTC remains well below key moving averages, with price trading beneath EMA50 ($73,324) and significantly under EMA200 ($82,597), indicating a bearish longer-term structure despite...
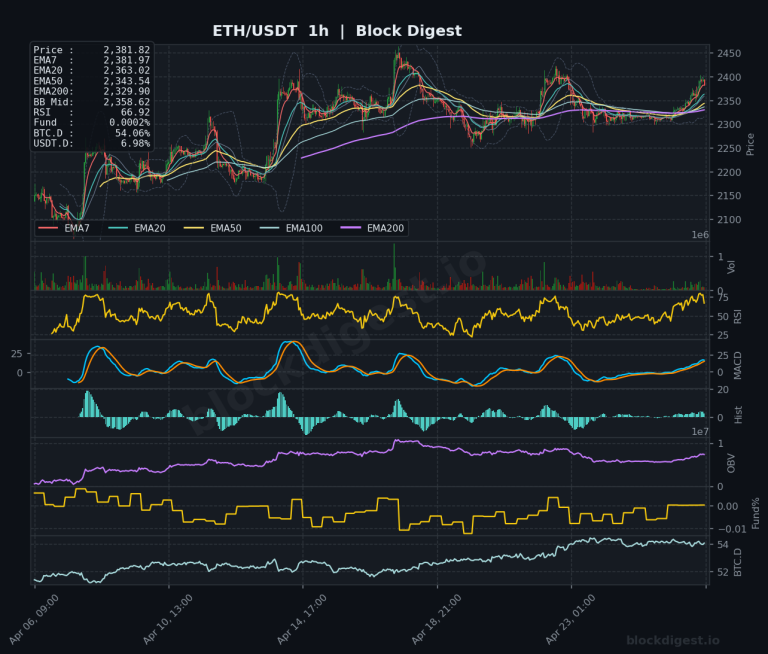
ETH Daily Analysis — April 27, 2026
Market Overview Ethereum is trading at $2,381.82, positioned in a neutral consolidation zone as price action remains compressed between key moving averages. The daily chart shows ETH currently trading below the EMA20 ($2,299.67) and EMA50 ($2,243.14) but above the rising EMA200 ($2,630.77), indicating a medium-term bearish structure with recent recovery attempts. On the 1-hour timeframe,...
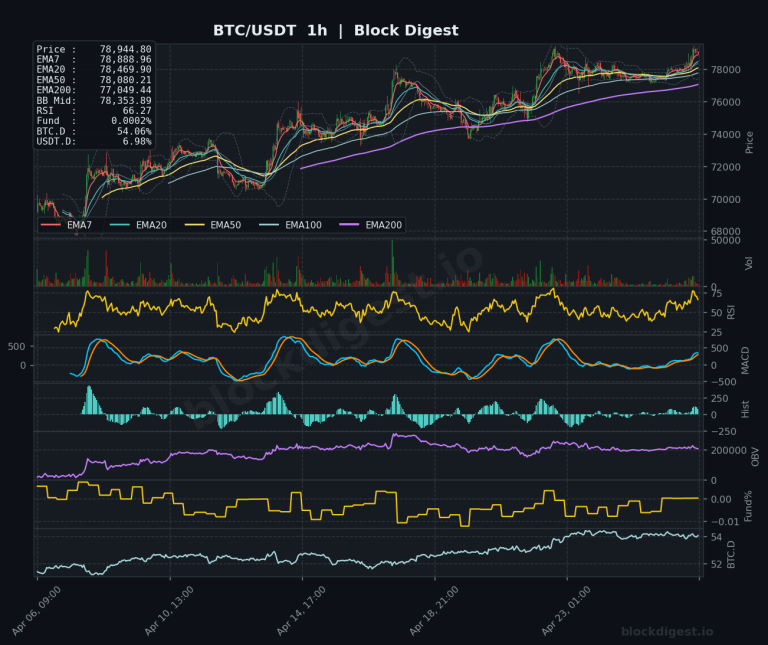
BTC Daily Analysis — April 27, 2026
Market Overview Bitcoin is trading at $78,944.80, demonstrating renewed bullish momentum after establishing a strong uptrend structure across multiple timeframes. The price is currently positioned above all major exponential moving averages on the 1-hour and 4-hour charts, with the EMA7 ($77,754.40) providing immediate support on the daily timeframe. On the 1-hour chart, BTC is trading...