
daily analysis
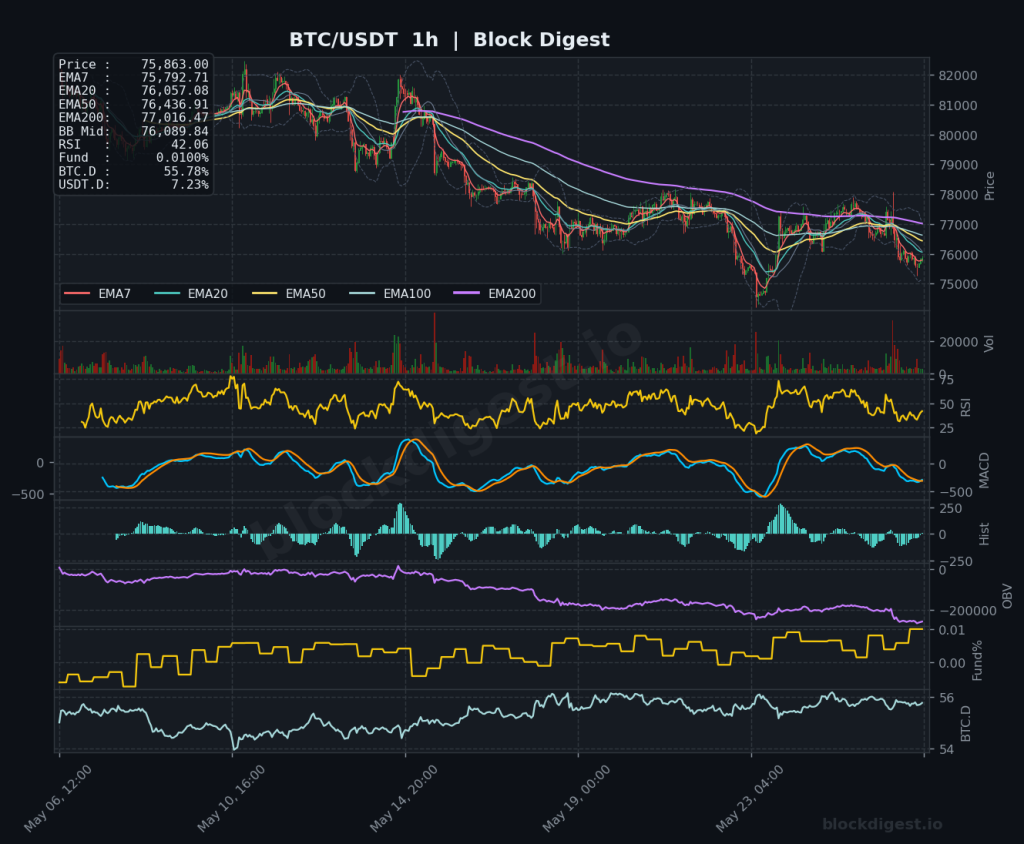
Bitcoin Daily Analysis: BTC at $75.8K Below Bearish EMA Stack
Market Overview Bitcoin is trading at $75,863 as of May 27, 2026, sitting in a technically precarious position well below its all-time high of $126,272 reached in October 2025. Price action on the daily timeframe reflects a prolonged corrective structure, with BTC trading beneath its EMA7 ($76,598), EMA20 ($77,477), EMA50 ($76,684), and significantly below the...

Ethereum Daily Analysis: ETH at $2,098 Below Key EMAs, Bearish Trend
Market Overview ETH/USDT is trading at $2,098.38, sitting in a structurally weak position across all timeframes. On the daily chart, price remains firmly below all major EMAs — the EMA7 at $2,114.21, EMA20 at $2,174.23, EMA50 at $2,216.25, and the EMA200 at $2,524.91 — confirming a sustained bearish trend that has been in place since...
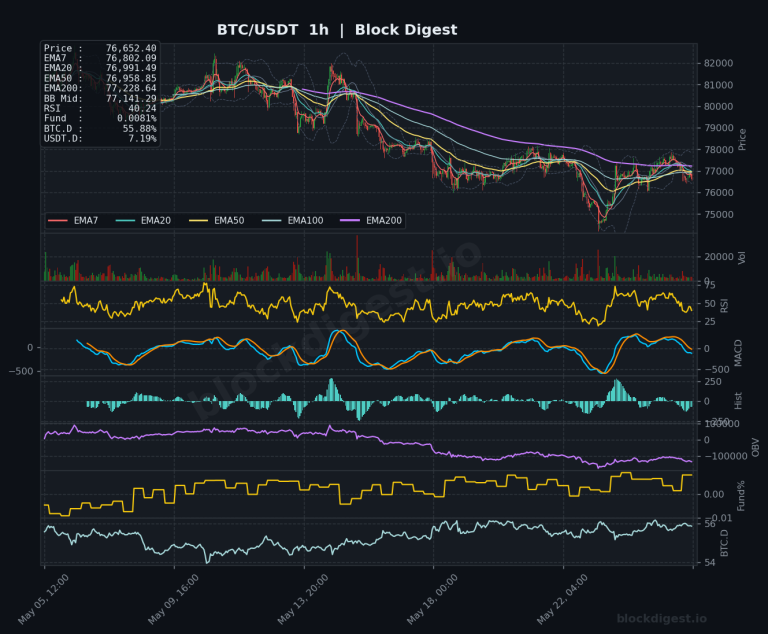
Bitcoin Daily Analysis: Bitcoin below key EMAs at $76,657
Market Overview Bitcoin is trading at approximately $76,657 as of May 26, 2026, caught in a technically precarious position across all major timeframes. Price is currently below all key EMAs on the daily chart — the EMA7 at $77,031, EMA20 at $77,718, and EMA50 at $76,747 — with price hovering just marginally above the EMA50,...
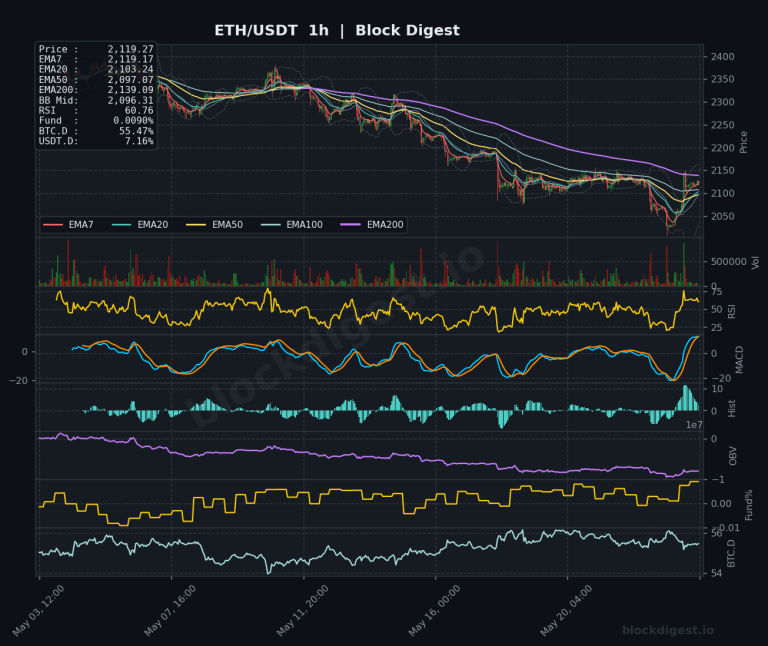
Ethereum Daily Analysis: ETH at $2,119 Below Key EMA Levels
Market Overview ETH/USDT is currently trading at $2,119.27, caught in a structurally weak position on the daily timeframe following a prolonged decline from highs above $4,000. Price sits below all major daily EMAs — the EMA20 at $2,191.55, EMA50 at $2,226.32, and the EMA200 at $2,533.59 — confirming a bearish macro structure. The daily Bollinger...
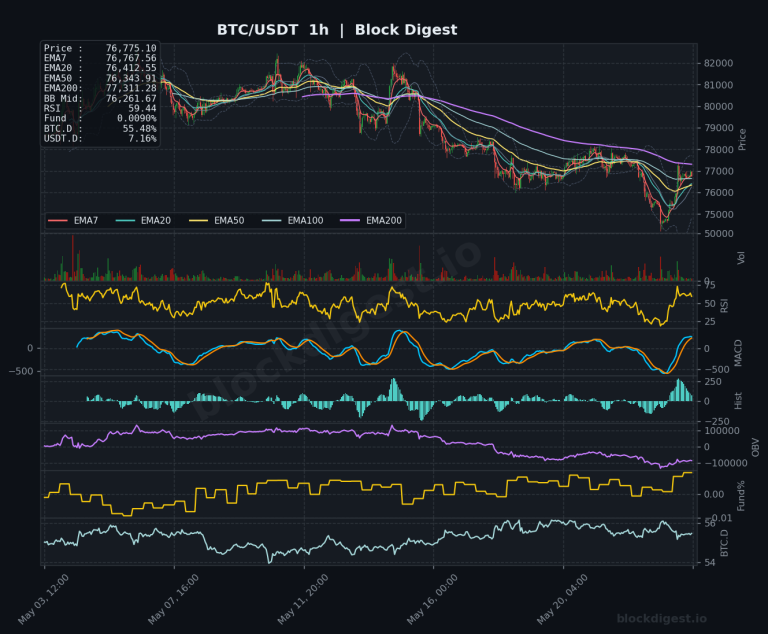
Bitcoin Daily Analysis: Bitcoin at $76,775 Below Major EMAs
Market Overview Bitcoin is currently trading at $76,775, situated in a technically challenged position below all major daily EMAs except the EMA50 ($76,719), which it is barely clinging to. On the daily timeframe, price sits well beneath the EMA7 ($77,050), EMA20 ($77,863), and the formidable EMA200 ($81,615), painting a structurally bearish picture from the higher...

Ethereum Daily Analysis: ETH breaks below $2,100 as bearish structure deepens
Market Overview ETH/USDT is currently trading at approximately $2,022–2,023, having broken decisively below the psychologically significant $2,100 level. Price sits well beneath all key EMAs on the daily timeframe — EMA7 at $2,106, EMA20 at $2,190, EMA50 at $2,227, and the EMA200 at $2,536 — confirming a deeply bearish market structure. The Bollinger Band midline...

Bitcoin Daily Analysis: Bitcoin Below All EMAs, Long-Term Resistance at $81K
Market Overview Bitcoin is trading at approximately $74,964 as of May 23, 2026, sitting beneath all major EMAs across every timeframe — a structurally bearish configuration. On the daily chart, price has broken below the EMA7 ($76,709), EMA20 ($77,813), and EMA50 ($76,649), and remains a significant distance from the EMA200 at $81,632, which continues to...

Ethereum Daily Analysis: ETH Trapped Below All Major Daily EMAs
Market Overview ETH/USDT is currently trading at $2,129.61, sitting in a technically precarious position beneath all major daily EMAs — EMA7 ($2,150.30), EMA20 ($2,214.02), EMA50 ($2,237.88), and EMA200 ($2,543.04). The daily Bollinger Band midline at $2,249.22 sits well above current price, reinforcing the bearish market structure that has dominated since the mid-2025 highs above $4,000....

Bitcoin Daily Analysis: Below EMA200 at $81,734 Near $77K Support
Market Overview Bitcoin is currently trading at $77,416.40, sitting in a technically precarious position as price consolidates beneath a cluster of short-term EMAs on the daily timeframe. The daily chart reveals a market in recovery mode following a prolonged sell-off from the all-time highs above $122,000, with price now attempting to stabilize near the $77,000–$78,000...
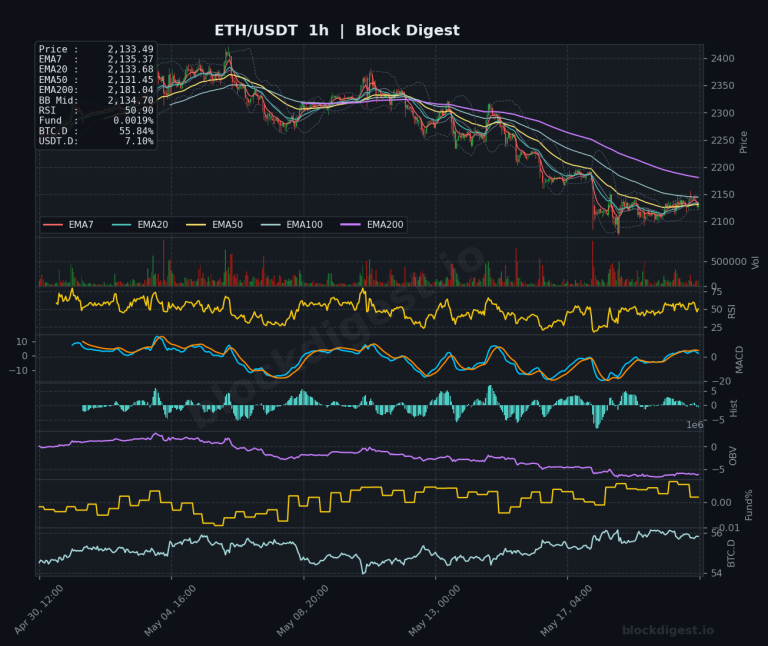
Ethereum Daily Analysis: ETH Below All EMAs, Eyes $2,133
Market Overview ETH/USDT is currently trading at $2,133.49, sitting in a structurally weak position on the daily timeframe after a sustained decline from highs above $4,000 recorded mid-2025. Price is trading well below all major daily EMAs — EMA7 at $2,157.37, EMA20 at $2,222.97, EMA50 at $2,242.32, and the EMA200 at $2,547.57 — confirming that...

Bitcoin Daily Analysis: Stuck Below $80K and Declining EMAs
Market Overview Bitcoin is trading at approximately $77,767 as of May 21, 2026, remaining stubbornly below the psychologically significant $80,000 level and struggling to reclaim key overhead resistance. On the daily timeframe, price is sandwiched below a declining EMA20 ($78,401) and EMA200 ($81,793), while sitting just above the EMA50 ($76,774) — a structure that reflects...

ETH Daily Analysis — May 20, 2026
Market Overview Ethereum is trading at $2,128.15, positioned well below all major exponential moving averages across timeframes, signaling continued bearish pressure. The daily chart shows price trading beneath the EMA7 ($2,165), EMA20 ($2,232), EMA50 ($2,246), and significantly below the EMA200 ($2,553), confirming a firmly established downtrend. The Bollinger Bands on the 1-hour chart show price...