
daily analysis
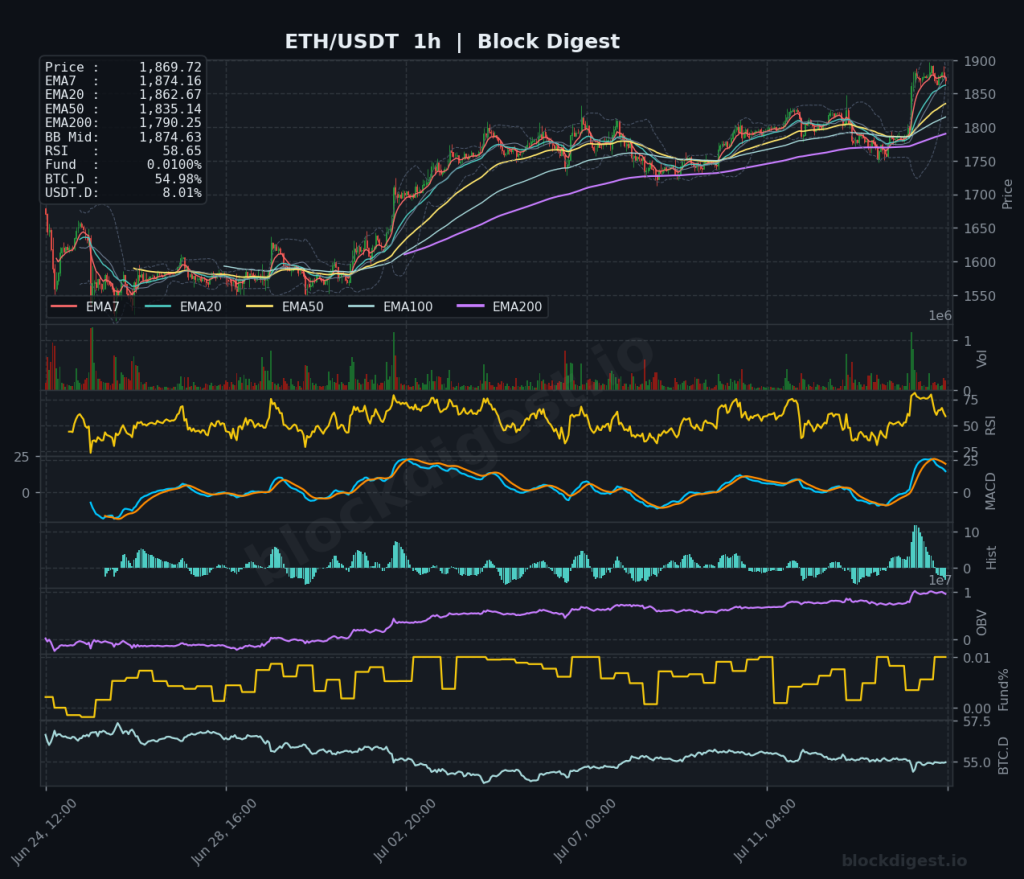
Ethereum Daily Analysis: Ethereum Breaks Upper Bollinger Band at $1,868
Market Overview Ethereum is trading at $1,868.42, up 6.67% on the day, following a cooler-than-expected June CPI print that reinvigorated risk appetite across crypto markets. Price is pressing against the upper Bollinger Band on the 1-hour chart with the BB midline sitting at $1,874.63, suggesting short-term extension but not yet exhaustion. On the 1-hour timeframe,...

Bitcoin Daily Analysis: Bitcoin holds $64.6K above Bollinger midlines
Market Overview Bitcoin is trading around $64,594 on July 15, 2026, sitting above the Bollinger Band midline on the 1-hour chart ($64,593) and just above the 4-hour BB midline ($63,572), suggesting short-term bullish positioning. On the daily timeframe, price remains below the EMA50 ($65,116) — a critical resistance level that has capped multiple recovery attempts...

Ethereum Daily Analysis: Ethereum Consolidates Between EMA50 Resistance and EMA20 Support
Market Overview Ethereum is currently trading at $1,779.96, down approximately 1.31% over the past 24 hours, consolidating in a narrow band after a notable recovery from cycle lows. On the daily timeframe, price remains sandwiched between the EMA50 at $1,798.04 — acting as immediate overhead resistance — and the EMA20 at $1,744.73, which has been...

Bitcoin Daily Analysis: Bitcoin Below Key EMAs Amid 30% Decline
Market Overview Bitcoin is currently trading at $62,537, sitting in a precarious position below all major EMAs on the daily timeframe. The daily chart confirms a dominant downtrend that has been in place since early 2026, with price having shed roughly 30% from its highs above $93,000. Price is trading just above the daily Bollinger...
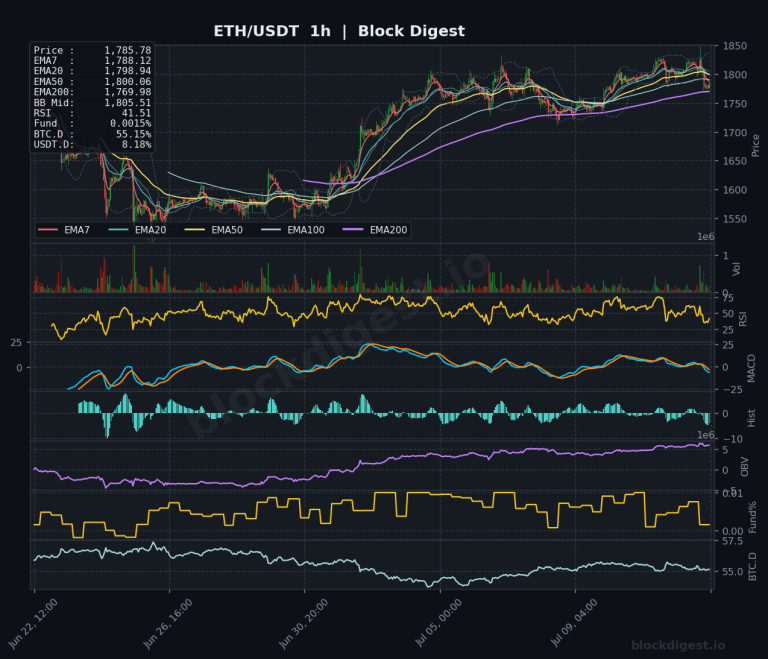
Ethereum Daily Analysis: ETH Below EMA50 as Bearish Structure Persists
Market Overview ETH/USDT is currently trading at $1,785.88, situated in a technically precarious position as it attempts to consolidate after a significant multi-month downtrend visible on the daily chart. Price is trading below the daily EMA200 ($2,217.93) and just beneath the EMA50 ($1,799.16), confirming that the broader macro structure remains bearish. On the daily Bollinger...

Bitcoin Daily Analysis: Bitcoin at $62,952 Below Key EMAs
Market Overview Bitcoin is trading at $62,952.40 as of July 13, 2026, navigating a critical inflection zone after recovering from a 21-month low near $58,000 printed in late June. On the daily timeframe, price remains firmly below all major EMAs — the EMA50 sits at $65,167.73, the EMA200 at $74,709.90 — confirming that the macro...

Ethereum Daily Analysis: ETH Tests EMA50 at $1,799 With Key Convergence
Market Overview ETH/USDT is trading at $1,797.52 as of July 12, 2026, sitting in a technically nuanced zone where several short- and medium-term EMAs converge. On the daily timeframe, price has recently reclaimed the EMA7 ($1,772.57) and EMA20 ($1,736.54), and is now testing the daily EMA50 at $1,799.37 — a level that has historically acted...
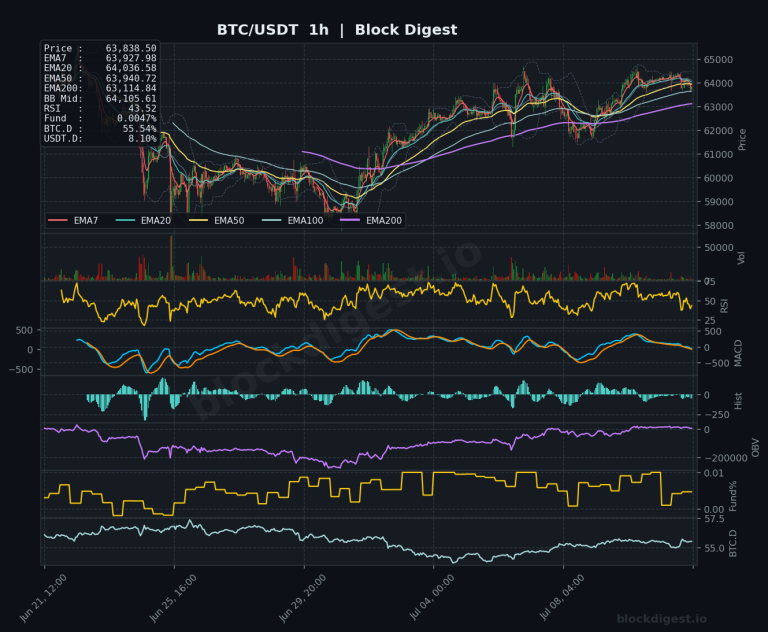
Bitcoin Daily Analysis: Bitcoin Below EMA200 After $126K Correction
Market Overview Bitcoin is trading at approximately $63,838 as of July 12, 2026, sitting in a technically precarious zone following a dramatic correction from its all-time high of $126,080. On the daily timeframe, price remains below the EMA200 ($74,817) and EMA50 ($65,261), confirming that the macro trend is still bearish despite a modest recovery attempt...
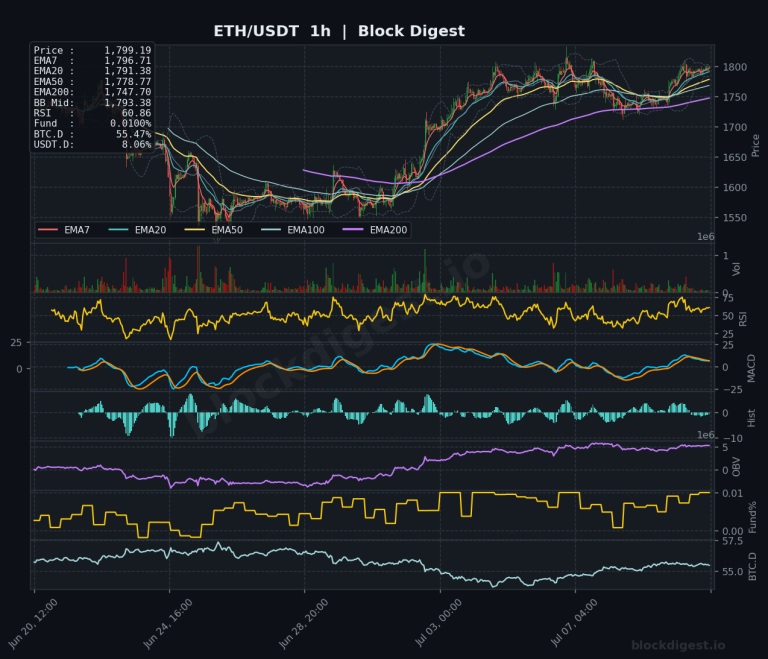
Ethereum Daily Analysis: Ethereum Tests EMA50 Resistance at $1,799
Market Overview Ethereum is trading at approximately $1,794–$1,799 as of July 11, 2026, posting a modest 2.85% gain over the past 24 hours in line with broader crypto market recovery. On the daily timeframe, price is testing the EMA50 ($1,799.95) — a level that has acted as dynamic resistance throughout the recent corrective phase —...
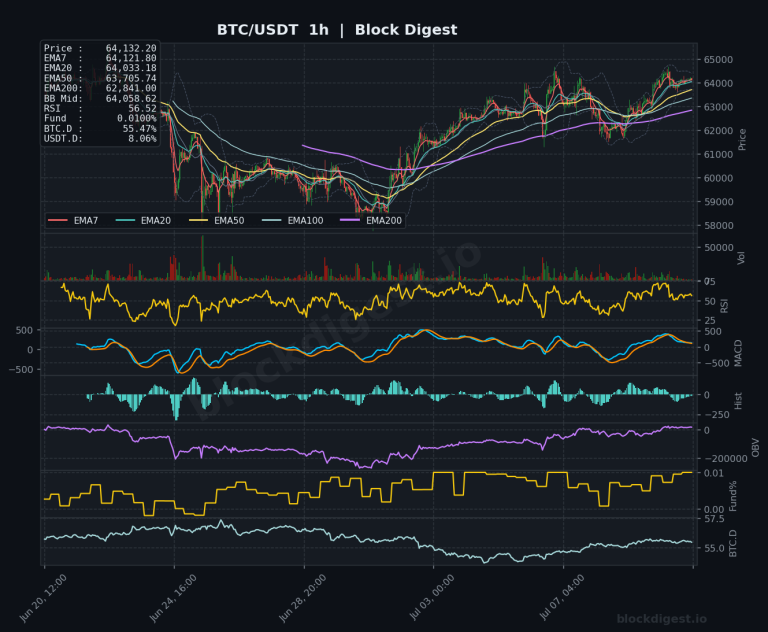
Bitcoin Daily Analysis: Bitcoin Below EMA50 in Macro Downtrend
Market Overview Bitcoin is currently trading at $64,132–$64,153, sitting in a notable zone of technical tension following a significant multi-month decline from all-time highs near $108,000–$123,000 recorded earlier this cycle. On the daily timeframe, price remains below the EMA50 ($65,333) and well beneath the EMA200 ($74,933), confirming the dominant structure is still a macro downtrend...
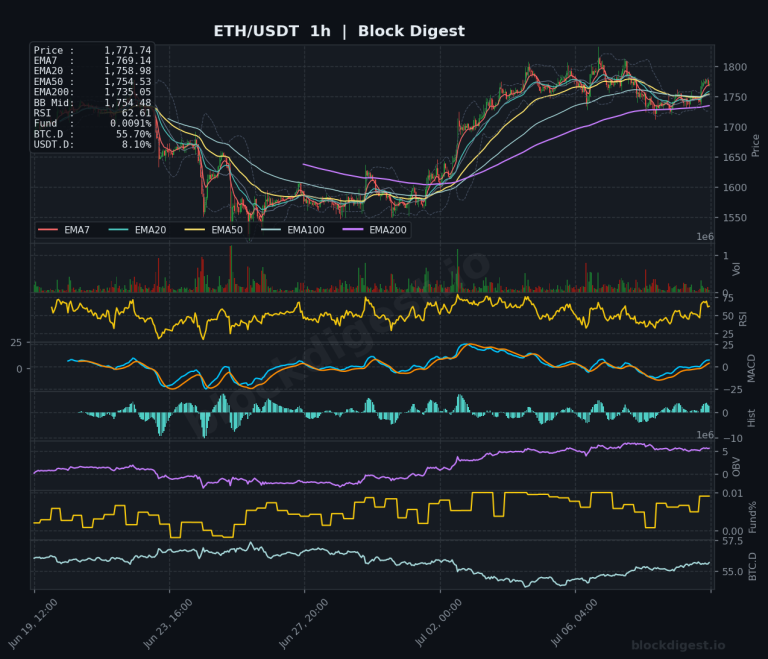
Ethereum Daily Analysis: ETH Consolidates Below EMA50 and EMA200 Resistance
Market Overview ETH/USDT is currently trading at $1,771.83, navigating a technically significant zone as price attempts to consolidate above the cluster of short-term EMAs on the hourly chart. On the daily timeframe, the dominant trend remains bearish — price is trading well below the EMA200 ($2,231.46) and EMA50 ($1,799.02), both of which are sloping downward...

Bitcoin Daily Analysis: Bitcoin at $63,925 Bouncing Above EMA Levels
Market Overview Bitcoin is trading at $63,925 as of July 10, 2026, holding above all short-term EMAs on the 1-hour chart while attempting to reclaim meaningful ground following a recovery from late-June lows near $58,000. On the daily timeframe, price remains well below the EMA200 ($75,037) and EMA50 ($65,374), confirming that the broader macro trend...