Ethereum Daily Analysis: Ethereum Breaks Upper Bollinger Band at $1,868
Market Overview
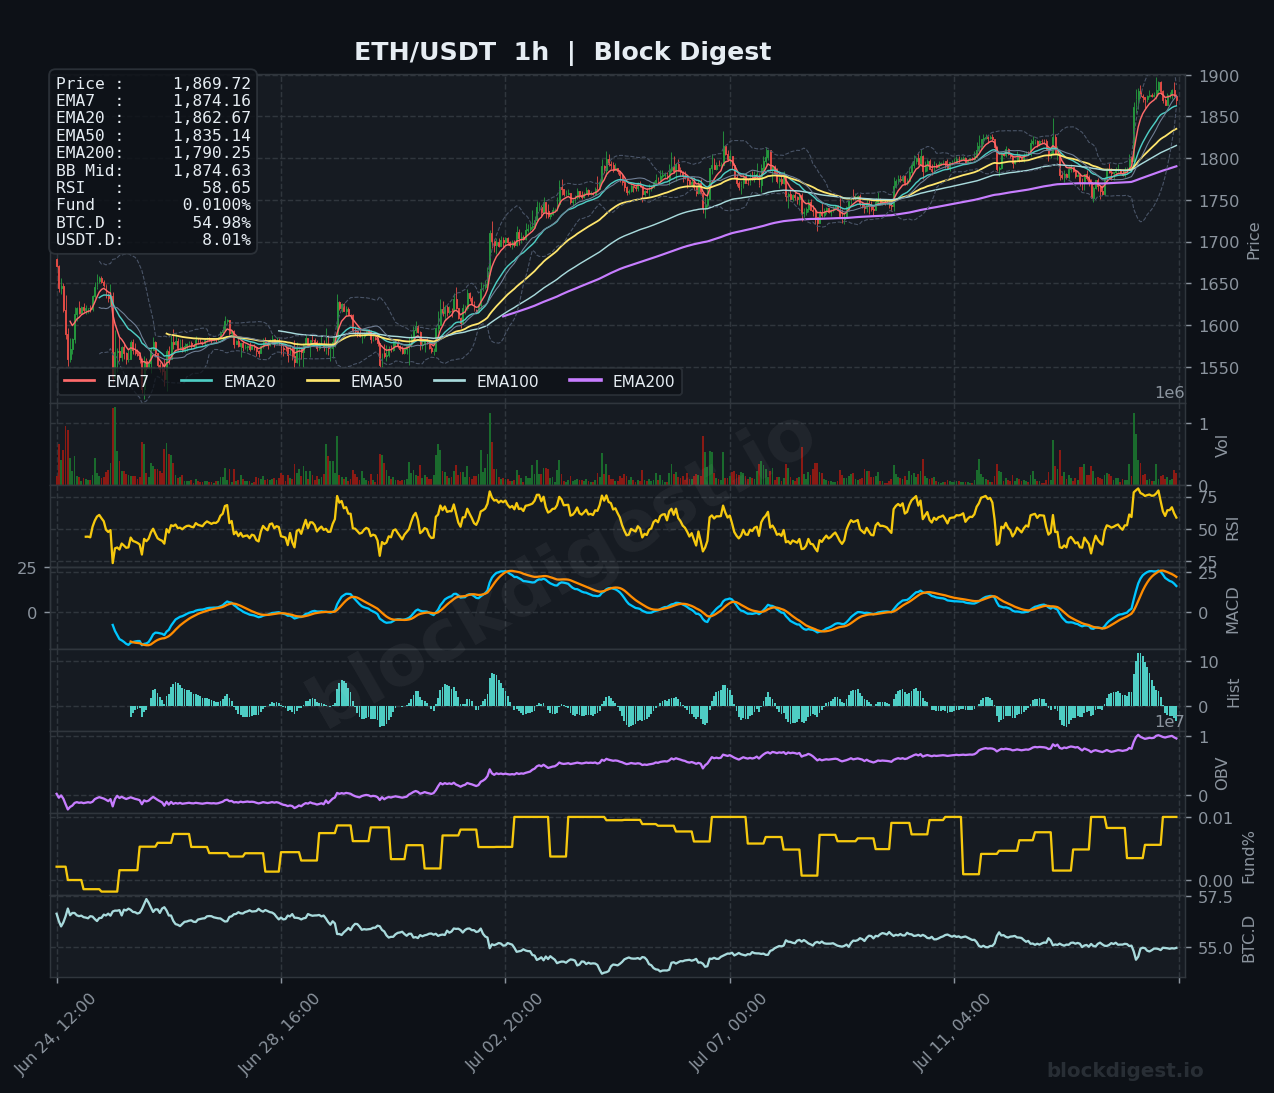
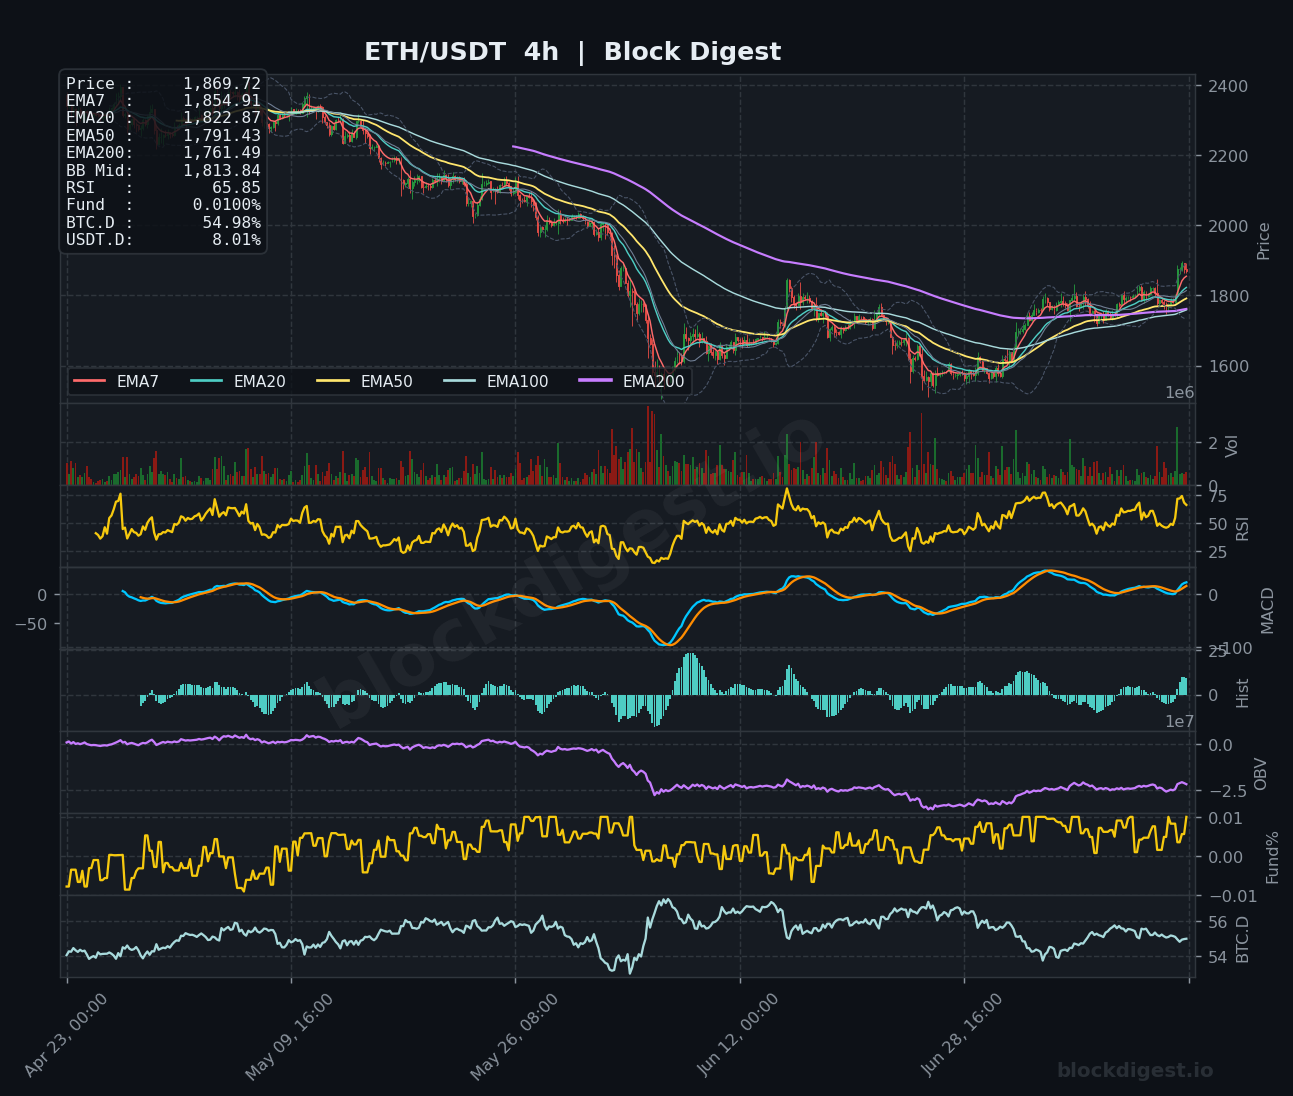
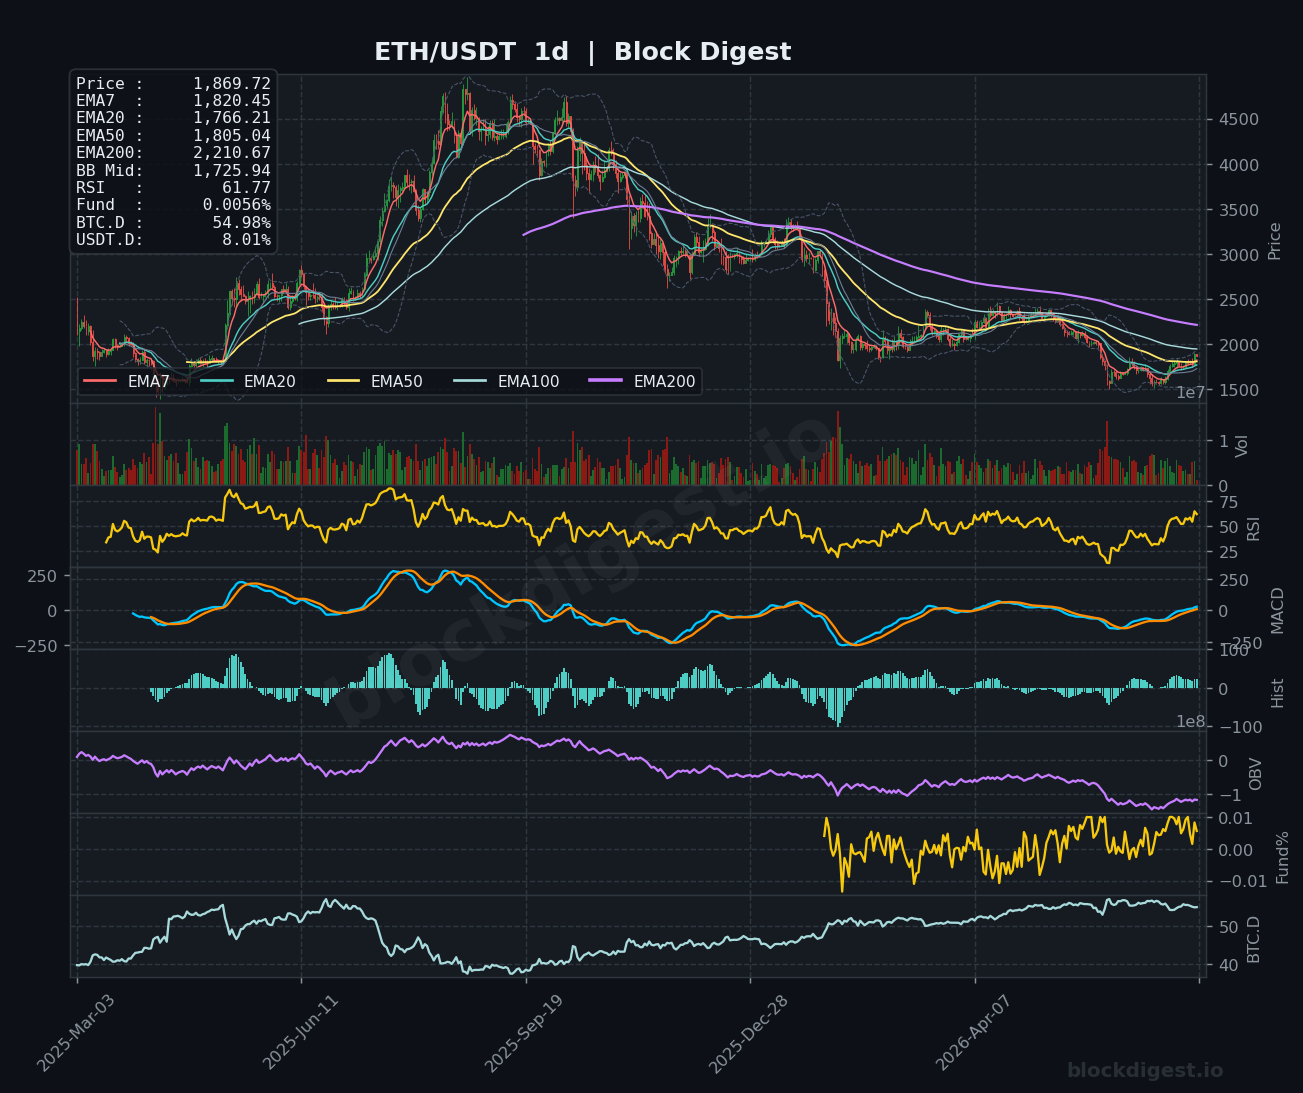
Ethereum is trading at $1,868.42, up 6.67% on the day, following a cooler-than-expected June CPI print that reinvigorated risk appetite across crypto markets. Price is pressing against the upper Bollinger Band on the 1-hour chart with the BB midline sitting at $1,874.63, suggesting short-term extension but not yet exhaustion. On the 1-hour timeframe, ETH has reclaimed all key short-term EMAs, with price trading just below EMA7 ($1,874.16) and comfortably above EMA20 ($1,862.67), EMA50 ($1,835.14), and EMA200 ($1,790.25). On the daily chart, the dominant structure remains a recovery from multi-month lows, with price now trading above the EMA7 ($1,820.45) and EMA50 ($1,805.04) but still significantly below the EMA200 ($2,210.67), underscoring that the macro trend remains structurally bearish even as near-term momentum shifts positively.
Multi-Timeframe Confluence
The 1-hour timeframe shows a well-established uptrend from mid-June lows with price sustaining above all major EMAs and MACD in strong bullish territory — the recent sharp histogram expansion is the most aggressive seen on this timeframe in several weeks. On the 4-hour chart, ETH has successfully broken above the EMA20 ($1,822.87) and EMA50 ($1,791.43), and is now testing the EMA200 ($1,761.49) from above, a meaningful structural reclaim after a prolonged downtrend from the $2,400 area. The daily chart provides important context: while shorter timeframes are bullish, the EMA200 at $2,210.67 represents a formidable macro resistance ceiling, meaning the current rally is best characterized as a recovery within a larger corrective structure rather than a confirmed trend reversal. The $1,870–$1,900 zone is where near-term momentum meets intermediate resistance, creating a critical decision point across all three timeframes.
Key Levels to Watch
- Resistance: $1,900 — Psychological round number and upper Bollinger Band proximity on the 1-hour chart; a clean break here would signal momentum extension. $1,950–$1,960 — Prior consolidation zone visible on the 4-hour chart before the breakdown in May; likely the first significant supply pocket. $2,210 — Daily EMA200, the major macro resistance that defines the line between recovery and structural trend reversal.
- Support: $1,835 — 1-hour EMA50 and an intraday pivot; a hold here on any pullback would confirm bullish structure. $1,790–$1,800 — 1-hour EMA200 and 4-hour EMA50 cluster; this is the critical support confluence that underpins the recent rally. $1,725 — Daily BB midline; losing this level would signal that the recovery attempt is failing and shift bias back to neutral-to-bearish.
Momentum & On-Chain Signals
The RSI readings paint a progressively strengthening picture: 58.65 on the 1-hour (healthy, not overbought), 65.85 on the 4-hour (elevated but room to run before reaching 70), and 61.77 on the daily (rising from deeply oversold conditions, confirming genuine momentum recovery). The 1-hour and 4-hour MACD lines are in sharp bullish crossover with expanding histograms — the 4-hour histogram is at its most positive reading in several months, corroborating the strength of the current move. OBV on the 1-hour is trending steadily upward, indicating accumulation, though the 4-hour OBV remains below its prior cycle peak, suggesting institutional re-accumulation is still in progress rather than complete. The funding rate sits at a neutral 0.01%, which is a constructive sign — there is no excessive leveraged long buildup that would make the rally fragile.
BTC Dominance & Market Sentiment
BTC dominance at 54.98% remains elevated but has been gradually declining from recent highs around 57%, which is a mild positive signal for altcoin relative performance. USDT dominance at 8.01% suggests that while a degree of risk-off capital remains parked in stablecoins, it has not elevated further — a stabilization rather than active rotation out of risk assets. For ETH specifically, the declining BTC.D trend visible on the 1-hour chart combined with Morgan Stanley’s S-1 filings for a spot Ethereum ETF provides both technical and fundamental tailwinds for ETH outperformance relative to BTC in the near term.
Risk Scenarios
- Bullish case: A confirmed close above $1,900 on the 4-hour timeframe, supported by continued ETF inflow momentum and positive macro sentiment, would open the path toward the $1,950–$1,960 resistance cluster, with a medium-term target near $2,100 if BTC sustains above $65,000.
- Bearish case: Failure to hold $1,835 on a pullback, particularly if accompanied by a MACD bearish crossover on the 4-hour, would suggest the rally is exhausting and could see ETH retest the $1,790–$1,800 support zone; a daily close below $1,725 would materially damage the recovery thesis.
Outlook
The weight of evidence across all three timeframes favors a cautiously bullish bias over the next 24–48 hours, with the CPI catalyst and ETF narrative providing fundamental support for the technical breakout. The immediate focus is whether ETH can sustain price action above $1,870 and decisively breach $1,900 — a level that aligns with short-term Bollinger Band upper bounds and psychological significance. The neutral funding rate and steady OBV accumulation reduce the risk of a sudden liquidation cascade, but the daily EMA200 at $2,210 remains a structural ceiling that limits the macro upside case for now. Traders should watch the 4-hour MACD and the $1,835 EMA50 support closely — these will be the first indicators to signal whether the current momentum is sustainable or entering a consolidation phase.
Disclaimer: This analysis is for informational purposes only and does not constitute financial advice. Cryptocurrency markets are highly volatile and unpredictable. All trading decisions should be made based on your own research and risk tolerance. Block Digest is not responsible for any financial losses incurred as a result of acting on this content.