
Market Overview
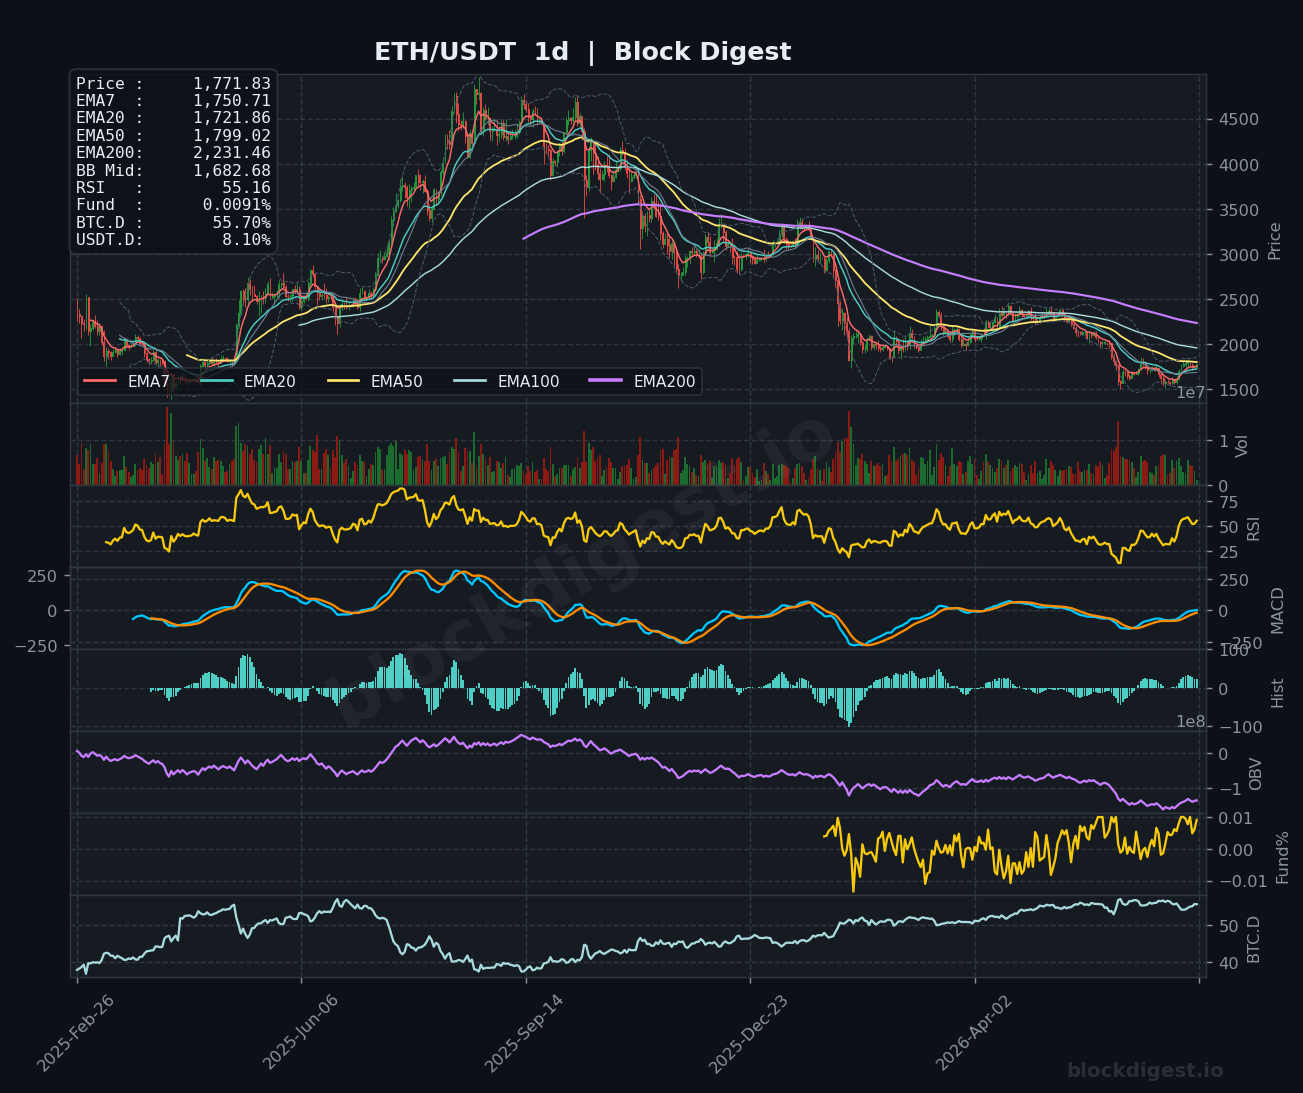
ETH/USDT is currently trading at $1,771.83, navigating a technically significant zone as price attempts to consolidate above the cluster of short-term EMAs on the hourly chart. On the daily timeframe, the dominant trend remains bearish — price is trading well below the EMA200 ($2,231.46) and EMA50 ($1,799.02), both of which are sloping downward and acting as dynamic overhead resistance. The Bollinger Band midline on the daily sits at $1,682.68, and with price trading above it, bulls have managed to reclaim some structural footing following a prolonged decline. However, the broader macro structure remains challenged, with ETH down significantly from cycle highs and still unable to meaningfully breach its medium-term moving average stack.
Multi-Timeframe Confluence
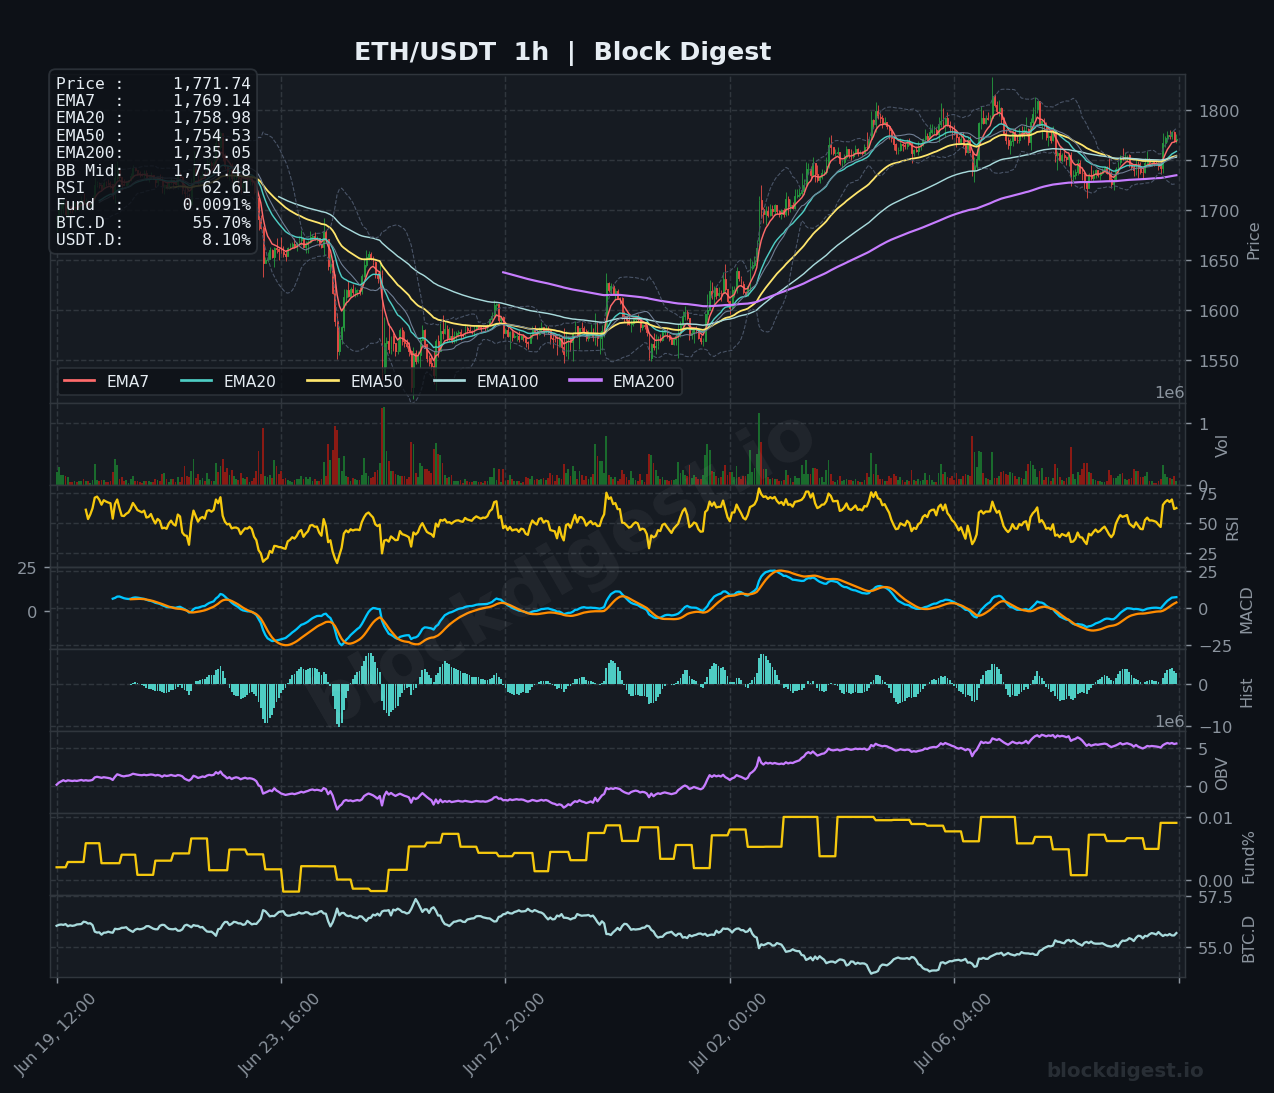
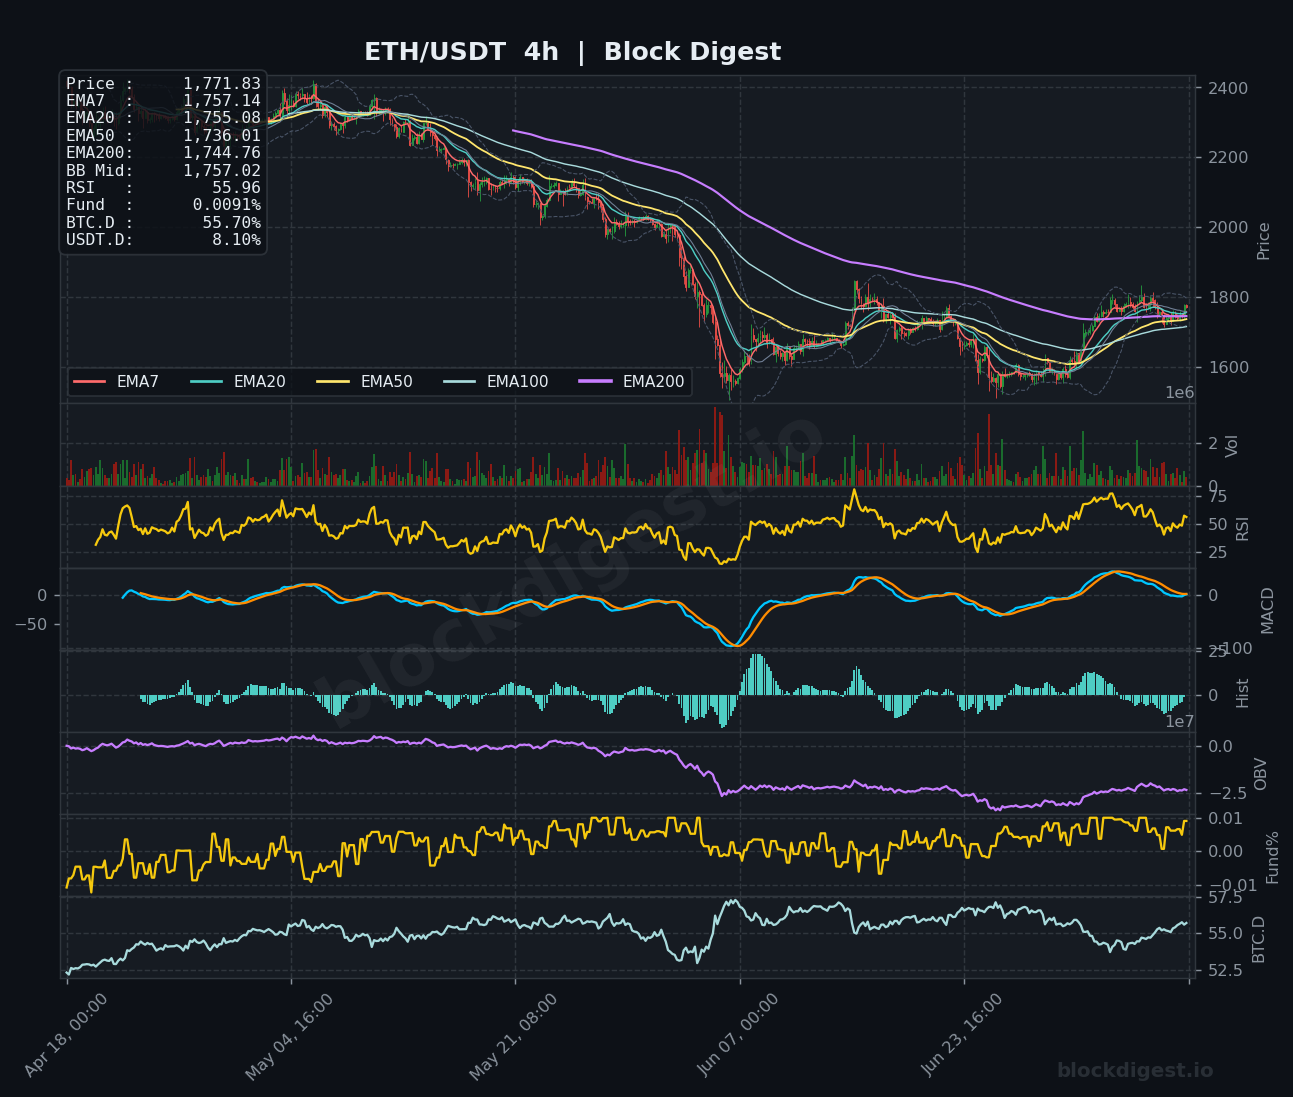
On the 1-hour chart, ETH is trading above all key short-term EMAs (EMA7: $1,769.14, EMA20: $1,758.98, EMA50: $1,754.53, EMA200: $1,735.05), a constructive alignment that signals near-term bullish momentum. The 4-hour chart mirrors this structure — price has reclaimed the EMA7 ($1,757.14), EMA20 ($1,755.08), and EMA50 ($1,736.01), but remains below the descending EMA200 ($1,744.76) on that timeframe, suggesting the recovery is still fragile. The daily chart tells the more cautionary tale: every meaningful EMA above current price represents a potential ceiling, and the EMA50 at $1,799.02 is the first major test bulls need to clear to shift the intermediate trend. Short-term momentum is modestly supportive, but it directly contradicts the dominant bearish structure on the daily.
Key Levels to Watch
- Resistance: $1,799.02 — Daily EMA50, the first major dynamic resistance and a level that has capped price multiple times in recent structure; a clean daily close above here would be a significant shift. $1,820–$1,830 — Recent swing highs visible on the hourly and 4-hour charts representing a near-term supply zone where sellers have previously stepped in aggressively. $2,231.46 — Daily EMA200, the long-term bearish line in the sand; reclaiming this would signal a fundamental trend reversal but remains a distant target given current conditions.
- Support: $1,735.05 — Hourly EMA200 and a key short-term pivot; a loss of this level would suggest the current consolidation is rolling over. $1,682.68 — Daily Bollinger Band midline, a level that recently served as support during the recovery phase and remains an important demand reference. $1,600–$1,620 — Prior structural lows and a historically significant demand zone visible on the 4-hour chart; a retest here would signal a serious deterioration in near-term bullish thesis.
Momentum & On-Chain Signals
The 1-hour RSI at 62.61 is healthy and trending toward overbought territory without yet reaching it, suggesting there may be residual upside momentum in the short term. The 4-hour RSI at 55.96 is neutral-to-bullish, while the daily RSI at 55.16 echoes a similar reading — both sit in the middle of their range, reflecting an indecisive market rather than strong directional conviction. On the 4-hour MACD, the signal and MACD lines are converging near zero with a mildly positive histogram, indicating a cautious recovery rather than a confirmed bullish impulse. The OBV on the 4-hour chart remains depressed relative to earlier highs, pointing to persistent distribution pressure that has not yet reversed, and the daily OBV trend similarly remains in a declining channel — a notable bearish divergence against the recent price recovery that warrants caution.
BTC Dominance & Market Sentiment
BTC dominance currently sits at 55.70% on the charts (with broader market data citing 56.1%), which remains elevated and signals continued capital preference for Bitcoin over altcoins including ETH. USDT dominance at 8.10% suggests there is still a meaningful pool of sidelined capital in stablecoins, reflecting persistent risk-off sentiment rather than broad re-engagement with the market. For ETH specifically, elevated BTC.D suppresses the likelihood of a sustained altcoin rally; historically, ETH outperformance correlates with BTC.D declining, and the current upward trend in BTC dominance is a headwind for any ETH breakout thesis.
Risk Scenarios
- Bullish case: A clean daily close above the EMA50 at $1,799.02, accompanied by rising OBV and a 4-hour MACD bullish crossover, would open the path toward the $1,820–$1,830 resistance cluster and potentially a test of $1,900+ if volume confirms. Continued inflows into spot Bitcoin ETFs could spill over into ETH, especially if BTC dominance begins to roll over from current levels.
- Bearish case: A failure to hold the $1,735 hourly EMA200 on a closing basis, combined with renewed geopolitical risk-off pressure and BTC.D pushing higher, would likely trigger a retest of the $1,682 daily BB midline and potentially the $1,600–$1,620 structural support zone. Persistent distribution on OBV across multiple timeframes supports this scenario as the higher-probability outcome if macro sentiment deteriorates further.
Outlook
ETH’s short-term structure has improved materially over the past week, with price reclaiming its full short-term EMA stack on the 1-hour chart and holding above critical support. However, the daily timeframe remains structurally bearish, with the EMA50 at $1,799.02 representing the immediate ceiling that bulls must overcome to shift the narrative. The next 24–48 hours are critical: a sustained move above $1,800 with volume confirmation would be the first meaningful bullish signal, while a drop below $1,735 would indicate the recovery is stalling. Geopolitical risk-off sentiment and elevated BTC dominance remain the primary macro headwinds, keeping the overall directional bias cautiously neutral-to-bearish until higher timeframe resistance levels are convincingly reclaimed.
Disclaimer: This analysis is for informational purposes only and does not constitute financial advice. Cryptocurrency markets are highly volatile and unpredictable. All trading decisions should be made based on your own research and risk tolerance. Block Digest is not responsible for any financial losses incurred as a result of acting on this content.
Stay Ahead of the Market
Follow BlockDigest for crypto market intelligence, research and real-time updates.


