Bitcoin Daily Analysis: Bitcoin Below Key EMAs Amid 30% Decline
Market Overview
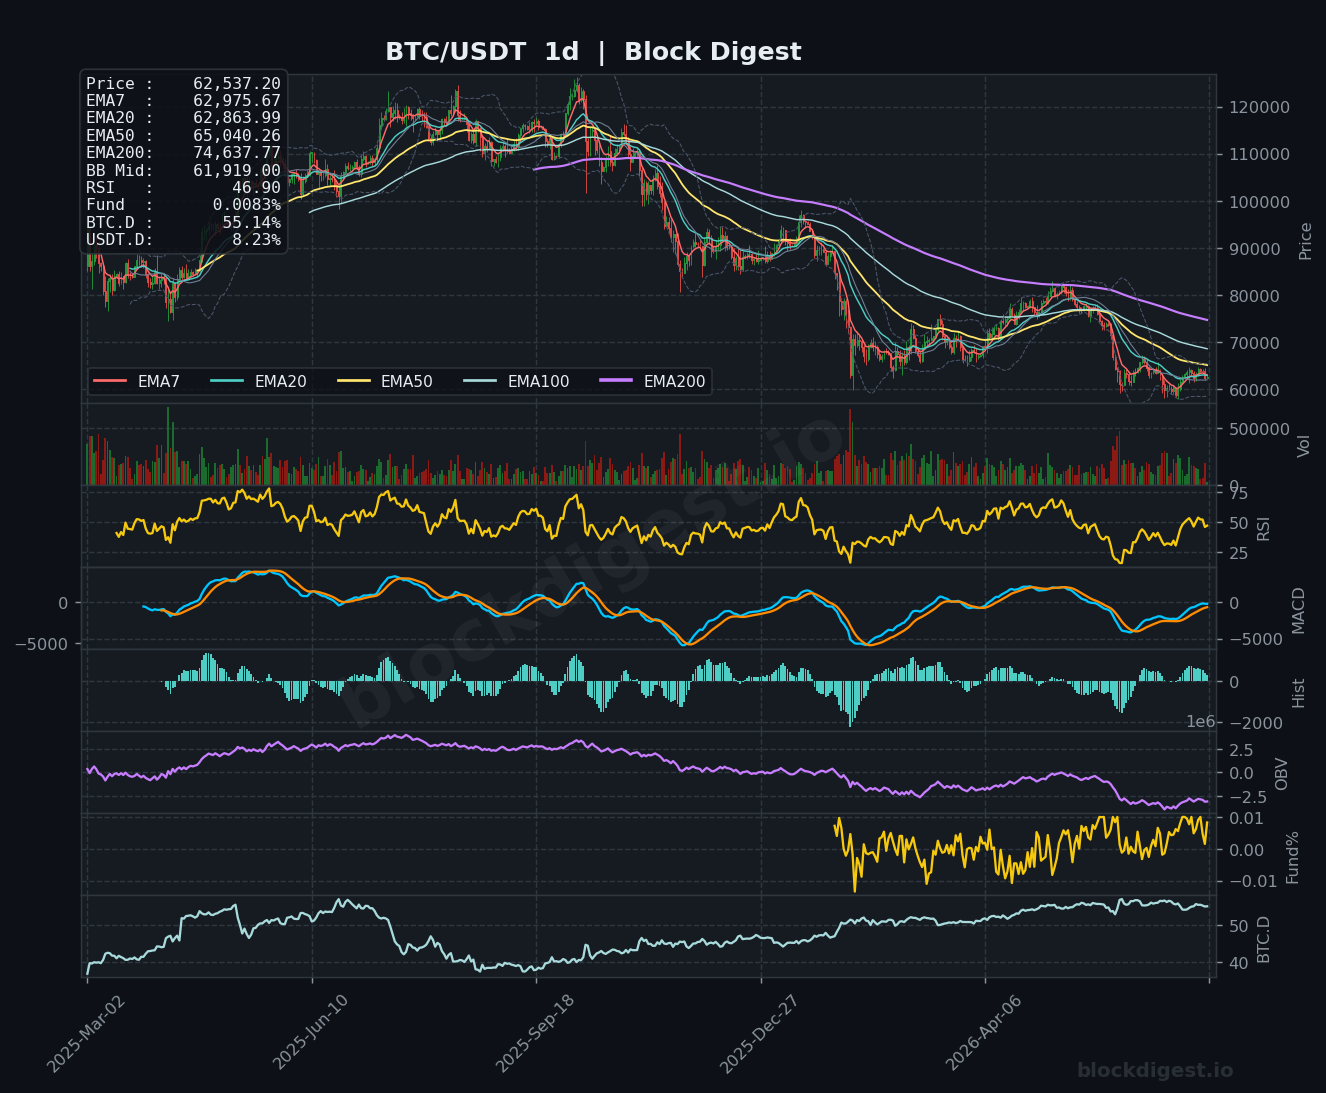
Bitcoin is currently trading at $62,537, sitting in a precarious position below all major EMAs on the daily timeframe. The daily chart confirms a dominant downtrend that has been in place since early 2026, with price having shed roughly 30% from its highs above $93,000. Price is trading just above the daily Bollinger Band midline at $61,919, but remains well beneath the EMA50 ($65,040), EMA200 ($74,637), and the descending EMA7 ($62,975) and EMA20 ($62,863), all of which are acting as dynamic resistance overhead. The overall macro structure remains bearish until BTC can reclaim and hold above these declining moving averages.
Multi-Timeframe Confluence
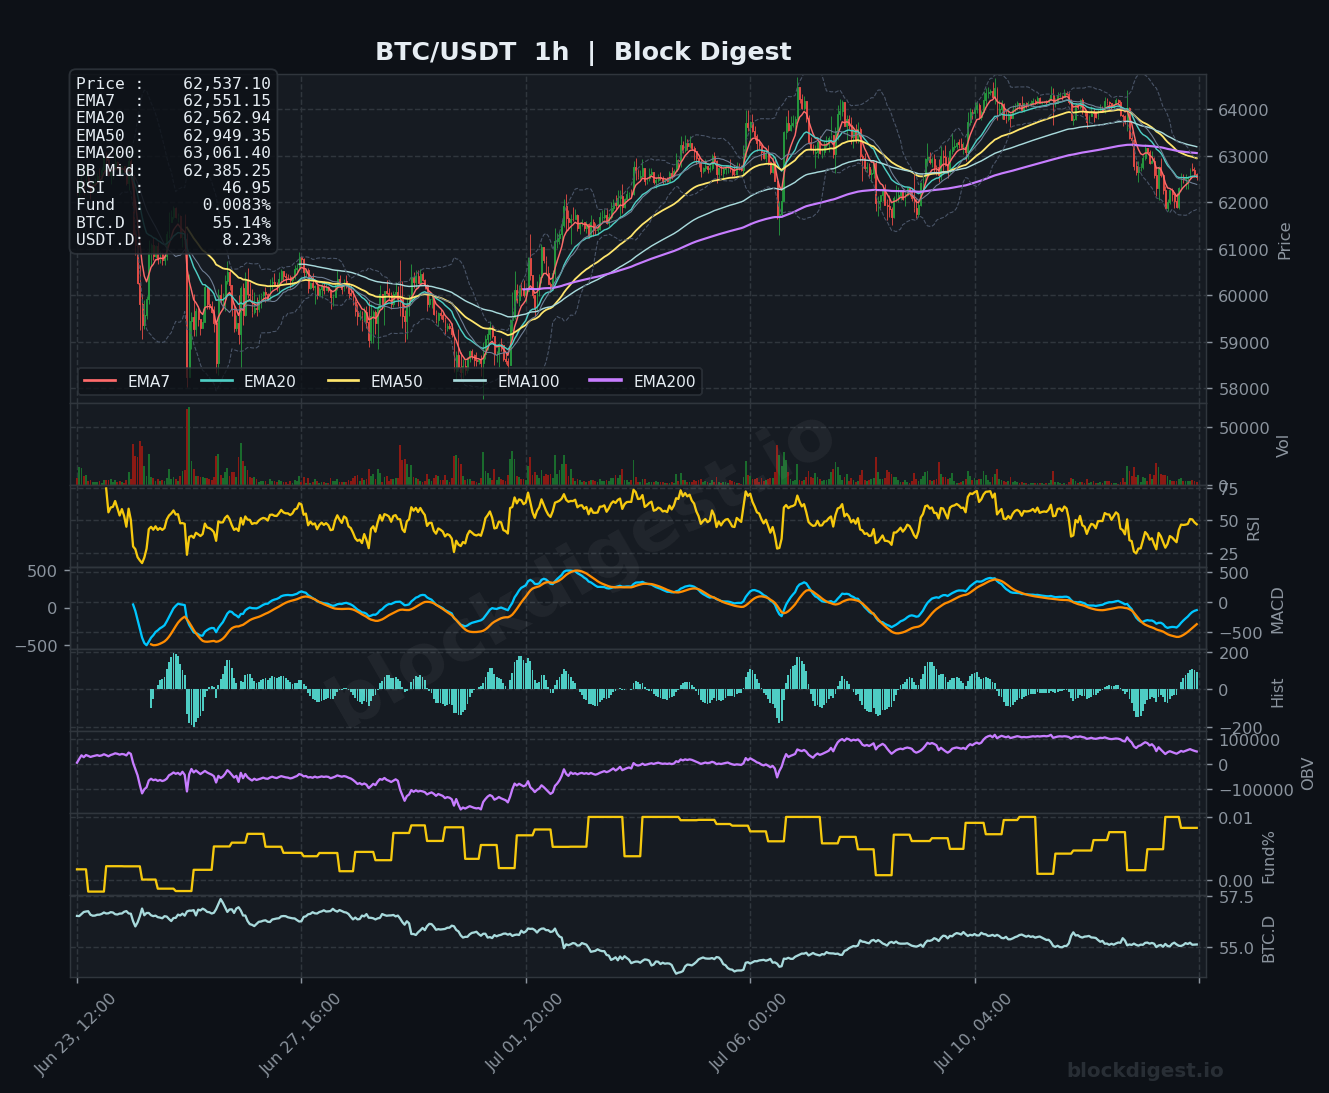
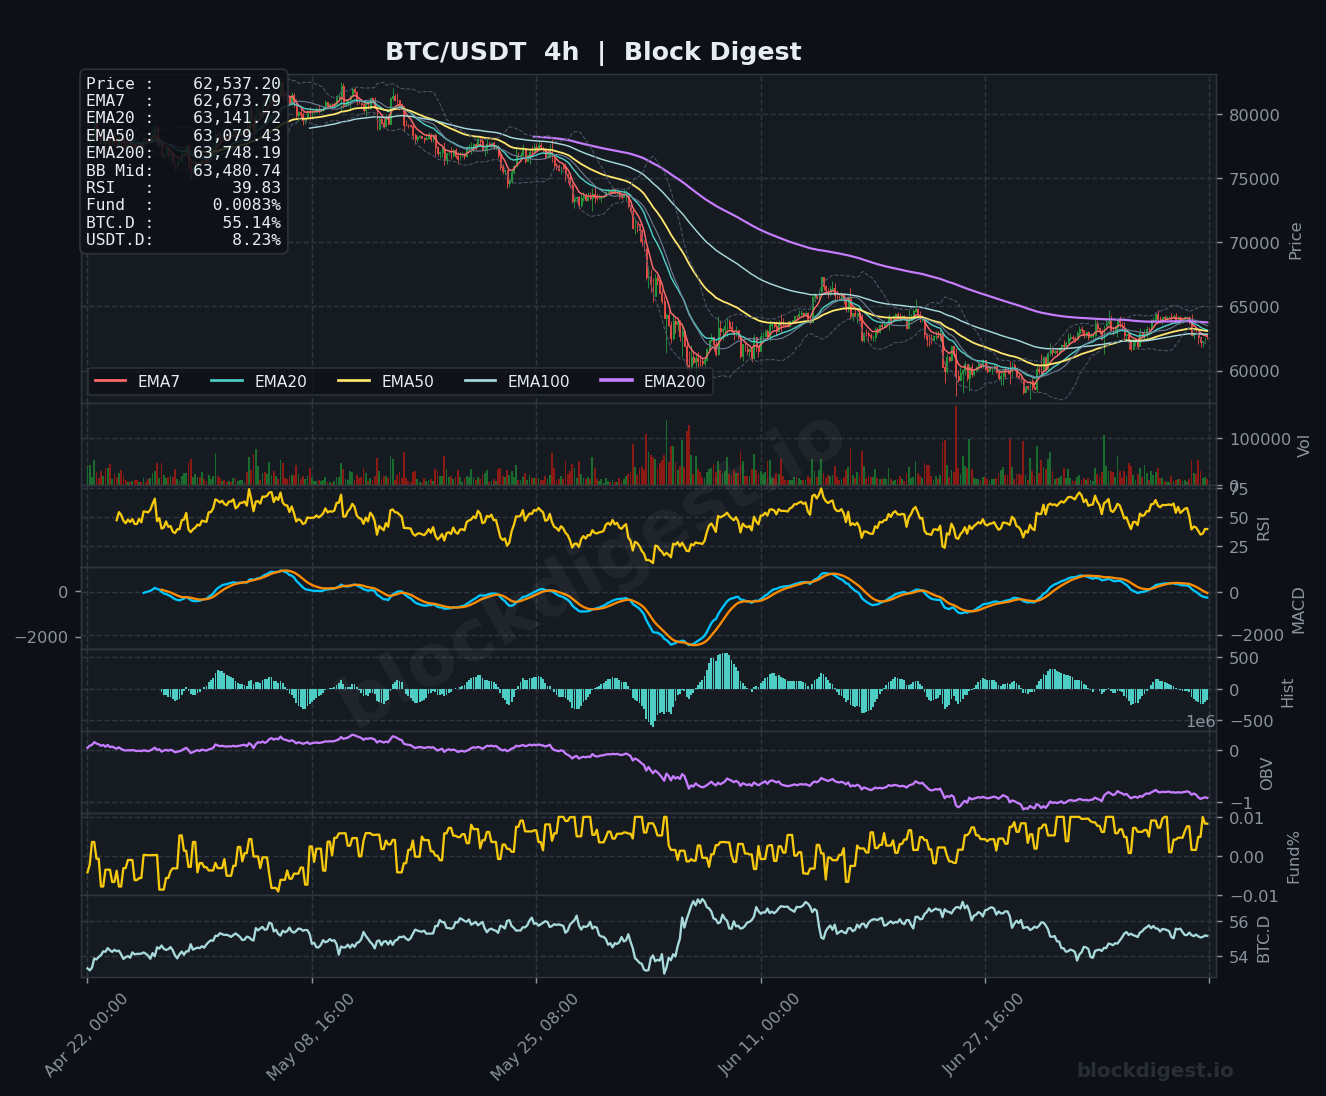
Across all three timeframes, the EMA stack is uniformly bearish — price is trading below the EMA7, EMA20, EMA50, and EMA200 on both the 4h and daily charts, which is a strong confluence of overhead supply. On the 1h chart, price at $62,537 is fractionally below the EMA7 ($62,551) and EMA20 ($62,562), suggesting very short-term indecision rather than momentum recovery. The 4h RSI at 39.83 is notably weaker than the 1h RSI at 46.95 and the daily RSI at 46.90, indicating that intermediate-term selling pressure remains elevated, and any hourly bounce faces meaningful headwinds from the 4h structure. There is strong EMA resistance confluence between $62,863 and $63,748 on the daily chart, which aligns closely with the 4h EMA cluster around $63,079–$63,748.
Key Levels to Watch
- Resistance: $63,079–$63,141 — the 4h EMA50/EMA20 cluster forming immediate dynamic resistance; a clean rejection here would reinforce the bearish bias
- Resistance: $63,748–$63,061 — confluence of the daily EMA200 and 4h EMA200, representing a major supply zone where significant selling pressure is expected
- Resistance: $65,040 — the daily EMA50, which has been acting as hard resistance throughout the 2026 downtrend and aligns with prior distribution structures
- Support: $61,919 — the daily Bollinger Band midline; a decisive close below this level would open the door to the lower Bollinger Band
- Support: $60,000–$60,500 — psychological round number and recent structural low zone; the area where BTC found footing after the June sell-off
- Support: $58,000 — widely cited macro support by analysts; a break here would signal a deeper correction with limited technical support until mid-$50,000s
Momentum & On-Chain Signals
The 4h MACD is particularly concerning, with both lines hovering just below zero and the histogram printing shallow negative bars — suggesting bears retain control on the intermediate timeframe with no confirmed reversal signal yet. The daily MACD shows the lines converging near zero after an extended bearish phase, which could be interpreted as early-stage momentum exhaustion rather than a bullish crossover. The OBV on the 4h chart has been declining steadily since the macro peak, reflecting persistent distribution, though the 1h OBV has shown modest improvement recently, hinting at localized accumulation. The funding rate at 0.0083% is mildly positive but near neutral, meaning the market is not overleveraged to the upside and speculative froth is not a near-term concern.
BTC Dominance & Market Sentiment
BTC dominance is currently at 55.14%, a level that reflects continued flight-to-quality within the crypto space as altcoins underperform. USDT dominance at 8.23% remains elevated, indicating that a meaningful portion of market participants continue to hold stablecoins on the sidelines rather than deploying capital — a sign of risk-off positioning that typically precedes either a sharp capitulation or a catalyst-driven re-entry. Until USDT.D begins to decline noticeably, sustained altcoin-led rallies remain unlikely, and BTC’s own recovery potential is constrained by macro caution.
Risk Scenarios
- Bullish case: A sustained hourly close above $63,141 with increasing volume and a 4h MACD bullish crossover would signal short-term trend reversal; a confirmed hold above $63,748 (4h/daily EMA200 confluence) could target $65,040–$65,600 in the near term.
- Bearish case: A failure to hold $61,919 (daily BB midline) on a closing basis, combined with renewed 4h MACD deterioration, would likely accelerate selling toward the $60,000 psychological zone and potentially retest the $58,000 macro support.
Outlook
The short-term setup is cautiously neutral-to-bearish, with BTC caught in a tight compression zone between $61,919 and the dense EMA resistance cluster between $62,863 and $63,748. The next 24–48 hours are critical — macro catalysts such as Fed commentary or ETF flow data could be the deciding factor in whether BTC breaks above or below this range. The thesis shifts bullish only on a clean reclaim of the daily EMA7 and EMA20 with conviction, while a daily close below $61,500 would warrant defensive positioning. Overall, the structure remains fragile, and traders should monitor the $63,100 resistance and $61,900 support as the key near-term pivots.
Disclaimer: This analysis is for informational purposes only and does not constitute financial advice. Cryptocurrency markets are highly volatile and unpredictable. All trading decisions should be made based on your own research and risk tolerance. Block Digest is not responsible for any financial losses incurred as a result of acting on this content.