
Market Overview
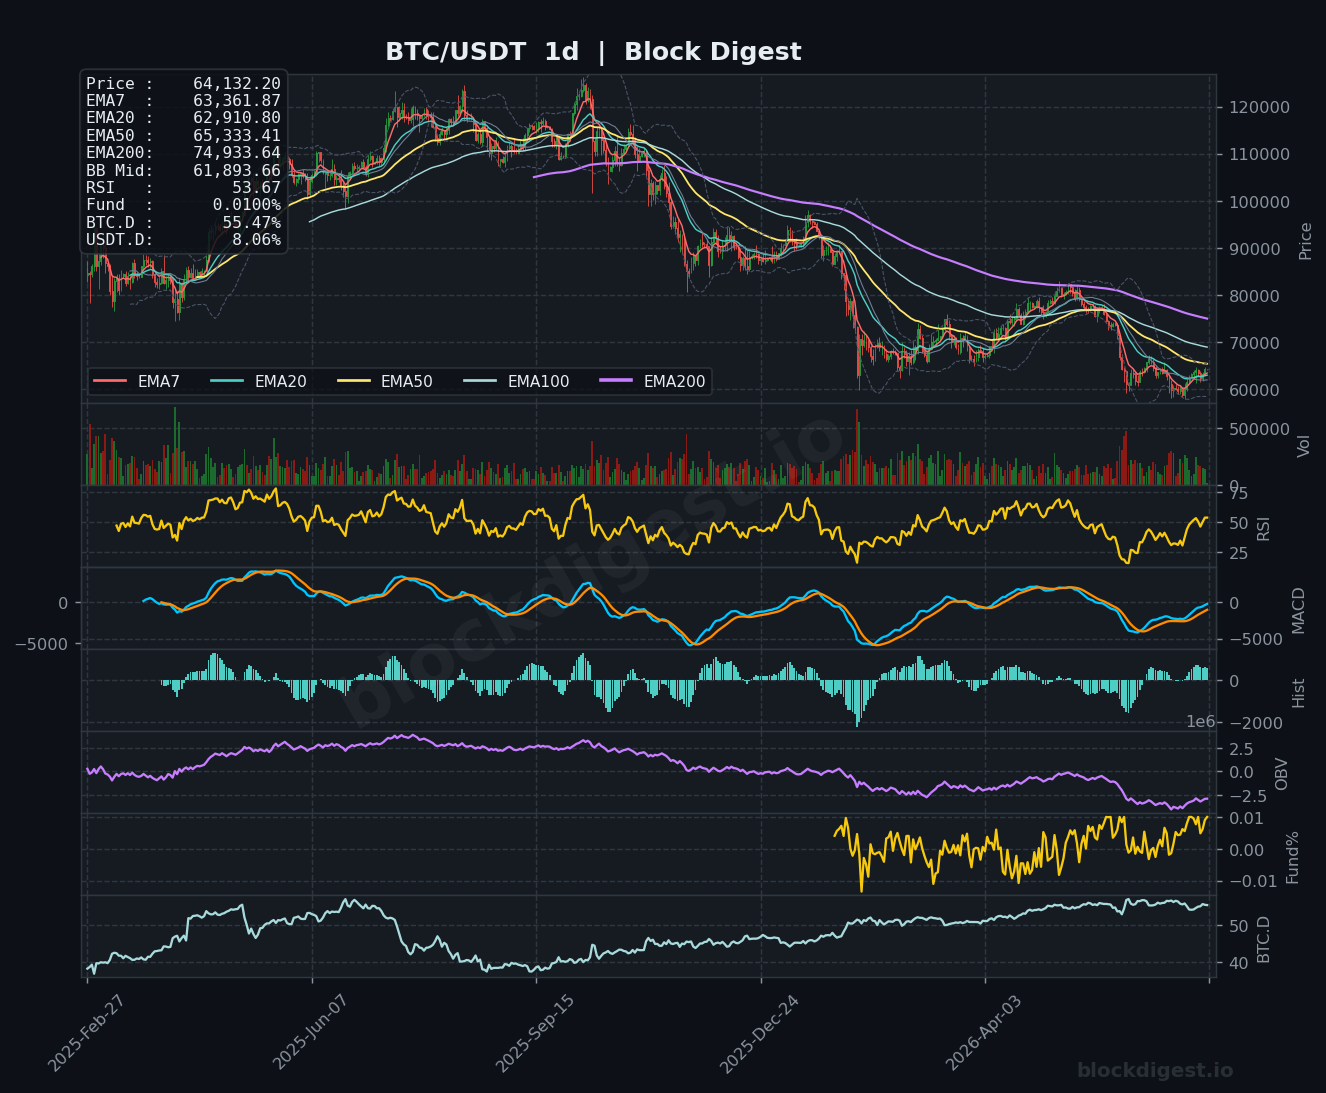
Bitcoin is currently trading at $64,132–$64,153, sitting in a notable zone of technical tension following a significant multi-month decline from all-time highs near $108,000–$123,000 recorded earlier this cycle. On the daily timeframe, price remains below the EMA50 ($65,333) and well beneath the EMA200 ($74,933), confirming the dominant structure is still a macro downtrend despite the recent recovery attempt. Price is trading above the Bollinger Band midline ($61,893) on the daily, which offers a modestly constructive near-term signal, though the broader bear structure remains intact. The 24-hour gain of approximately 0.97% and 7-day gain of 2.50% reflect a cautious stabilization rather than a decisive trend reversal.
Multi-Timeframe Confluence
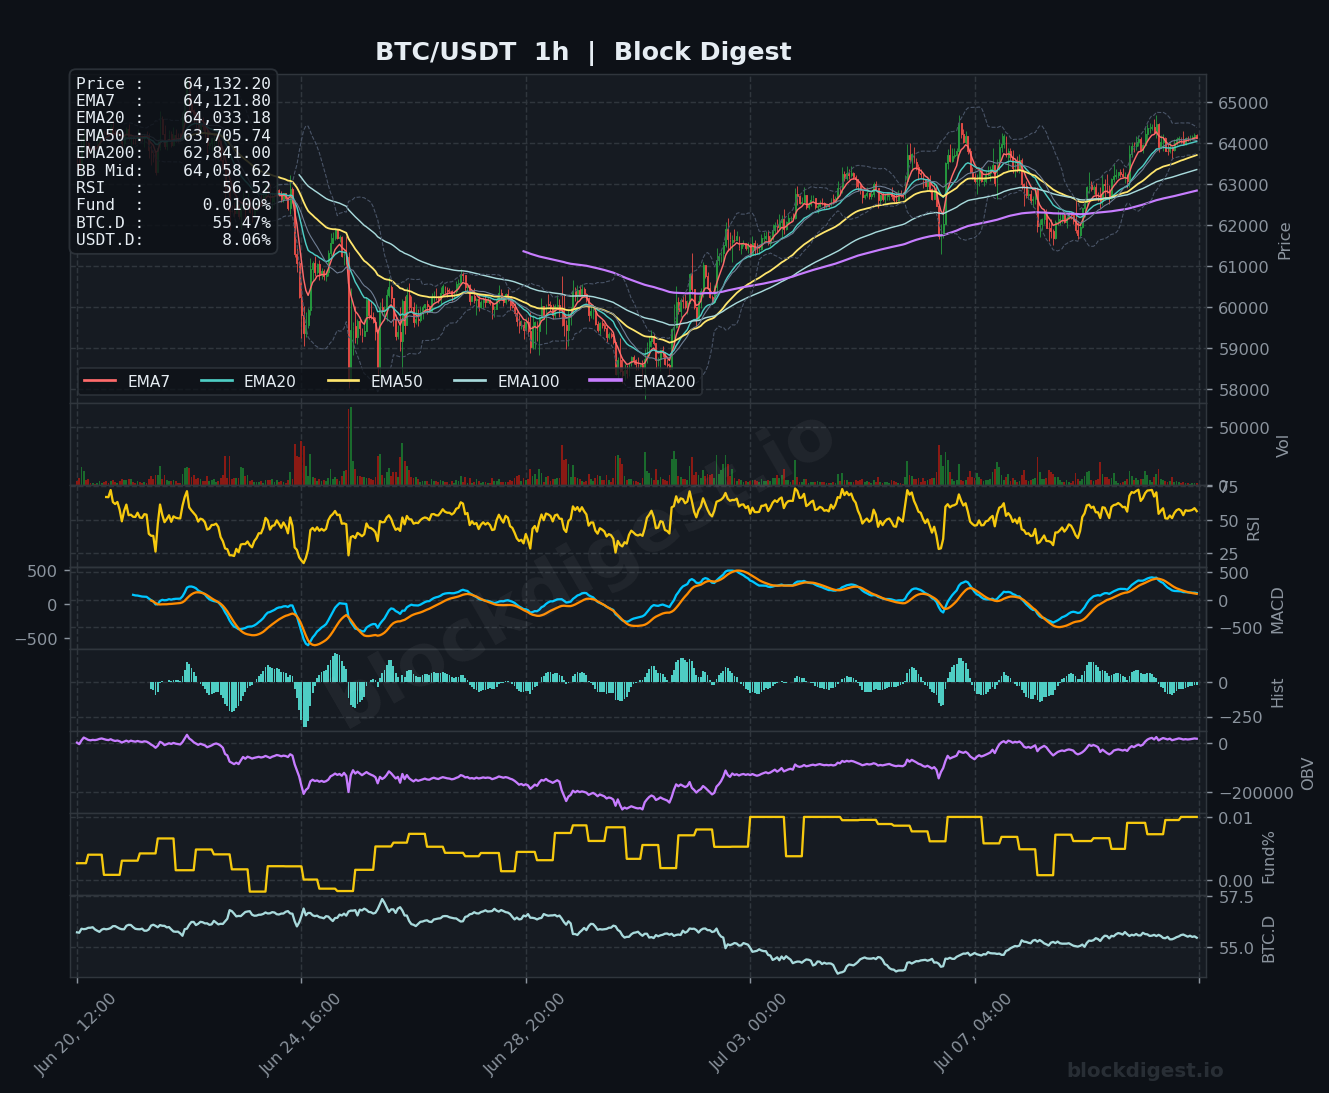
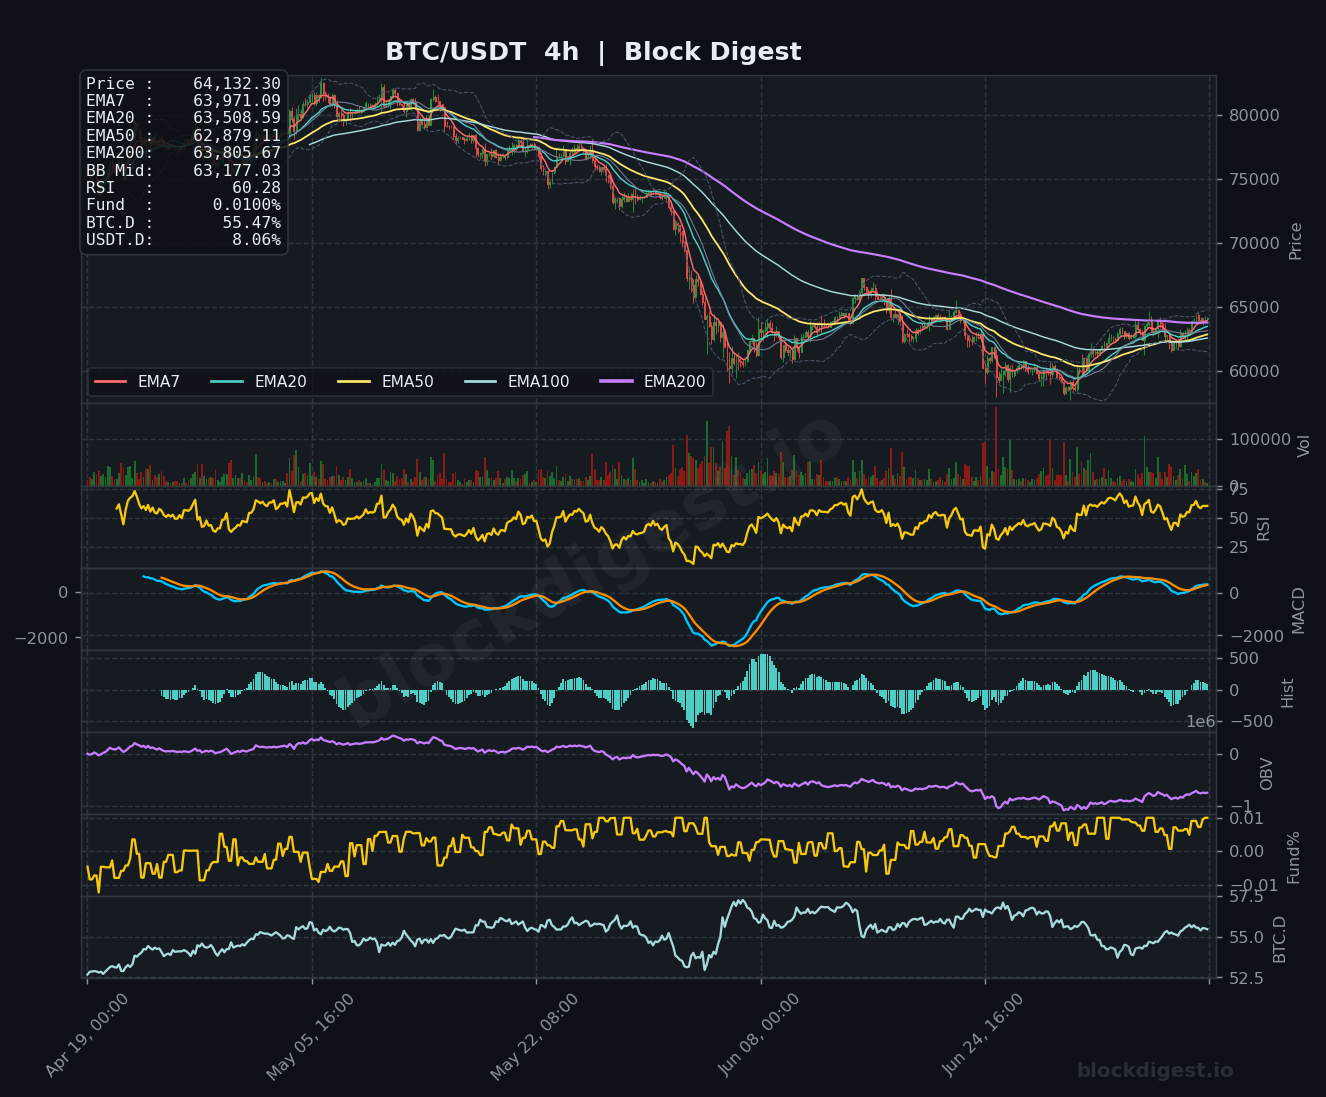
On the 1-hour chart, price is trading above all short-term EMAs — EMA7 ($64,121), EMA20 ($64,033), EMA50 ($63,705), and EMA200 ($62,841) — in a bullish stack that indicates healthy short-term momentum. The 4-hour chart echoes this with price above EMA7 ($63,971), EMA20 ($63,508), and EMA50 ($62,879), though the EMA200 on this timeframe sits at $63,805, meaning price is just marginally reclaiming that key level — a constructive development. However, the daily chart tells a more cautious story: price remains sandwiched between the EMA20 ($62,910) below and EMA50 ($65,333) above, with the latter acting as a key overhead resistance cluster that must be cleared to shift the daily bias more convincingly bullish. Short-term momentum supports a continuation of the bounce, but the higher timeframe trend still requires significant work before a full structural reversal can be confirmed.
Key Levels to Watch
- Resistance: $65,333 — Daily EMA50, the most immediate overhead obstacle and a likely zone of seller concentration given its proximity to current price; $67,000–$68,000 — a prior consolidation zone and likely area of supply from the prior downtrend; $74,933 — Daily EMA200, the defining level for macro trend recovery.
- Support: $63,705–$63,805 — Confluence of the 1-hour EMA50 and 4-hour EMA200, a critical near-term floor on any pullback; $62,841–$62,910 — 1-hour EMA200 and daily EMA20 cluster, representing stronger structural support; $61,893 — Daily Bollinger Band midline, last line of defense before the broader recovery thesis comes under pressure.
Momentum & On-Chain Signals
The RSI across timeframes is constructive but not stretched: 56.52 on the 1-hour, 60.28 on the 4-hour, and 53.67 on the daily — all reading in neutral-to-mildly bullish territory with room to extend higher before reaching overbought conditions. The 4-hour MACD is showing a bullish crossover in progress with the histogram returning to positive territory, supporting the short-term recovery narrative. OBV on the daily, however, remains in a declining trend, suggesting that cumulative buying pressure has not yet reversed meaningfully — this is a notable divergence between short-term price recovery and longer-term volume-based accumulation signals. Funding rates across all timeframes are sitting at a modest +0.01%, indicating a slight bullish lean in perpetual markets without excessive leverage buildup, which reduces immediate liquidation cascade risk.
BTC Dominance & Market Sentiment
BTC Dominance (BTC.D) stands at 55.47%, a level that reflects Bitcoin’s continued hold on market share but one that has been trending lower on the daily chart, potentially signaling early capital rotation toward altcoins. USDT.D at 8.06% remains relatively elevated, suggesting a meaningful portion of market participants are still sitting in stablecoins — this represents latent buying power but also reflects ongoing caution and risk-off positioning. For BTC specifically, the combination of moderate dominance and elevated stablecoin reserves implies the market is in a “wait and see” mode rather than a confident risk-on accumulation phase.
Risk Scenarios
- Bullish case: A confirmed daily close above the EMA50 at $65,333, accompanied by expanding volume and a rising OBV, would open the path toward the $67,000–$68,000 supply zone and eventually challenge the EMA200 at $74,933 as a medium-term target.
- Bearish case: A rejection at the EMA50 and a breakdown below the $62,841–$62,910 support cluster would signal the recovery is failing, with downside targets toward $59,000 and potentially a retest of the recent cycle lows near $58,000–$59,000.
Outlook
The near-term technical picture is cautiously constructive: Bitcoin has reclaimed all short-term EMAs on the 1-hour and 4-hour timeframes and is approaching the critical daily EMA50 resistance at $65,333, which will be the defining test in the next 24–48 hours. A clean breakout above $65,333 on the daily with supportive volume would meaningfully shift the bias and could catalyze a more sustained recovery leg, particularly given the broader regulatory tailwinds referenced in recent news. However, the persistent macro downtrend on the daily, declining OBV, and elevated USDT dominance argue against becoming overly aggressive on the long side until that level is definitively cleared. The bias tilts modestly bullish short-term, but confirmation is needed — traders should monitor the $65,333 resistance and the $62,841 support as the key levels that will define the next directional move.
Disclaimer: This analysis is for informational purposes only and does not constitute financial advice. Cryptocurrency markets are highly volatile and unpredictable. All trading decisions should be made based on your own research and risk tolerance. Block Digest is not responsible for any financial losses incurred as a result of acting on this content.
Stay Ahead of the Market
Follow BlockDigest for crypto market intelligence, research and real-time updates.


