
Market Overview
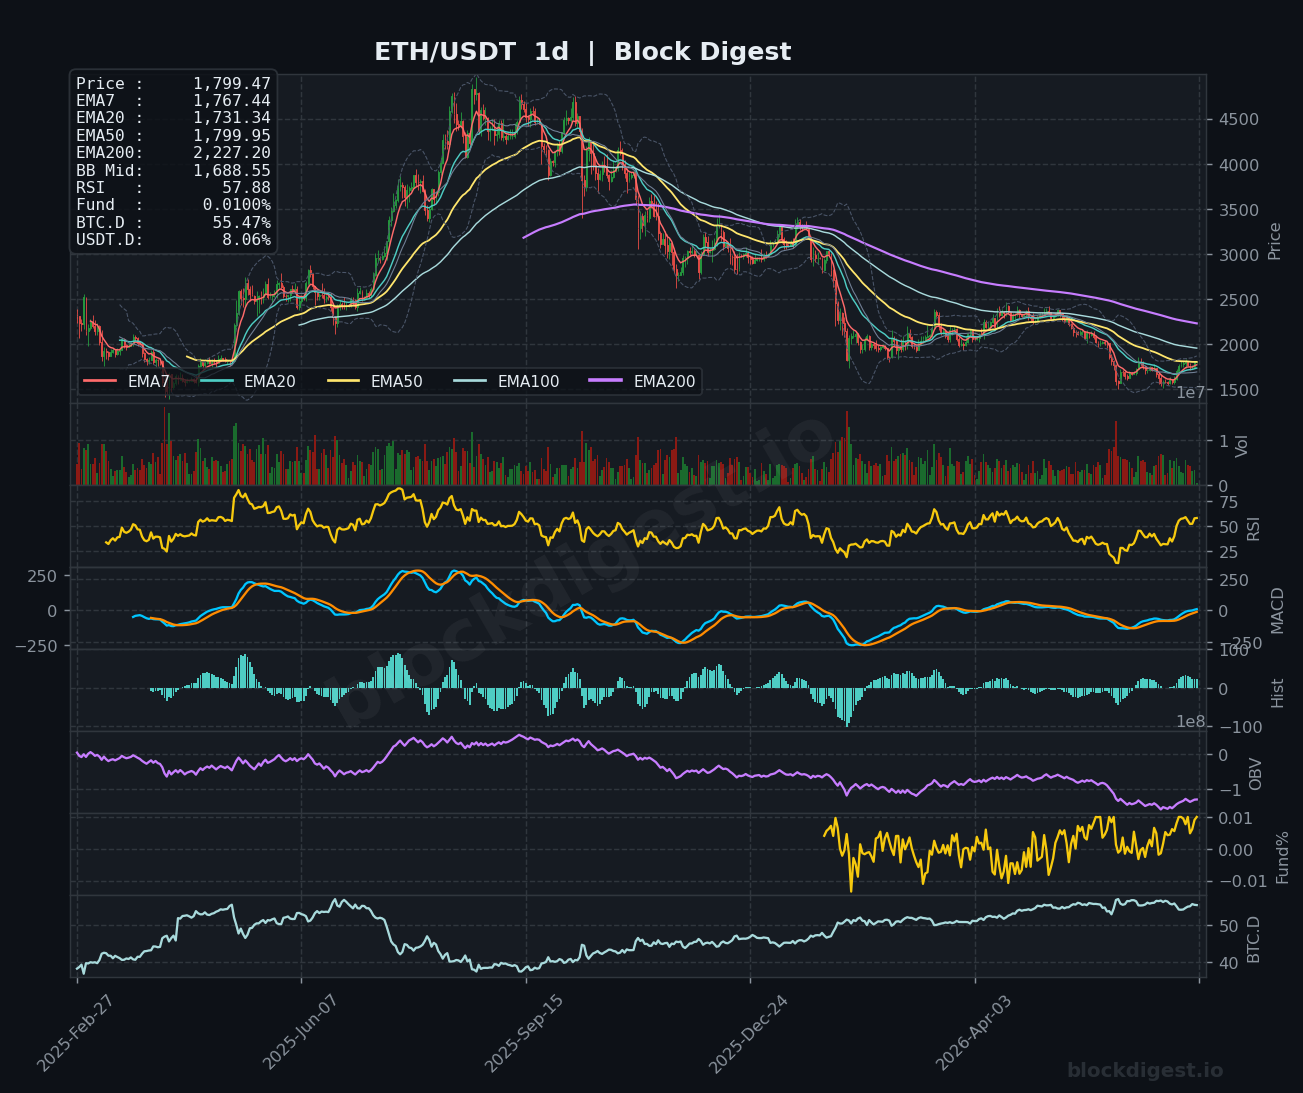
Ethereum is trading at approximately $1,794–$1,799 as of July 11, 2026, posting a modest 2.85% gain over the past 24 hours in line with broader crypto market recovery. On the daily timeframe, price is testing the EMA50 ($1,799.95) — a level that has acted as dynamic resistance throughout the recent corrective phase — while remaining well below the descending EMA200 ($2,227.20), which continues to define the dominant macro bearish structure. The Bollinger Band midline on the daily sits at $1,688.55, meaning price has pushed meaningfully above it, suggesting short-term bullish momentum is building even within the broader downtrend. Despite today’s strength, ETH remains in a structurally challenged position, trading more than 20% below its EMA200 on the daily chart.
Multi-Timeframe Confluence
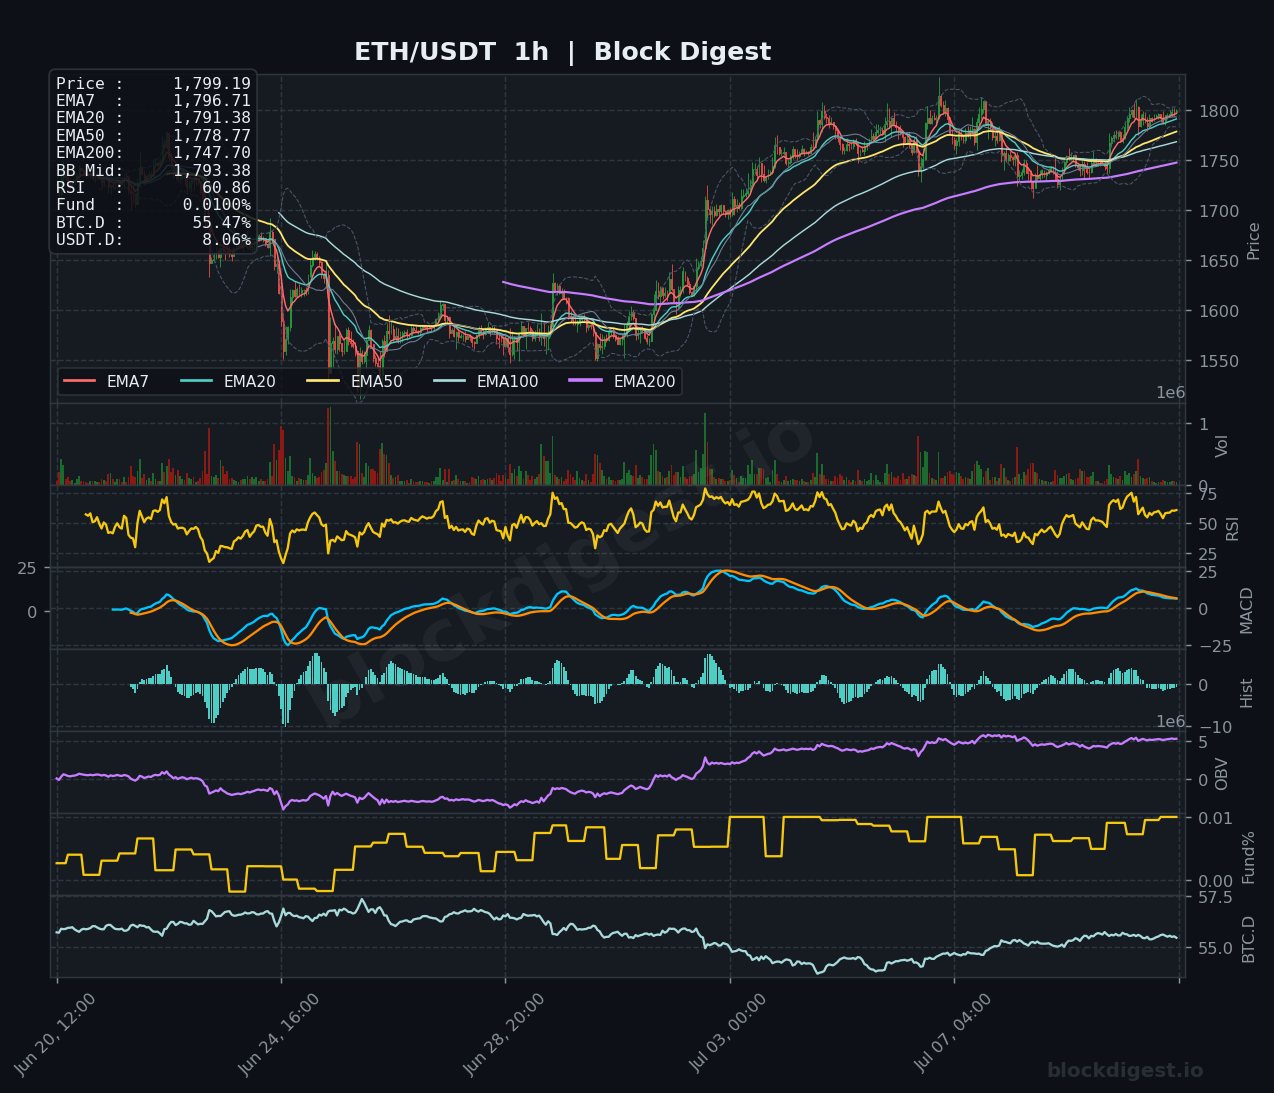
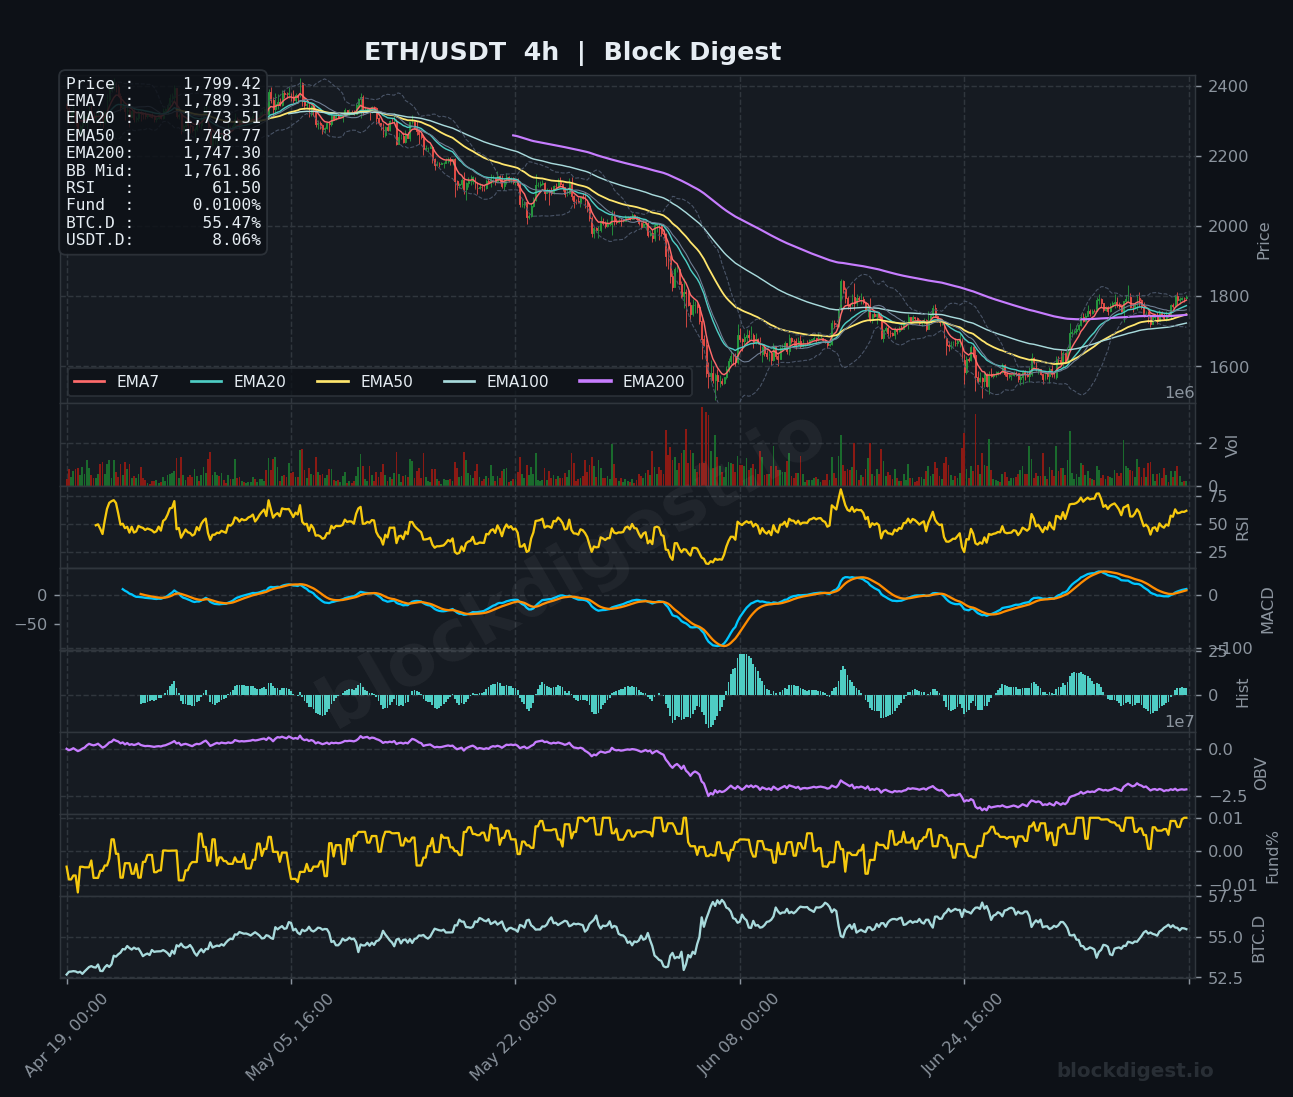
On the 1-hour chart, price is trading cleanly above all short-term EMAs — EMA7 ($1,796.71), EMA20 ($1,791.38), and EMA50 ($1,778.77) — with the EMA200 at $1,747.70 acting as a rising foundation, reflecting the recovery momentum that has developed over recent weeks. The 4-hour chart tells a similar story: price has reclaimed EMA7 ($1,789.31) and EMA20 ($1,773.51), and is pushing above the Bollinger Band midline at $1,761.86, signaling a transition from distribution to tentative accumulation territory. However, the higher timeframes are less encouraging — the daily EMA50 at $1,800 represents a critical inflection point that price must convincingly close above to shift the medium-term bias. Short-term momentum broadly supports the higher timeframe recovery attempt, but confirmation remains absent on the daily close.
Key Levels to Watch
- Resistance: $1,800–$1,805 — the daily EMA50 cluster and psychological round number, the most immediately critical overhead barrier for trend confirmation
- Resistance: $1,850–$1,870 — a prior consolidation zone visible on the 4-hour chart that capped recovery attempts in late June, likely to attract significant sell-side pressure
- Resistance: $2,000 — a major psychological and structural level, aligned with previous support-turned-resistance and where the EMA100 on the daily converges
- Support: $1,747–$1,750 — confluence of the 1-hour EMA200 ($1,747.70) and the 4-hour EMA200 ($1,747.30), a critical demand zone that should hold in any shallow pullback
- Support: $1,688–$1,700 — the daily Bollinger Band midline at $1,688.55 and a prior consolidation range that provided a base during the recent geopolitical-driven selloff
- Support: $1,560–$1,580 — the macro swing low region established during the most aggressive leg of the downtrend, representing the final support before a retest of multi-year lows
Momentum & On-Chain Signals
RSI across timeframes is constructive but not yet extended: the 1-hour RSI sits at 60.86, the 4-hour at 61.50, and the daily at 57.88 — all in bullish territory without approaching overbought conditions, leaving room for further upside before a natural exhaustion point. The MACD on the 1-hour is positive with a modest histogram, while the 4-hour MACD lines are converging back toward the zero line from below, reflecting recovery but not yet a confirmed bullish cross. On the daily, the MACD remains in negative territory but the histogram is shrinking and the signal line appears to be flattening — a potential early-stage bullish crossover setup that traders should monitor closely. OBV on the 1-hour is trending upward, consistent with ongoing accumulation, though the 4-hour OBV remains depressed relative to earlier cycle highs, indicating that institutional participation has not fully returned.
BTC Dominance & Market Sentiment
BTC dominance stands at 55.47%, having pulled back from recent highs above 57%, which is a tentatively positive signal for altcoins including ETH — capital rotation into the broader market tends to accelerate when BTC.D rolls over from elevated levels. USDT dominance at 8.06% remains elevated, however, indicating that a significant proportion of capital is still parked in stablecoins, reflecting the cautious sentiment confirmed by the Fear & Greed Index reading of 23 (Extreme Fear). For ETH specifically, a sustained decline in both BTC.D and USDT.D would be a constructive precondition for a more meaningful recovery leg beyond the $1,800 resistance.
Risk Scenarios
- Bullish case: A daily close above $1,805 — effectively reclaiming the EMA50 — would represent a meaningful structural shift, opening a path toward $1,850–$1,870 and ultimately $2,000 if momentum sustains and broader market sentiment continues to recover alongside easing geopolitical tensions.
- Bearish case: Failure to hold the $1,747–$1,750 EMA200 confluence on a retest would signal that the recovery is a dead-cat bounce within the larger downtrend, targeting a move back toward $1,688 and potentially $1,580 on any renewed risk-off catalyst.
Outlook
ETH is at a pivotal decision point on July 11, 2026, testing the daily EMA50 at $1,799.95 — a level that will largely determine whether the recent recovery has legs or fades back into the broader bearish structure. The short-term momentum across the 1-hour and 4-hour timeframes is constructive, with price above key EMAs and RSI readings in the low-to-mid 60s suggesting room to run without immediate overbought risk. The key trigger to watch over the next 24–48 hours is a confirmed daily close above $1,805; failure here would keep ETH structurally bearish, while a clean break would invite fresh momentum buying. Given the still-elevated USDT dominance, extreme fear sentiment, and macro uncertainty stemming from Middle East developments, a cautiously bullish bias is appropriate — but position sizing and risk management remain paramount until higher timeframe trend structure improves more definitively.
Disclaimer: This analysis is for informational purposes only and does not constitute financial advice. Cryptocurrency markets are highly volatile and unpredictable. All trading decisions should be made based on your own research and risk tolerance. Block Digest is not responsible for any financial losses incurred as a result of acting on this content.
Stay Ahead of the Market
Follow BlockDigest for crypto market intelligence, research and real-time updates.


