Bitcoin Daily Analysis: Bitcoin holds $64.6K above Bollinger midlines
Market Overview
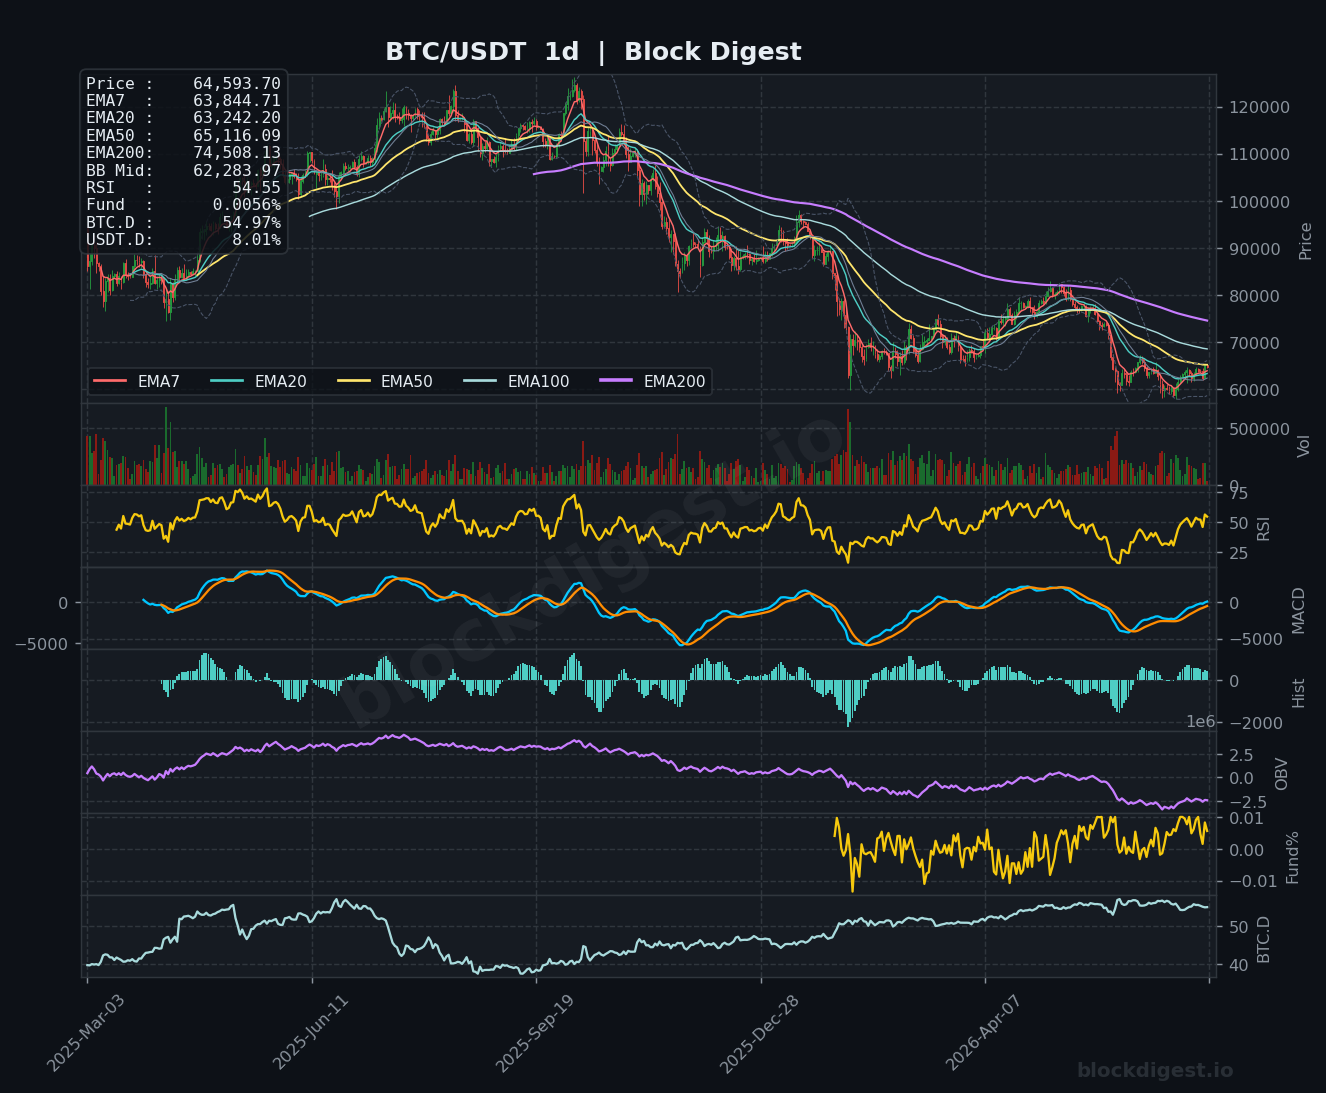
Bitcoin is trading around $64,594 on July 15, 2026, sitting above the Bollinger Band midline on the 1-hour chart ($64,593) and just above the 4-hour BB midline ($63,572), suggesting short-term bullish positioning. On the daily timeframe, price remains below the EMA50 ($65,116) — a critical resistance level that has capped multiple recovery attempts — while trading above the EMA7 ($63,845) and EMA20 ($63,242), indicating tentative near-term strength. The broader daily structure remains a prolonged downtrend from prior highs above $100,000, with price having spent approximately a month consolidating between $59,000 and $66,000. The daily EMA200 ($74,508) sits far overhead, underscoring how significant the macro bearish structure remains.
Multi-Timeframe Confluence
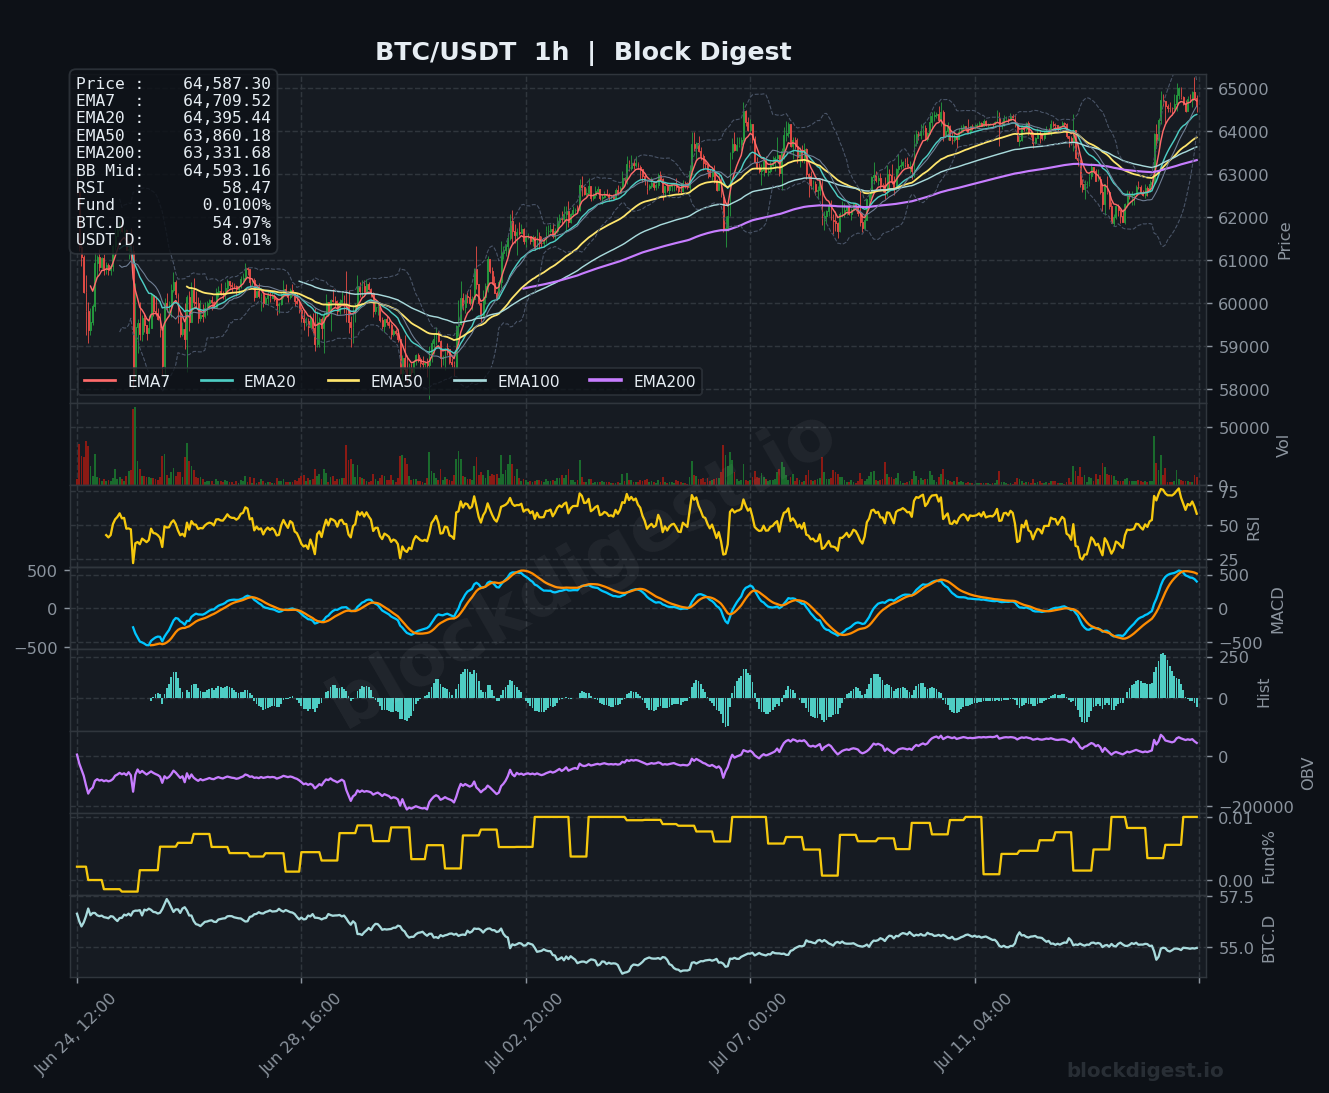
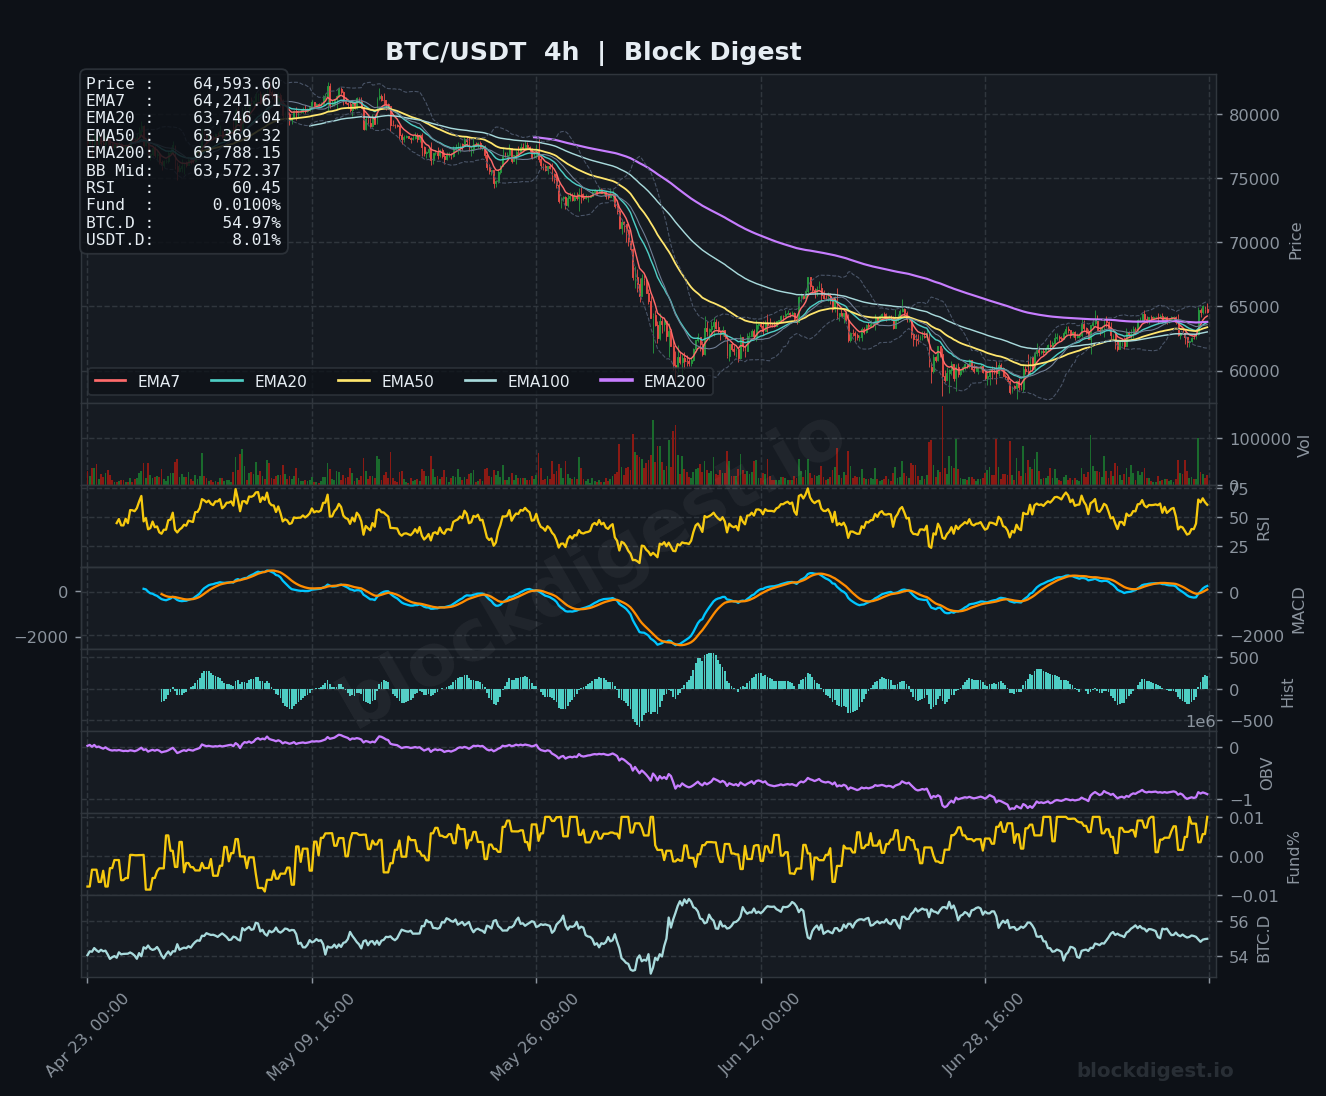
On the 1-hour chart, all short-term EMAs (EMA7 at $64,710, EMA20 at $64,395, EMA50 at $63,860) are stacked bullishly beneath price, confirming the intraday uptrend following the recovery from Monday’s geopolitical-driven sell-off. The 4-hour chart shows a similar alignment, with EMA7 ($64,242), EMA20 ($63,746), and EMA50 ($63,369) all beneath current price, though notably all four shorter EMAs are converging tightly near the $63,400–$64,000 zone, which represents a critical support cluster. However, the daily timeframe introduces a meaningful headwind: price is approaching but has yet to convincingly reclaim the daily EMA50 at $65,116, which has acted as resistance on prior bounces. Short-term momentum is constructive, but it operates against a higher-timeframe structure that remains structurally bearish.
Key Levels to Watch
- Resistance: $65,116 — Daily EMA50, the most significant near-term barrier and a level that has rejected price on multiple recovery attempts; $65,000–$65,500 — psychological round number and upper Bollinger Band convergence zone on the 4-hour chart; $66,000 — top of the month-long consolidation range and a level where sellers have consistently defended.
- Support: $63,746–$63,860 — 4-hour EMA20 and 1-hour EMA50 confluence zone, the first meaningful demand area on a pullback; $63,242–$63,369 — daily EMA20 and 4-hour EMA50 cluster, a stronger structural support; $61,000–$59,000 — the lower boundary of the multi-week consolidation range where buyers have previously stepped in.
Momentum & On-Chain Signals
The 1-hour RSI at 58.47 and the 4-hour RSI at 60.45 both sit in mildly bullish territory without approaching overbought conditions, leaving room for continued upside before a meaningful exhaustion signal. The daily RSI at 54.55 is recovering from oversold territory but remains below the 60 level that would confirm a genuine trend reversal. On the 4-hour MACD, the signal and MACD lines are converging near zero with a marginally positive histogram, suggesting a bullish crossover may be forming but lacks conviction. The OBV on both the 1-hour and 4-hour charts shows a gradual upward trend in recent sessions, indicative of mild accumulation, though the daily OBV remains in a longer-term downtrend — a notable divergence that warrants caution. Funding rates across all timeframes are at a near-neutral 0.01%, implying the market is not overleveraged in either direction.
BTC Dominance & Market Sentiment
BTC.D stands at 54.97%, a relatively elevated reading that reflects continued capital concentration in Bitcoin rather than rotation into altcoins, consistent with a risk-off environment in the broader crypto market. USDT.D at 8.01% remains elevated, signaling that a meaningful proportion of market participants are still holding stablecoins on the sidelines — which could either represent future buying power or persistent caution. The Fear and Greed Index at 36/100 (Fear) aligns with the on-chain picture: sentiment is subdued, ETF volumes have collapsed 78% from peak, and there is no strong evidence of euphoric retail re-engagement.
Risk Scenarios
- Bullish case: A decisive 4-hour close above the daily EMA50 at $65,116, accompanied by rising OBV and RSI crossing above 65 on the daily, would open a path toward the $66,000 range highs and potentially $68,000–$70,000 on continuation. Renewed ETF volume expansion would further validate the breakout.
- Bearish case: Failure to hold the $63,400–$63,860 EMA confluence support on a retest, particularly if accompanied by negative funding rates and a break below $63,000, would risk a re-test of the $61,000–$59,000 range lows with the macro downtrend resuming.
Outlook
The near-term bias is cautiously bullish given the recovery from Monday’s sell-off, favorable short-term EMA alignment, and neutral funding rates — but conviction remains limited while price trades below the daily EMA50 at $65,116. The key trigger to watch in the next 24–48 hours is whether BTC can sustain above $64,500 and mount a genuine challenge of the $65,116 resistance; a failure here would likely result in a return to the $63,000–$63,500 support cluster. The overall setup reflects a market in consolidation rather than trend resumption, with macro headwinds from geopolitical uncertainty and declining ETF volumes providing a ceiling on upside enthusiasm. Traders should treat the $59,000–$66,000 range as the operative field until a structural breakout or breakdown materializes.
Disclaimer: This analysis is for informational purposes only and does not constitute financial advice. Cryptocurrency markets are highly volatile and unpredictable. All trading decisions should be made based on your own research and risk tolerance. Block Digest is not responsible for any financial losses incurred as a result of acting on this content.