
Market Overview
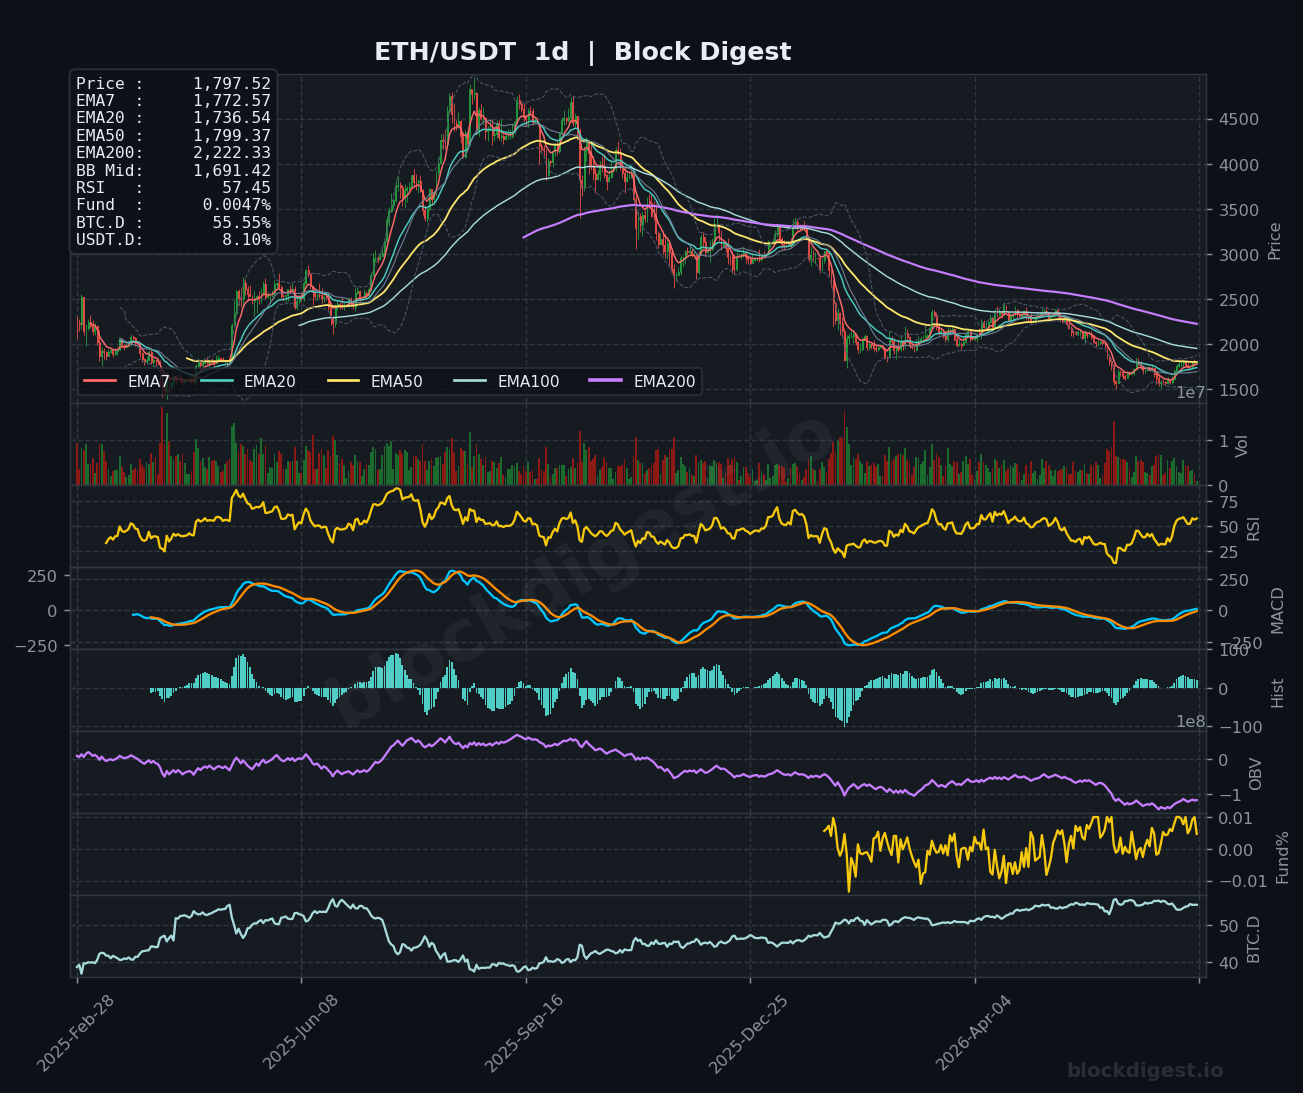
ETH/USDT is trading at $1,797.52 as of July 12, 2026, sitting in a technically nuanced zone where several short- and medium-term EMAs converge. On the daily timeframe, price has recently reclaimed the EMA7 ($1,772.57) and EMA20 ($1,736.54), and is now testing the daily EMA50 at $1,799.37 — a level that has historically acted as a meaningful inflection point. The daily Bollinger Band midline sits at $1,691.42, well below current price, suggesting ETH has moved meaningfully off its recent lows and is now testing the upper portion of its recovery range. However, the daily EMA200 at $2,222.33 looms as a formidable macro resistance overhead, underscoring that the dominant longer-term trend remains structurally bearish until proven otherwise.
Multi-Timeframe Confluence
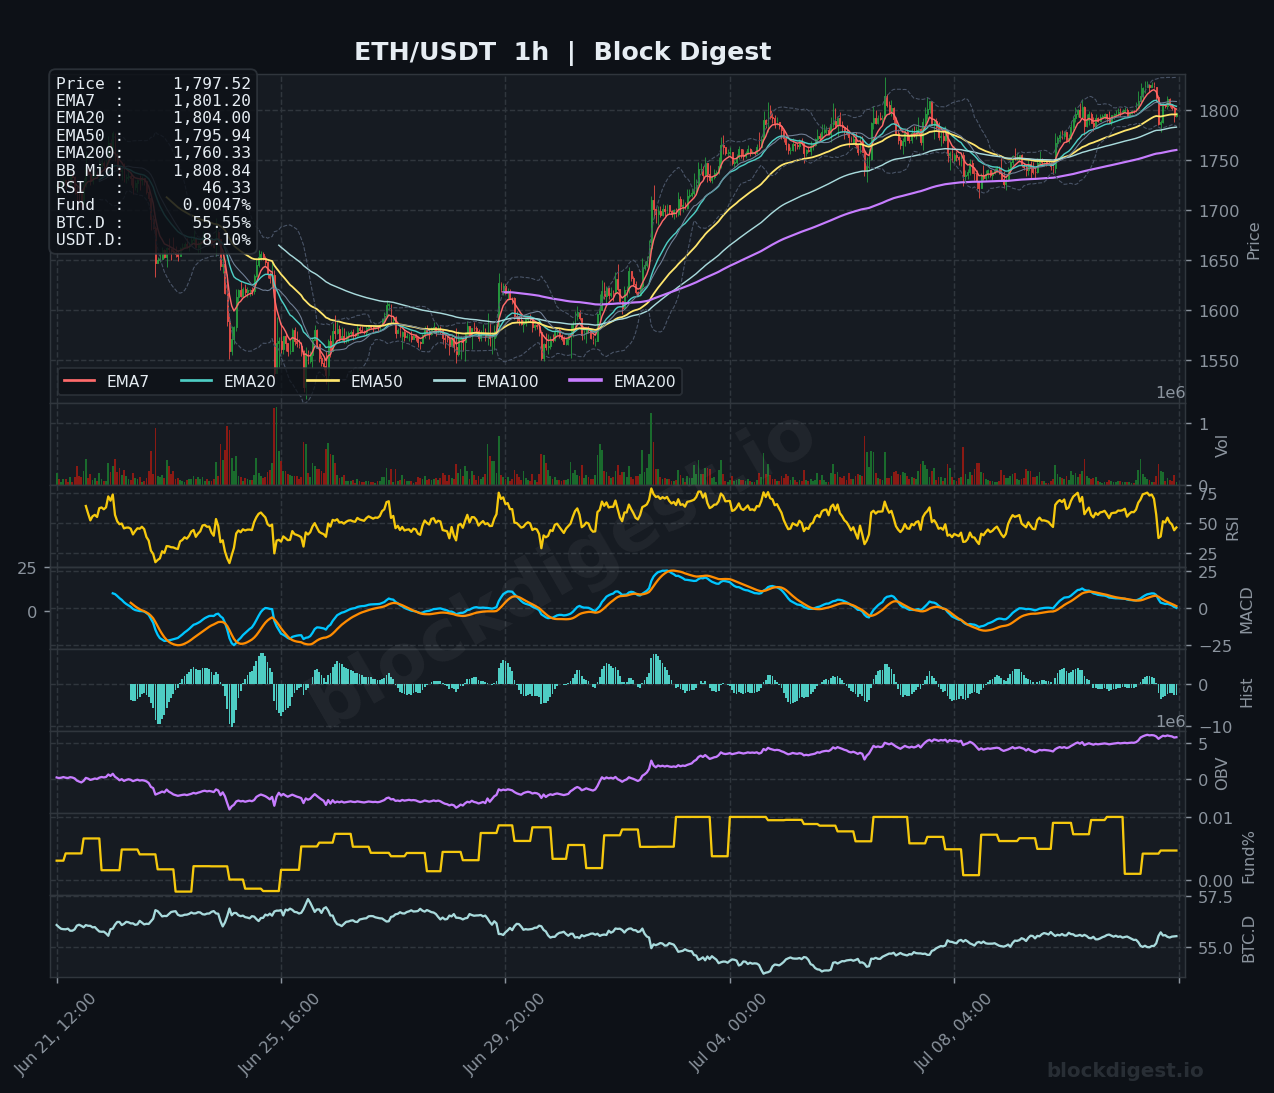
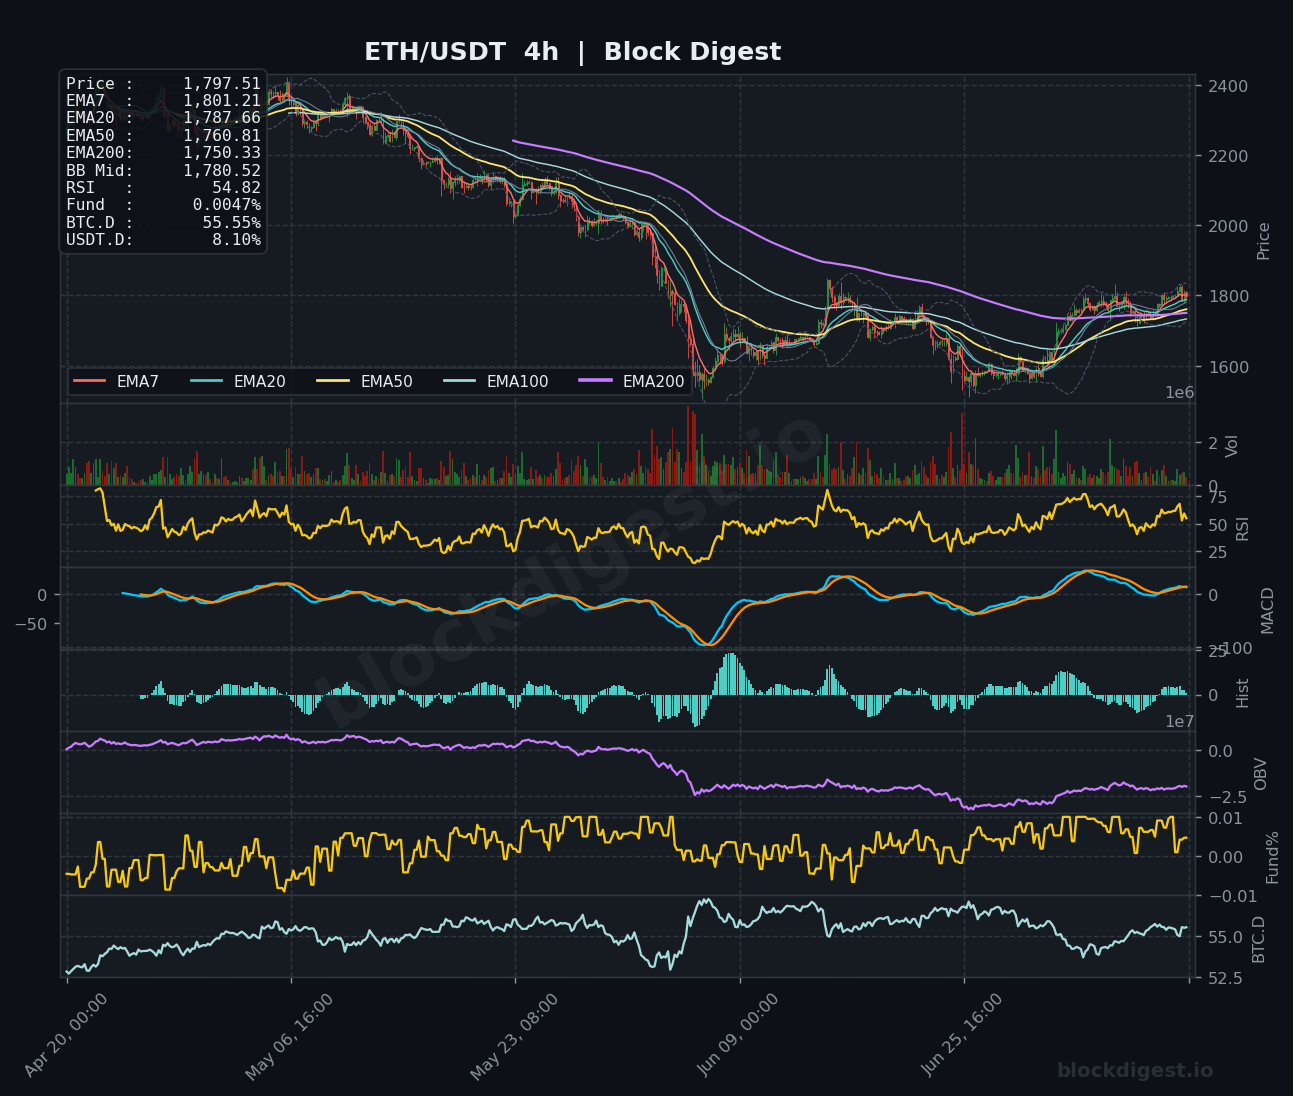
On the 1-hour chart, ETH trades just below the EMA7 ($1,801.20), EMA20 ($1,804.00), and the BB midline ($1,808.84), all clustered tightly between $1,800 and $1,810 — a zone acting as immediate resistance. The 4-hour chart shows a more constructive picture, with price having broken above both the EMA20 ($1,787.66) and EMA50 ($1,760.81), and the 4H BB midline ($1,780.52) now providing dynamic support below. Crucially, the 4-hour EMA200 ($1,750.33) has been reclaimed and is now tracking below price, reinforcing the near-term recovery thesis. Short-term momentum on the 1H is slightly hesitant — with price just below the cluster of near-term EMAs — but the 4H structure largely supports continued upward pressure, aligning with the broader daily recovery attempt.
Key Levels to Watch
- Resistance:
- $1,808–$1,810: Immediate confluence zone — 1H EMA20, EMA7, and BB midline all cluster here; a clean hourly close above this level would clear the near-term overhead.
- $1,850–$1,870: Prior consolidation ceiling visible on the 4H chart; rejection at this zone in early July defined the recent high-water mark and would be the next meaningful test on continuation.
- $2,222: Daily EMA200 — the macro resistance that has capped all rally attempts since the broader downtrend began; reclaiming this level would represent a structural trend change.
- Support:
- $1,760–$1,762: 4H EMA50 ($1,760.81) and 1H EMA200 ($1,760.33) align tightly here, making this a critical near-term demand zone on any pullback.
- $1,736: Daily EMA20 — a key dynamic support on the higher timeframe; losing this on a daily close would signal weakening recovery momentum.
- $1,691: Daily BB midline — a deeper retracement level that would indicate a more significant correction if tested, but would likely attract buying interest given the recent trend structure.
Momentum & On-Chain Signals
The 1-hour RSI at 46.33 is mildly bearish, hovering just below the neutral 50 level and reflecting the short-term indecision around the EMA cluster resistance. The 4-hour RSI at 54.82 is more encouraging, sitting comfortably in bullish territory and suggesting the medium-term momentum has tilted positive. The daily RSI at 57.45 continues to rise from deeply oversold conditions, a constructive sign, though it has yet to challenge the 60–65 zone that would confirm a stronger trend reversal. The 4H MACD shows the signal and MACD lines beginning to converge near zero from below, with histogram bars turning increasingly positive — a developing bullish crossover that, if confirmed, would add weight to the recovery case. On the 1H OBV, the trend is steadily rising, indicating net accumulation pressure over recent sessions, while the 4H OBV remains in a broader downtrend from macro peaks, highlighting the divergence between near-term buying and the longer structural distribution phase. The funding rate at a modest 0.0047% is neutral-to-slightly positive — healthy, with no signs of overleveraged longs that could fuel a liquidation cascade.
BTC Dominance & Market Sentiment
BTC.D is currently at 55.55%, a level that has been gradually declining from its cycle peak near 58%+ seen in earlier months — a trend that, if it continues, would historically benefit altcoins including ETH as capital rotates. USDT.D at 8.10% remains elevated relative to prior bull market lows, suggesting a meaningful portion of capital is still parked in stablecoins and has not yet re-entered risk assets at scale. For ETH specifically, a further decline in both BTC.D and USDT.D in tandem would be a positive catalyst, but until those dynamics materially shift, ETH may continue to lag BTC in relative performance.
Risk Scenarios
- Bullish case: A clean hourly close above the $1,808–$1,810 EMA cluster, followed by a hold above the daily EMA50 at $1,799, would open a path toward the $1,850–$1,870 resistance band. Continued ETF inflows, positive CLARITY Act sentiment, and a declining BTC dominance could provide the macro fuel for a sustained push toward $1,950+.
- Bearish case: Failure to hold the $1,760–$1,762 4H EMA50/1H EMA200 confluence on a pullback would signal that the current recovery is stalling, increasing the risk of a retest of the $1,691 BB midline or lower. A deterioration in broader market sentiment — particularly if BTC loses its $64,000 level decisively — could amplify downside pressure on ETH and invalidate the current recovery structure.
Outlook
ETH enters July 12 in a cautiously constructive posture, with the medium-term structure improving but key resistance immediately overhead. The $1,800–$1,810 zone is the decisive battleground in the next 24–48 hours; bulls need a confirmed break and hold above this cluster to sustain momentum, while a rejection here risks fading the recent 2.7% weekly gain. The thesis changes materially on a daily close above the EMA50 ($1,799) with follow-through, or conversely, on a breakdown below $1,760 which would question the integrity of the recovery. Overall, the setup favors a cautious bullish lean on the near-to-medium term, but traders should remain disciplined — ETH is still structurally below its daily EMA200 by over 23%, and macro confirmation of a true trend reversal remains outstanding.
Disclaimer: This analysis is for informational purposes only and does not constitute financial advice. Cryptocurrency markets are highly volatile and unpredictable. All trading decisions should be made based on your own research and risk tolerance. Block Digest is not responsible for any financial losses incurred as a result of acting on this content.
Stay Ahead of the Market
Follow BlockDigest for crypto market intelligence, research and real-time updates.


