
BTC
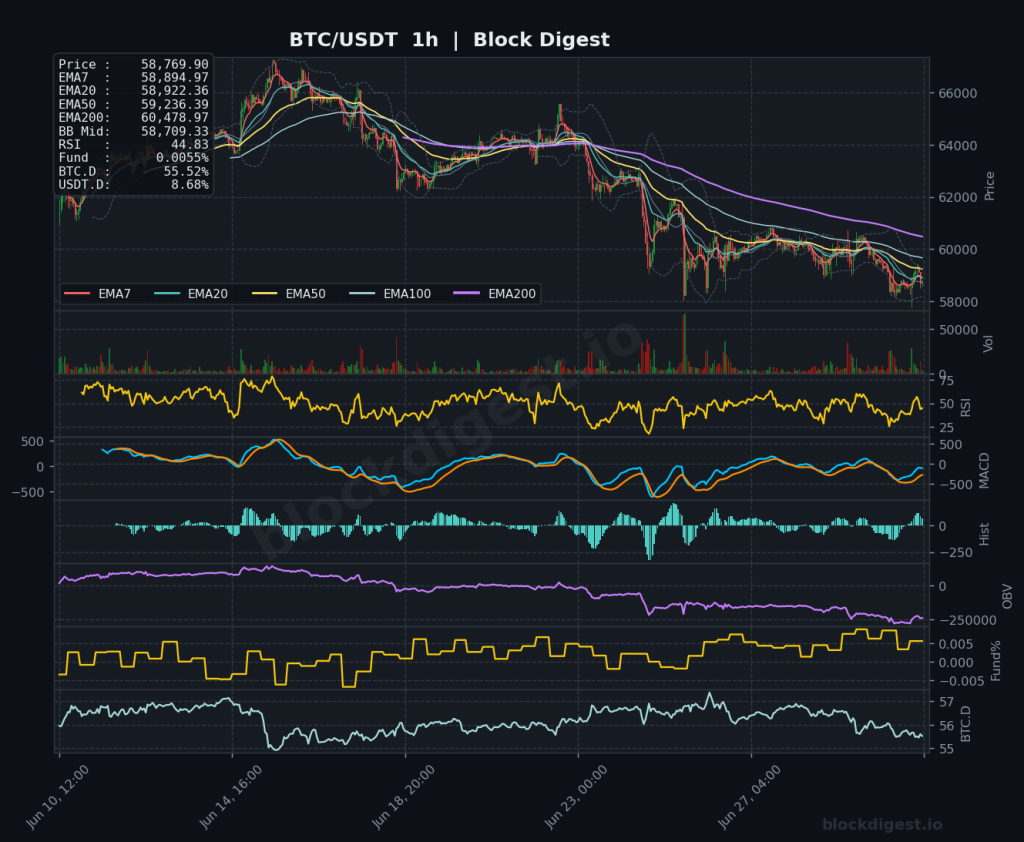
Bitcoin Daily Analysis: BTC Below All EMAs at $58,774 Resistance
Market Overview BTC/USDT is currently trading at $58,774–$58,778, sitting below all major EMAs across every timeframe — a structurally bearish configuration. On the daily chart, price has failed to reclaim the EMA7 ($59,809) and trades well beneath the EMA20 ($62,066), EMA50 ($66,310), and EMA200 ($76,236), confirming a sustained downtrend from the cycle highs. The Bollinger...
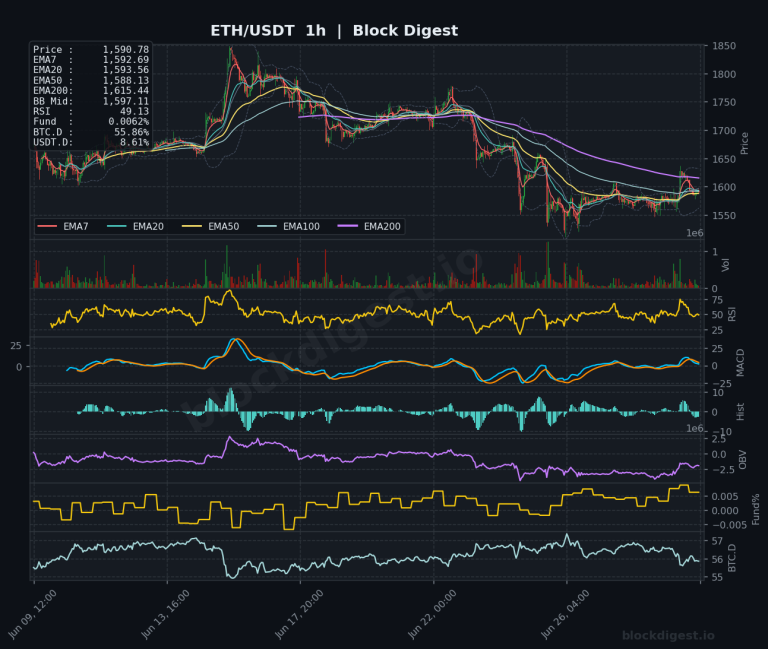
Ethereum Daily Analysis: ETH drops below key EMAs amid prolonged downtrend
Market Overview ETH/USDT is currently trading at $1,590.78, caught in a pronounced downtrend that has persisted across multiple timeframes. On the daily chart, price sits well below all major EMAs — the EMA7 at $1,605.04, EMA20 at $1,670.06, EMA50 at $1,824.33, and EMA200 at $2,285.05 — confirming a deeply bearish macro structure. The Bollinger Band...
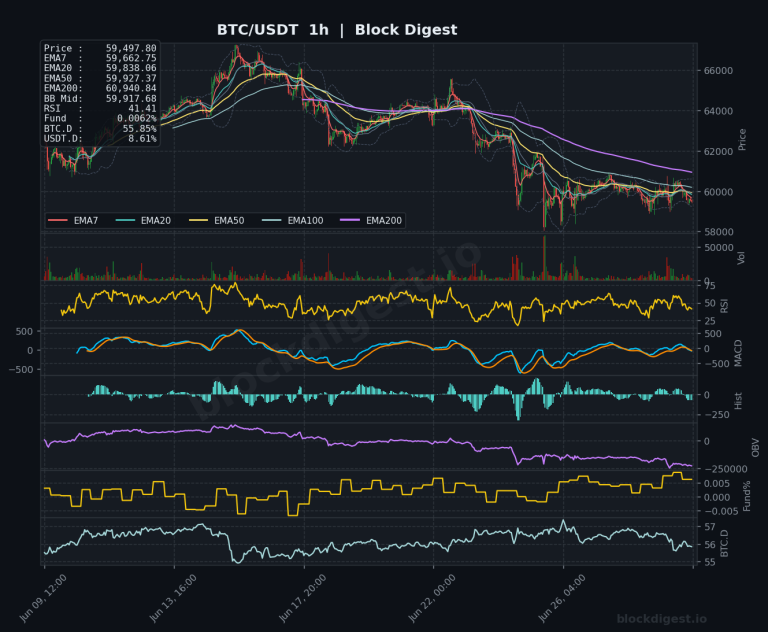
Bitcoin Daily Analysis: Bitcoin Below All EMAs at $59,497
Market Overview Bitcoin is currently trading at $59,497.80, firmly below all major exponential moving averages across every timeframe — a structurally bearish configuration. On the daily chart, price is well beneath the EMA7 ($60,378), EMA20 ($62,497), EMA50 ($66,652), and the distant EMA200 ($76,422), confirming a sustained downtrend from the highs set earlier in the cycle....
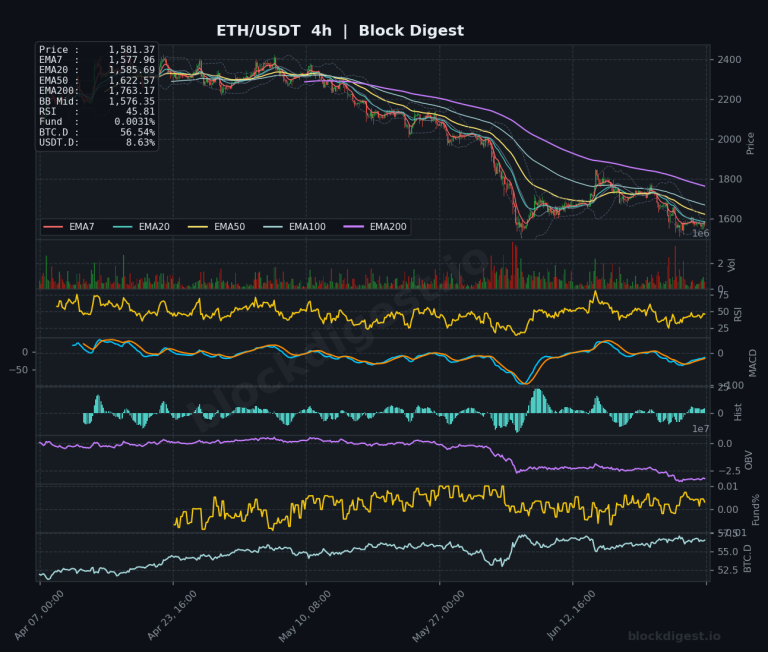
Ethereum Weekly Analysis: ETH Slides to $1,581 Amid Multi-Year Lows
Weekly Market Overview ETH/USDT closed the week ending June 29, 2026 at $1,581.37, continuing a protracted multi-month downtrend that has seen price shed well over 60% from its 2025 highs near $4,500. The weekly candle structure remains decisively bearish, with price printing fresh multi-year lows and finding no meaningful support on the descent. The broader...
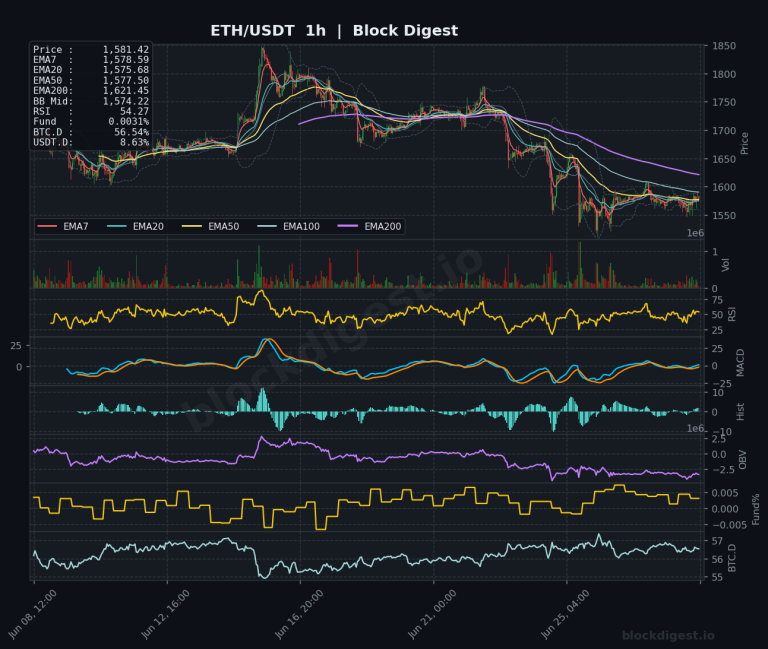
Ethereum Daily Analysis: ETH Below All Major EMAs, Bollinger Band Pressure
Market Overview ETH/USDT is currently trading at $1,581.42, navigating a structurally weak environment on the daily timeframe. Price sits well below all major EMAs — the EMA7 at $1,602.09, EMA20 at $1,675.47, EMA50 at $1,832.66, and the EMA200 at $2,291.94 — painting a consistently bearish EMA stack that has been in place for several months....
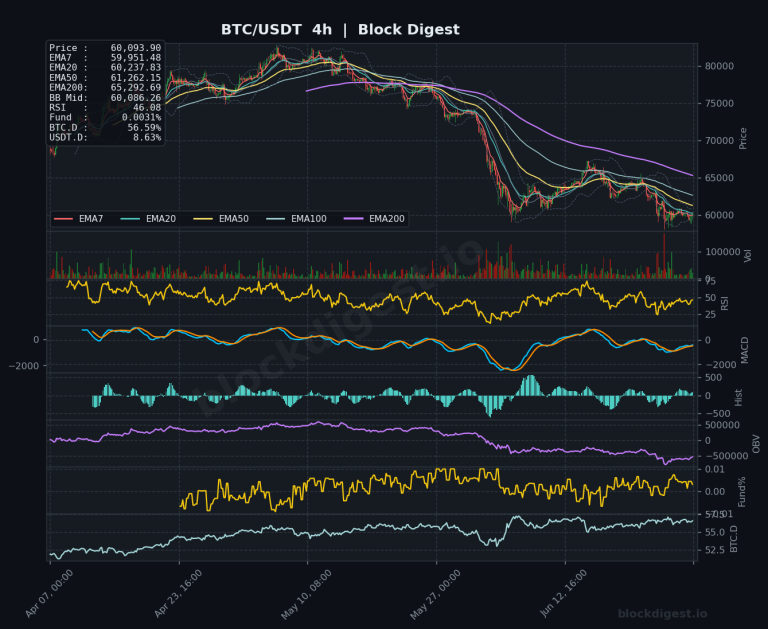
Bitcoin Weekly Analysis: Breakdown Below $60K After Sustained Selling Pressure
Weekly Market Overview Bitcoin closes the week of June 29, 2026 at approximately $60,087, marking a significant deterioration in market structure as price has breached the psychologically critical $60,000 zone. The weekly candle reflects sustained selling pressure following a prolonged downtrend from the all-time high region above $109,000, with price now trading at levels not...
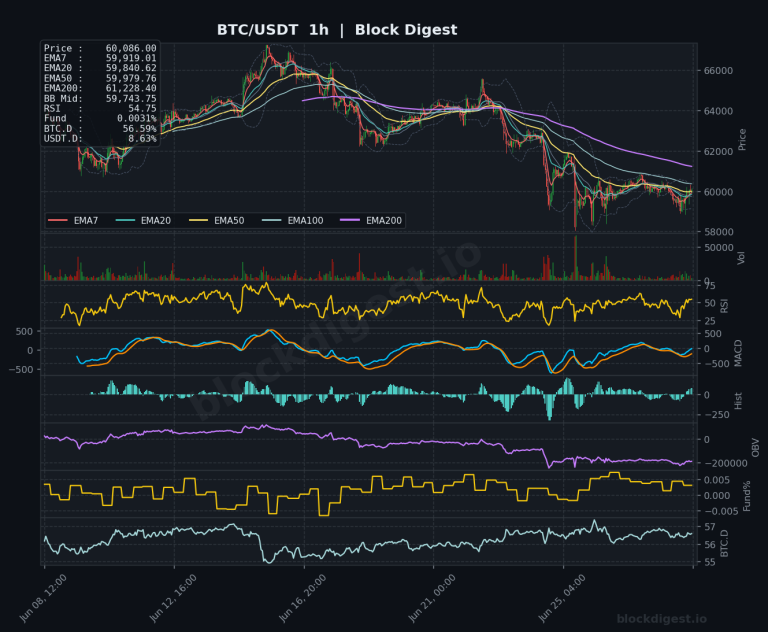
Bitcoin Daily Analysis: Bitcoin Consolidates at $60K Below All Moving Averages
Market Overview Bitcoin is currently trading at approximately $60,087–$60,093, consolidating in a narrow range after a sustained multi-week decline from highs above $109,000. Price sits well below all major exponential moving averages on the daily timeframe — with EMA7 at $60,637, EMA20 at $62,800, EMA50 at $66,939, and EMA200 at $76,601 — confirming that the...

Ethereum Daily Analysis: ETH Breaks Below Key EMAs at $1,574
Market Overview ETH/USDT is currently trading at $1,574.36, deeply entrenched in a sustained downtrend that has carried price from the $4,500+ range down to present levels over an extended period. On the daily timeframe, price is trading well below all major EMAs — EMA7 at $1,609.79, EMA20 at $1,685.68, EMA50 at $1,843.04, and the EMA200...
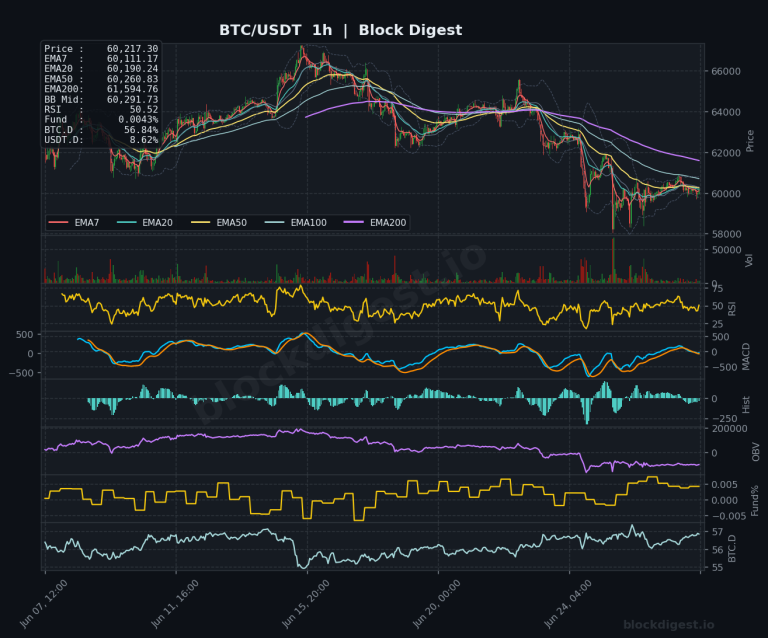
Bitcoin Daily Analysis: Bitcoin Below All Daily EMAs at $60,217
Market Overview Bitcoin is currently trading at $60,217, sitting in a precarious position after a sustained multi-week decline from highs above $109,000 registered earlier in 2026. Price is trading well below all major daily EMAs — the EMA7 at $60,987, EMA20 at $63,150, EMA50 at $67,245, and EMA200 at $76,773 — confirming that the dominant...
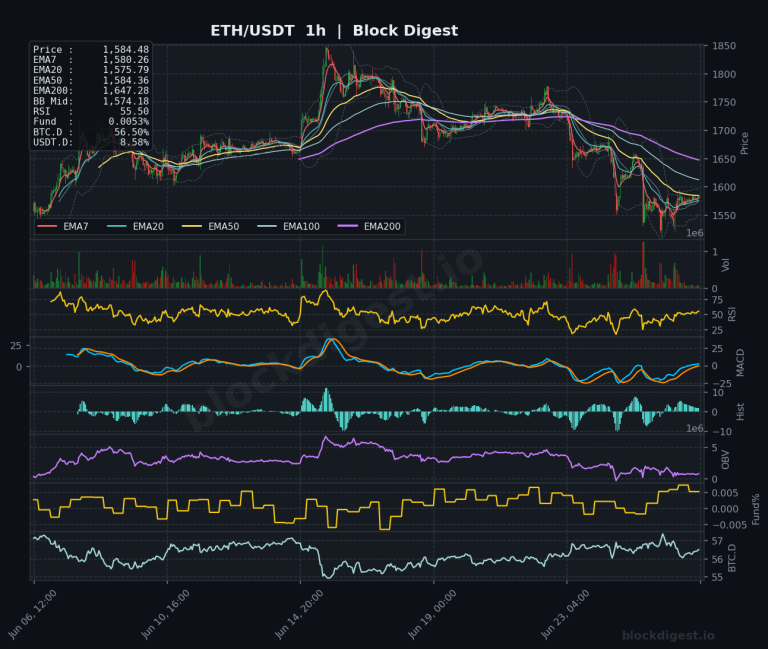
Ethereum Daily Analysis: ETH Below All Key EMAs, Macro Downtrend Confirmed
Market Overview ETH/USDT is currently trading at $1,584.48, operating in a structurally weak position across all major timeframes. On the daily chart, price sits well below every key exponential moving average — EMA7 at $1,624.45, EMA20 at $1,698.48, EMA50 at $1,854.45, and the EMA200 at $2,306.40 — confirming an entrenched macro downtrend that has been...

Bitcoin Daily Analysis: Bitcoin Below All Daily EMAs at $60.5K
Market Overview Bitcoin is currently trading at $60,469.90, sitting in a structurally weakened position as price trades well below all major daily EMAs — the EMA7 at $61,361, EMA20 at $63,503, EMA50 at $67,550, and the EMA200 at $76,938. The daily Bollinger Band midline at $63,097 is acting as overhead resistance, with price hugging the...
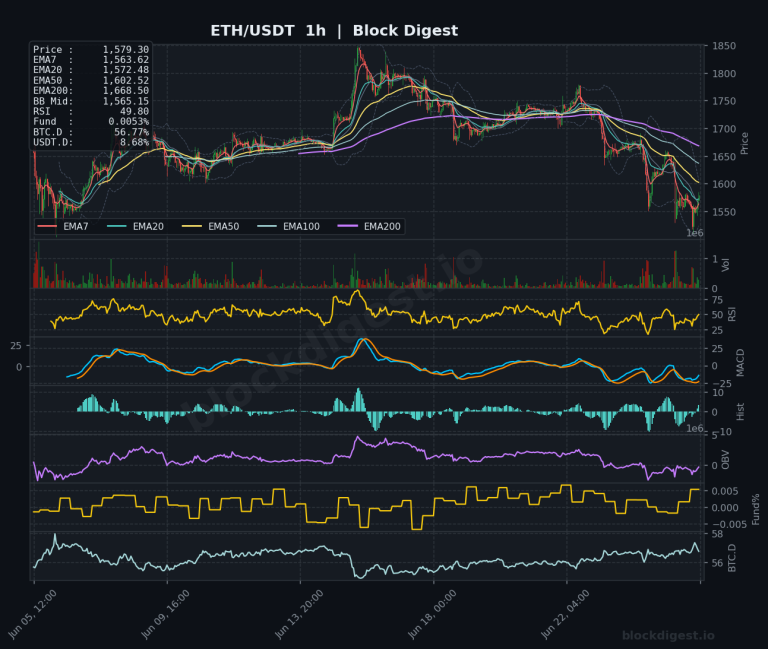
Ethereum Daily Analysis: ETH Below Key EMAs in Structural Weakness
Market Overview ETH/USDT is currently trading at $1,579.30, positioned in a structurally weak setup across all major timeframes. Price sits below every significant EMA on the daily chart — EMA7 at $1,638.13, EMA20 at $1,710.62, EMA50 at $1,865.53, and the EMA200 at a distant $2,314.09 — confirming an entrenched bearish trend that has been in...