
Market Overview
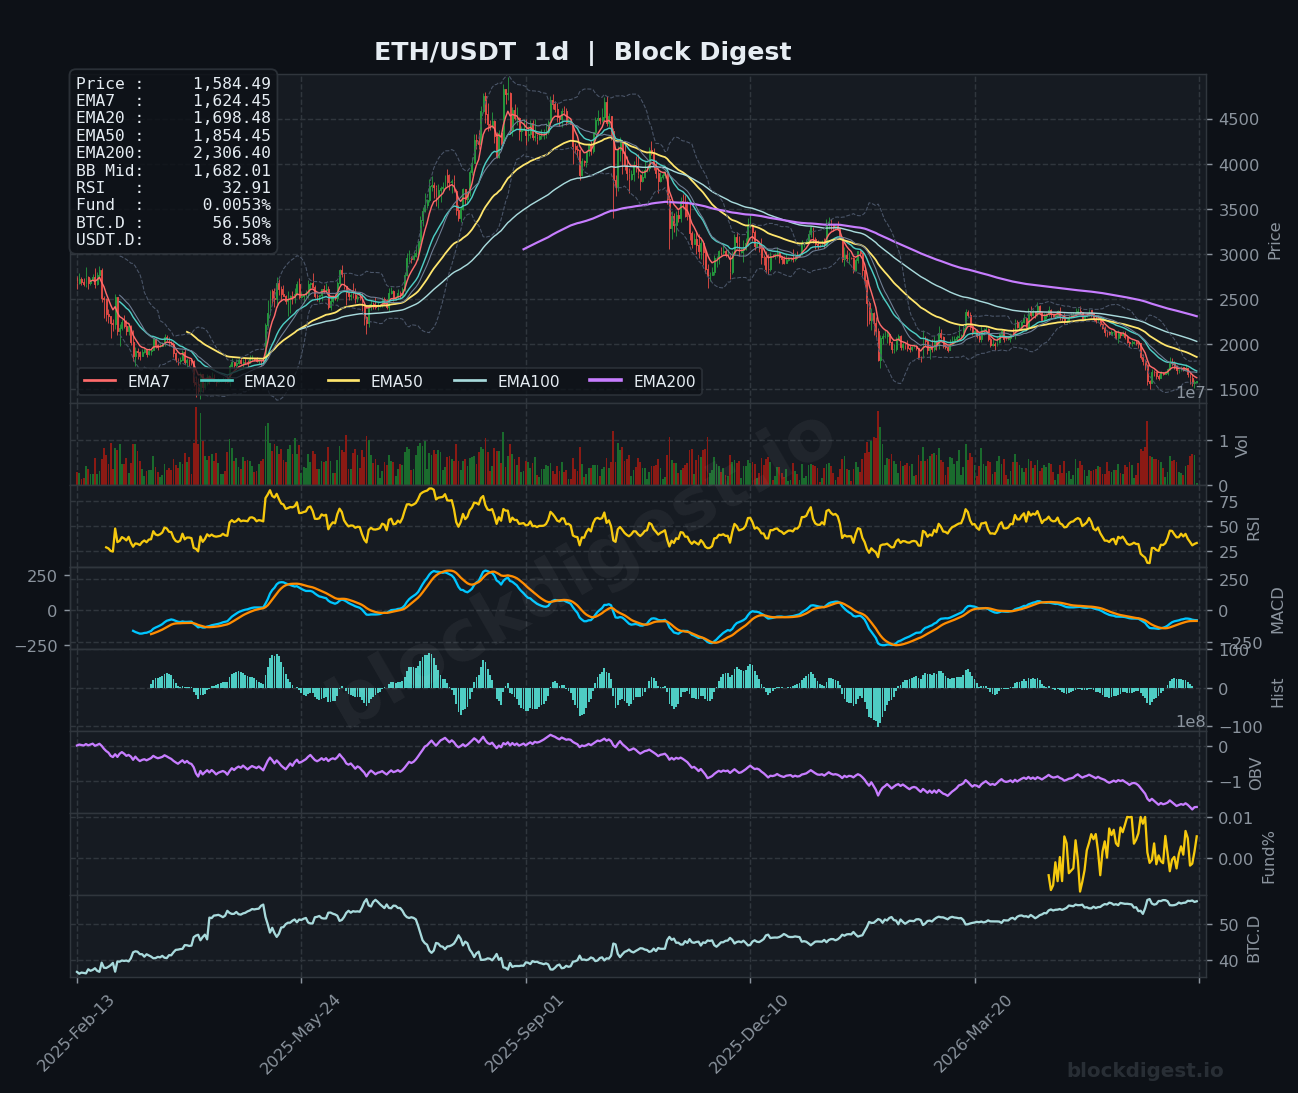
ETH/USDT is currently trading at $1,584.48, operating in a structurally weak position across all major timeframes. On the daily chart, price sits well below every key exponential moving average — EMA7 at $1,624.45, EMA20 at $1,698.48, EMA50 at $1,854.45, and the EMA200 at $2,306.40 — confirming an entrenched macro downtrend that has been in place for well over a year. Price is also trading beneath the daily Bollinger Band midline of $1,682.01, placing ETH in the lower half of the band and signaling persistent bearish pressure. The recent breakdown from the $1,750–$1,800 range has re-accelerated the decline, with price now testing critical near-term support around the $1,540–$1,580 zone.
Multi-Timeframe Confluence
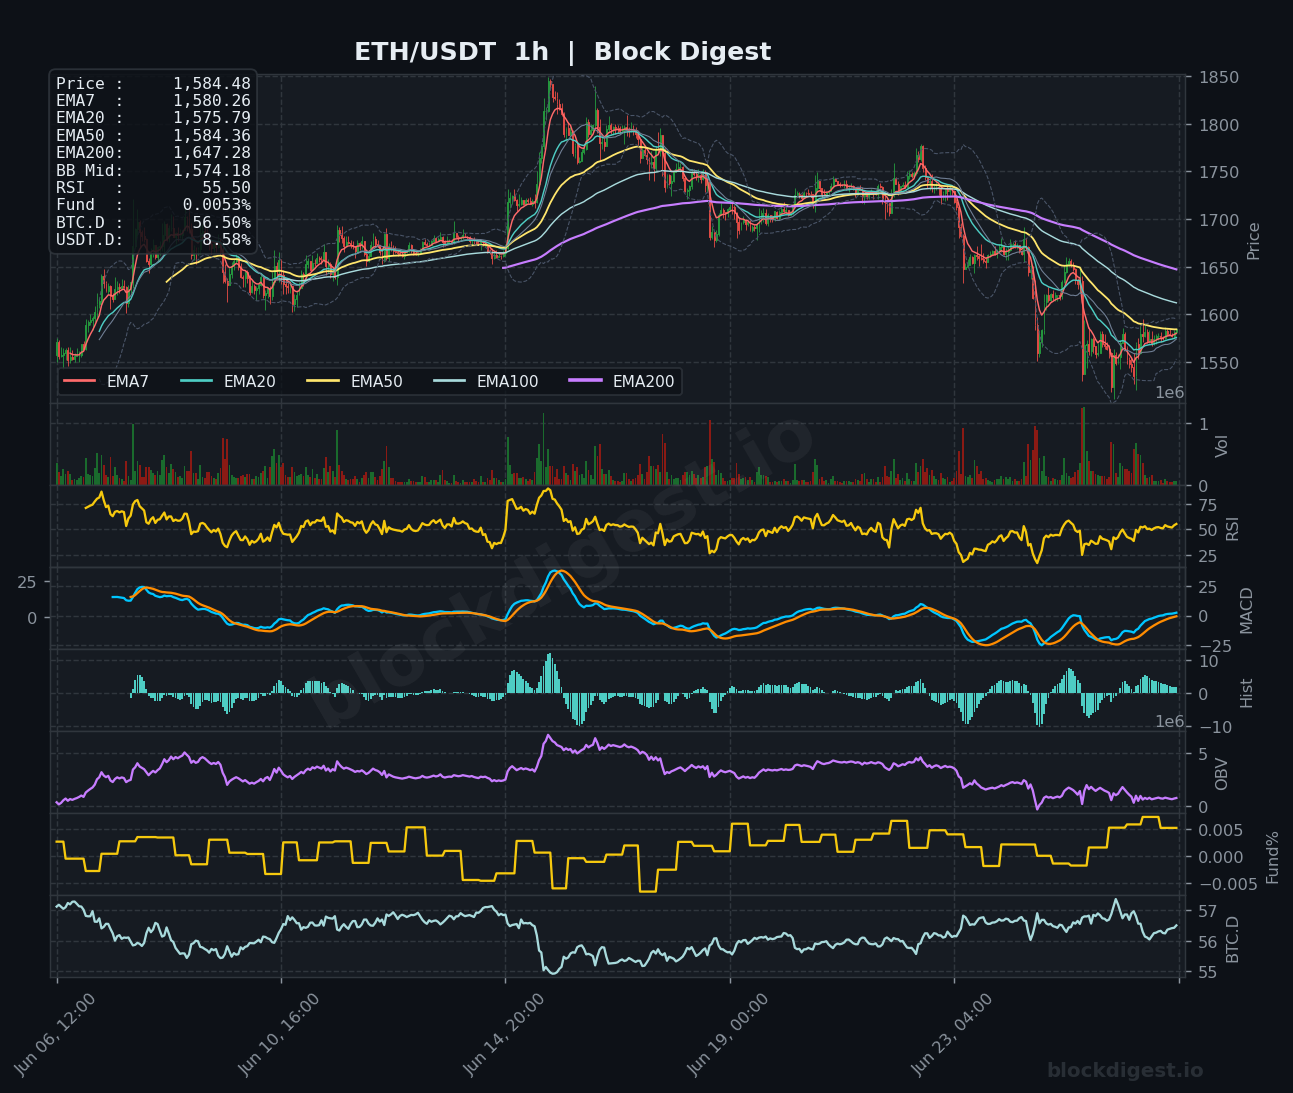
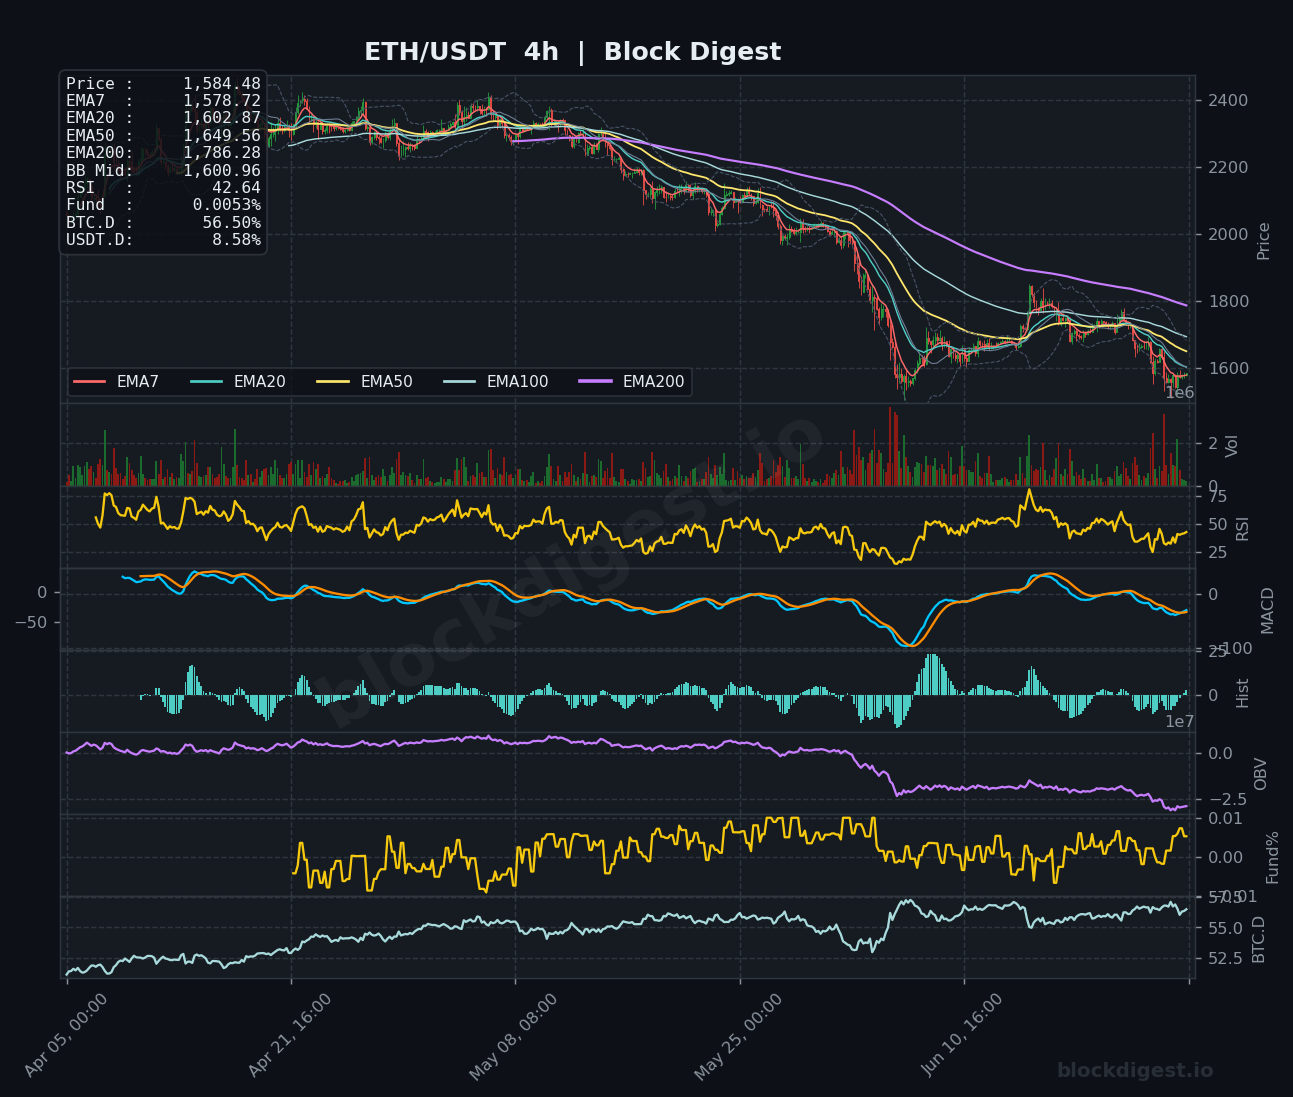
Across all three timeframes, the bearish structure is broadly aligned, offering little in the way of contrarian signals. On the 1h chart, price trades just above the EMA7 ($1,580.26) and EMA20 ($1,575.79) but remains well below the EMA200 ($1,647.28), indicating any near-term bounce is operating within a larger bearish context. The 4h chart reinforces this with price decisively beneath the EMA20 ($1,602.87), EMA50 ($1,649.56), and EMA200 ($1,786.28), all of which slope downward in a bearish cascade. The only minor divergence is that the 1h RSI at 55.50 shows a modest short-term recovery attempt, but this contrasts sharply with the 4h RSI at 42.64 and the deeply oversold daily RSI at 32.91, suggesting the hourly bounce is tactical noise within a structurally deteriorating trend.
Key Levels to Watch
- Resistance: $1,620–$1,647 — confluence of the 1h EMA200 ($1,647.28) and near-term supply zone from the recent rejection; reclaiming this area is the first requirement for any bullish recovery attempt.
- Resistance: $1,682–$1,700 — the daily Bollinger Band midline ($1,682.01) and 4h EMA20 ($1,602.87) cluster form a layered resistance band that has repeatedly rejected rallies in recent sessions.
- Resistance: $1,786–$1,800 — the 4h EMA200 ($1,786.28) aligns with a key psychological level and prior consolidation zone; this level represents the minimum threshold for any macro trend shift.
- Support: $1,540–$1,550 — the recent swing low and lower Bollinger Band vicinity on the 1h; a clean break below here opens accelerated downside.
- Support: $1,500 — major psychological support and a high-volume node from prior market structure; loss of this level would represent a significant structural breakdown.
- Support: $1,450–$1,460 — deeper structural support from historical price action; a relevant target should selling pressure intensify in the days ahead.
Momentum & On-Chain Signals
The daily RSI at 32.91 is approaching oversold territory but has not yet printed a confirmed reversal signal, leaving room for further downside before exhaustion sets in. The 4h MACD shows both lines in negative territory with the histogram displaying shallow negative bars, suggesting bearish momentum is present but losing some intensity at current levels. OBV on the 4h chart has declined sharply and continues to trend downward, confirming that volume is flowing out of ETH — a clear distribution signal rather than accumulation. Funding rates at 0.0053% remain mildly positive across timeframes, which is a slight concern as it indicates long bias persists despite the downtrend, leaving room for further long liquidations to suppress price.
BTC Dominance & Market Sentiment
BTC dominance is currently elevated at 56.50%, a multi-year high range reading that reflects sustained capital rotation away from altcoins and into Bitcoin. USDT dominance at 8.58% suggests a meaningful portion of market participants remain parked in stablecoins, indicating risk-off sentiment has not fully unwound. For ETH specifically, the combination of rising BTC.D and elevated USDT.D is a structurally unfavorable backdrop, as it historically correlates with continued altcoin underperformance relative to BTC.
Risk Scenarios
- Bullish case: A sustained reclaim of $1,647 (1h EMA200) on meaningful volume, accompanied by a daily RSI bounce above 40 and MACD histogram turning positive on the 4h, would signal a credible relief rally toward $1,750–$1,786. A broader shift would require BTC.D rolling over from current levels to confirm renewed altcoin appetite.
- Bearish case: A confirmed 4h close below $1,540 with accelerating OBV decline would expose ETH to a test of $1,500 and potentially $1,450 in short order. Continued BTC.D expansion above 57% alongside positive funding rates being flushed would validate this scenario.
Outlook
The path of least resistance for ETH remains to the downside given the aligned bearish structure across the 4h and daily timeframes, with the 1h offering only a tepid short-term bounce from deeply sold levels. The critical trigger to watch over the next 24–48 hours is whether price can sustain above the $1,575–$1,580 intraday support cluster or rolls over to retest $1,540. Any thesis change to the upside requires a decisive reclaim of $1,647 on the 1h and a cooling of BTC dominance. Until those conditions materialize, the bias remains cautiously bearish with the $1,500 level as the key medium-term downside reference point.
Disclaimer: This analysis is for informational purposes only and does not constitute financial advice. Cryptocurrency markets are highly volatile and unpredictable. All trading decisions should be made based on your own research and risk tolerance. Block Digest is not responsible for any financial losses incurred as a result of acting on this content.
Stay Ahead of the Market
Follow BlockDigest for crypto market intelligence, research and real-time updates.


