
Market Overview
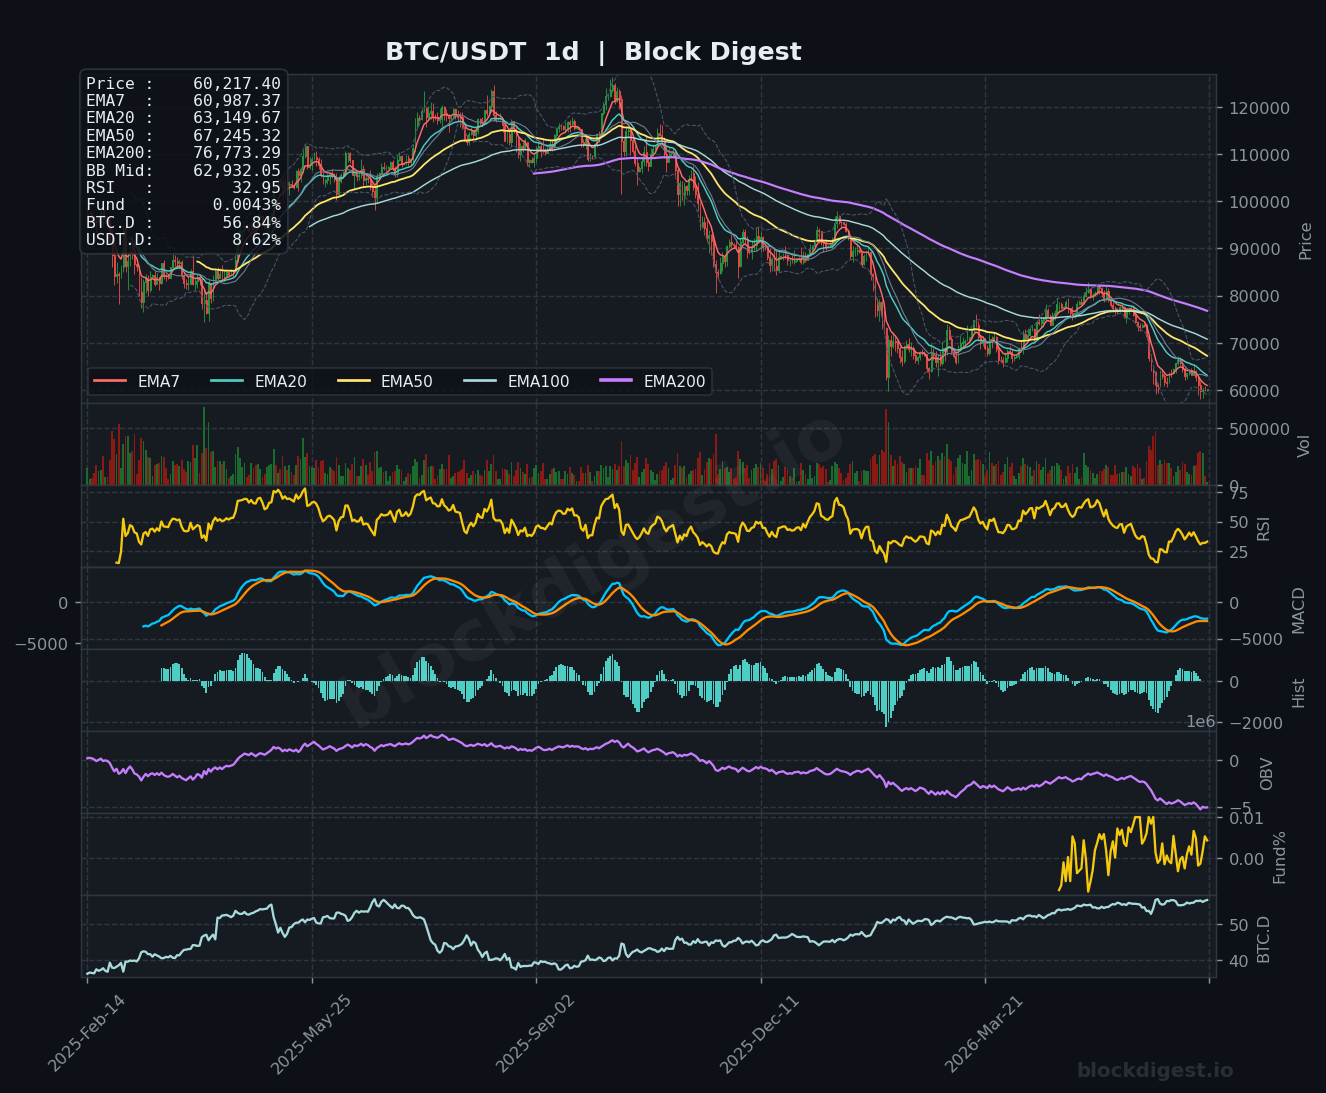
Bitcoin is currently trading at $60,217, sitting in a precarious position after a sustained multi-week decline from highs above $109,000 registered earlier in 2026. Price is trading well below all major daily EMAs — the EMA7 at $60,987, EMA20 at $63,150, EMA50 at $67,245, and EMA200 at $76,773 — confirming that the dominant daily trend remains firmly bearish. The Bollinger Band midline on the daily sits at $62,932, and price is pressing against the lower band, suggesting continued compression and distribution pressure. The overall market structure reflects a prolonged downtrend with no confirmed reversal signal yet visible on the higher timeframe.
Multi-Timeframe Confluence
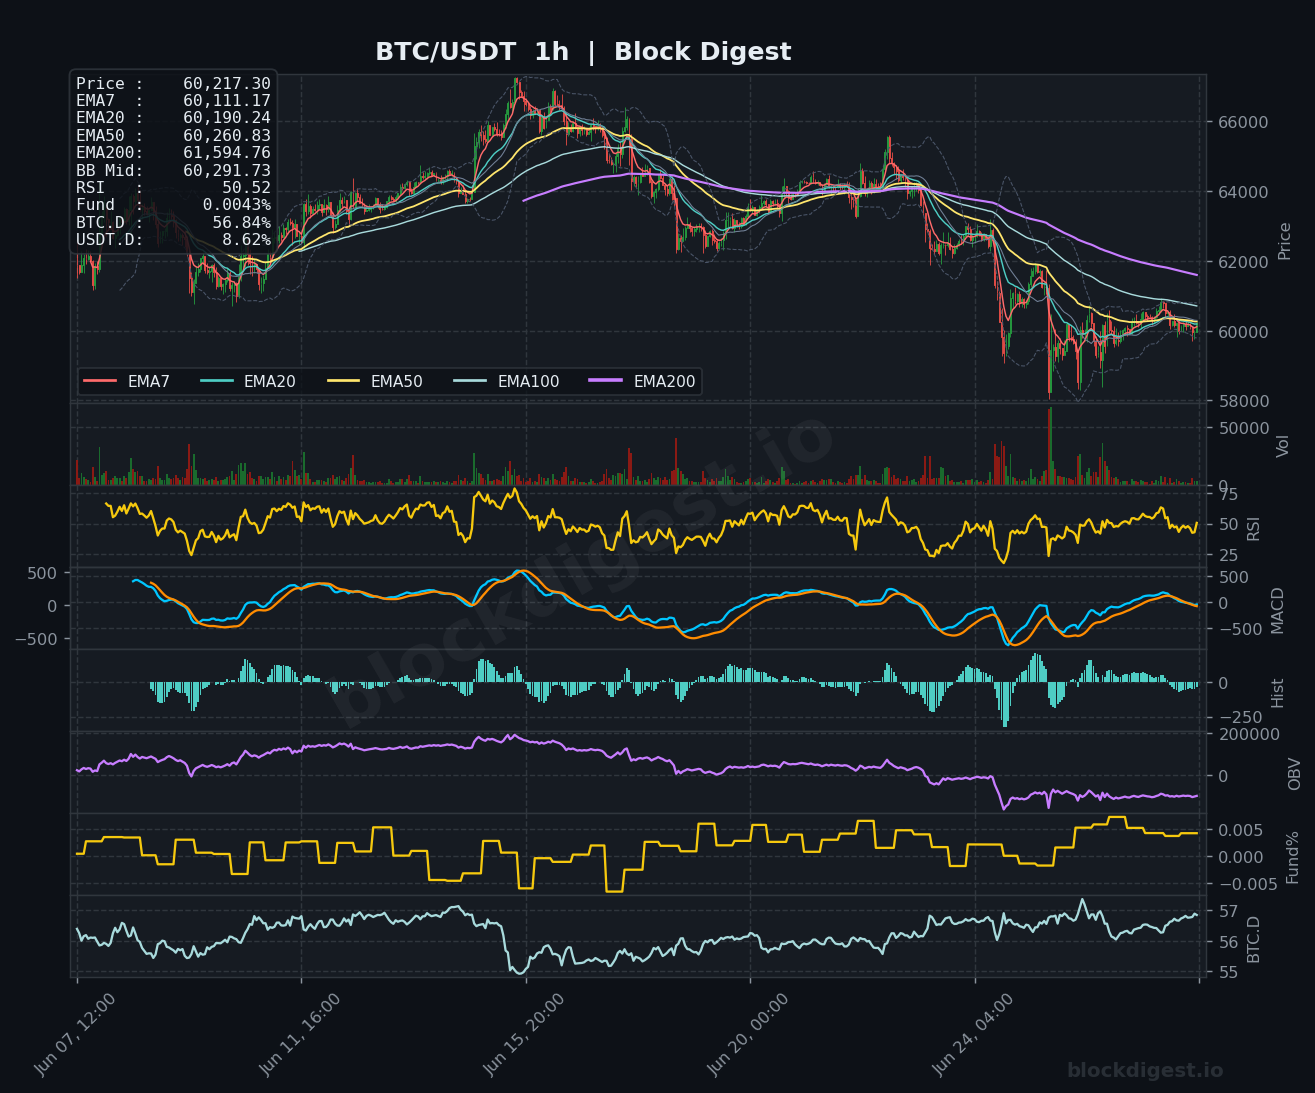
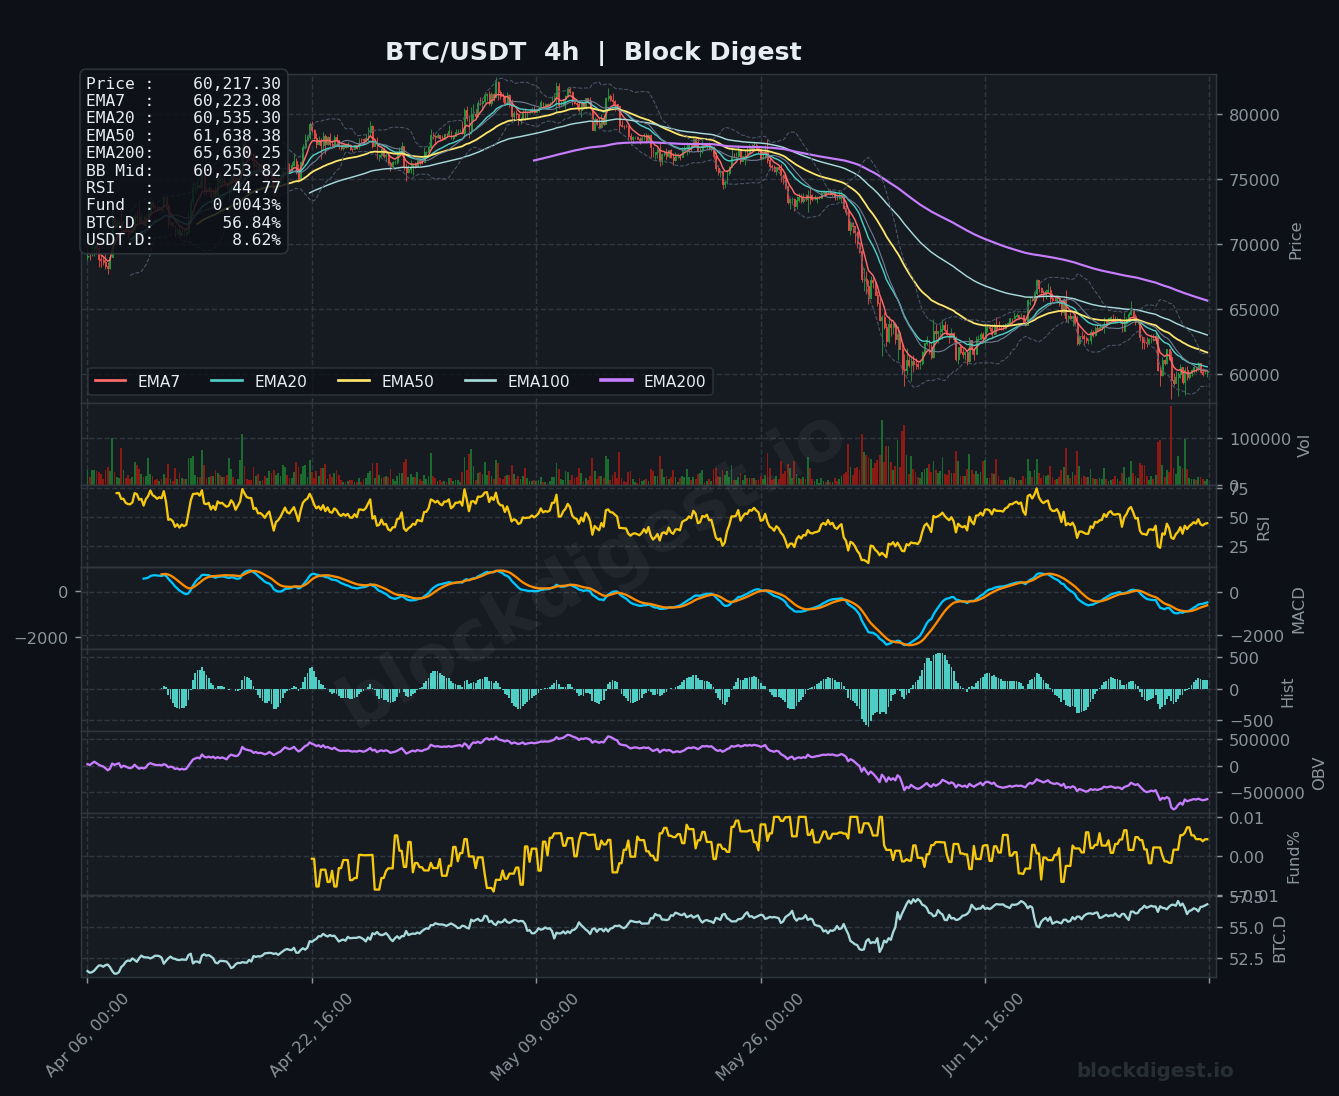
On the 1-hour chart, price is consolidating just below the EMA50 ($60,261) and EMA200 ($61,595), with the shorter EMAs (EMA7 at $60,111 and EMA20 at $60,190) tightly coiled beneath the BB midline at $60,292 — indicating near-term indecision rather than a recovery. The 4-hour chart paints a similarly bearish picture, with price well below the EMA20 ($60,535), EMA50 ($61,638), and EMA200 ($65,630), and the RSI sitting at 44.77, failing to reclaim the neutral 50 level. The daily timeframe’s RSI at 32.95 is approaching oversold territory, which may temper near-term downside velocity, but the 4-hour and daily EMAs are all in a bearish sequential alignment, providing no meaningful confluence in favor of bulls at this stage.
Key Levels to Watch
- Resistance: $60,535 — 4h EMA20, the nearest dynamic overhead resistance where any bounce attempt is likely to stall
- Resistance: $61,595–$61,638 — convergence of the 1h EMA200 and 4h EMA50, a critical zone that bears must defend to maintain trend control
- Resistance: $62,932–$63,150 — daily BB midline and daily EMA20, a recovery above this cluster would be the first meaningful structural signal for bulls
- Support: $59,800–$60,000 — psychological round number and recent intraday lows; a clean break here opens the next leg down
- Support: $58,000 — approximate lower Bollinger Band region on the daily chart, likely to act as a near-term floor in an accelerated selloff
- Support: $56,500–$57,000 — macro horizontal support zone from prior consolidation, critical medium-term line in the sand
Momentum & On-Chain Signals
The daily RSI at 32.95 is nearing the oversold threshold of 30, which historically has preceded short-term bounces, though it is not yet a confirmed reversal signal. On the 4-hour chart, the MACD shows the signal and MACD lines converging near the zero line with the histogram printing small positive bars, suggesting a tentative short-term recovery attempt, but momentum remains weak and unconvincing. The OBV on both the 4-hour and daily charts is trending noticeably lower, reflecting sustained distribution with sell-side volume dominating — this is a meaningful bearish divergence against any price stabilization narrative. Funding rates are holding at a mildly positive +0.0043%, indicating the market is not yet in a capitulative negative funding environment, which means leveraged longs remain modestly exposed.
BTC Dominance & Market Sentiment
BTC dominance is currently at 56.84%, a relatively elevated reading that suggests capital has been rotating into Bitcoin relative to altcoins, likely as a defensive flight rather than a risk-on rotation. USDT dominance at 8.62% reflects meaningful sidelined capital — a level that could fuel a recovery rally if sentiment turns, but equally suggests investors remain risk-averse. Together, these readings point to a cautious, defensive market environment where the broader crypto risk appetite remains suppressed.
Risk Scenarios
- Bullish case: A reclaim of $61,595–$61,638 (1h EMA200 / 4h EMA50) on a closing 4-hour basis with expanding volume would signal a credible short-term recovery, targeting the $62,932–$63,150 resistance cluster. Sustained follow-through above $63,150 would begin to challenge the prevailing bearish structure.
- Bearish case: A confirmed daily close below $59,800 would likely trigger a swift move toward the $58,000 lower band support, with extended downside toward the $56,500–$57,000 macro support zone if selling volume accelerates. Failure at $56,500 on the daily timeframe would materially worsen the long-term outlook.
Outlook
The directional bias remains bearish on the higher timeframes, with BTC trading beneath all major daily EMAs in a confirmed downtrend that has persisted since the all-time high territory. The most critical trigger to watch over the next 24–48 hours is whether price can hold above the $59,800 psychological zone and whether the 4-hour MACD follow-through sustains any near-term bounce attempt. A reclaim of $61,600 would be the minimum requirement to neutralize immediate downside pressure, while a daily close above $63,150 would be needed to shift the bias to cautiously neutral. Until those levels are recaptured, rallies should be treated as relief within a broader distribution phase rather than structural reversals.
Disclaimer: This analysis is for informational purposes only and does not constitute financial advice. Cryptocurrency markets are highly volatile and unpredictable. All trading decisions should be made based on your own research and risk tolerance. Block Digest is not responsible for any financial losses incurred as a result of acting on this content.
Stay Ahead of the Market
Follow BlockDigest for crypto market intelligence, research and real-time updates.


