
Market Overview
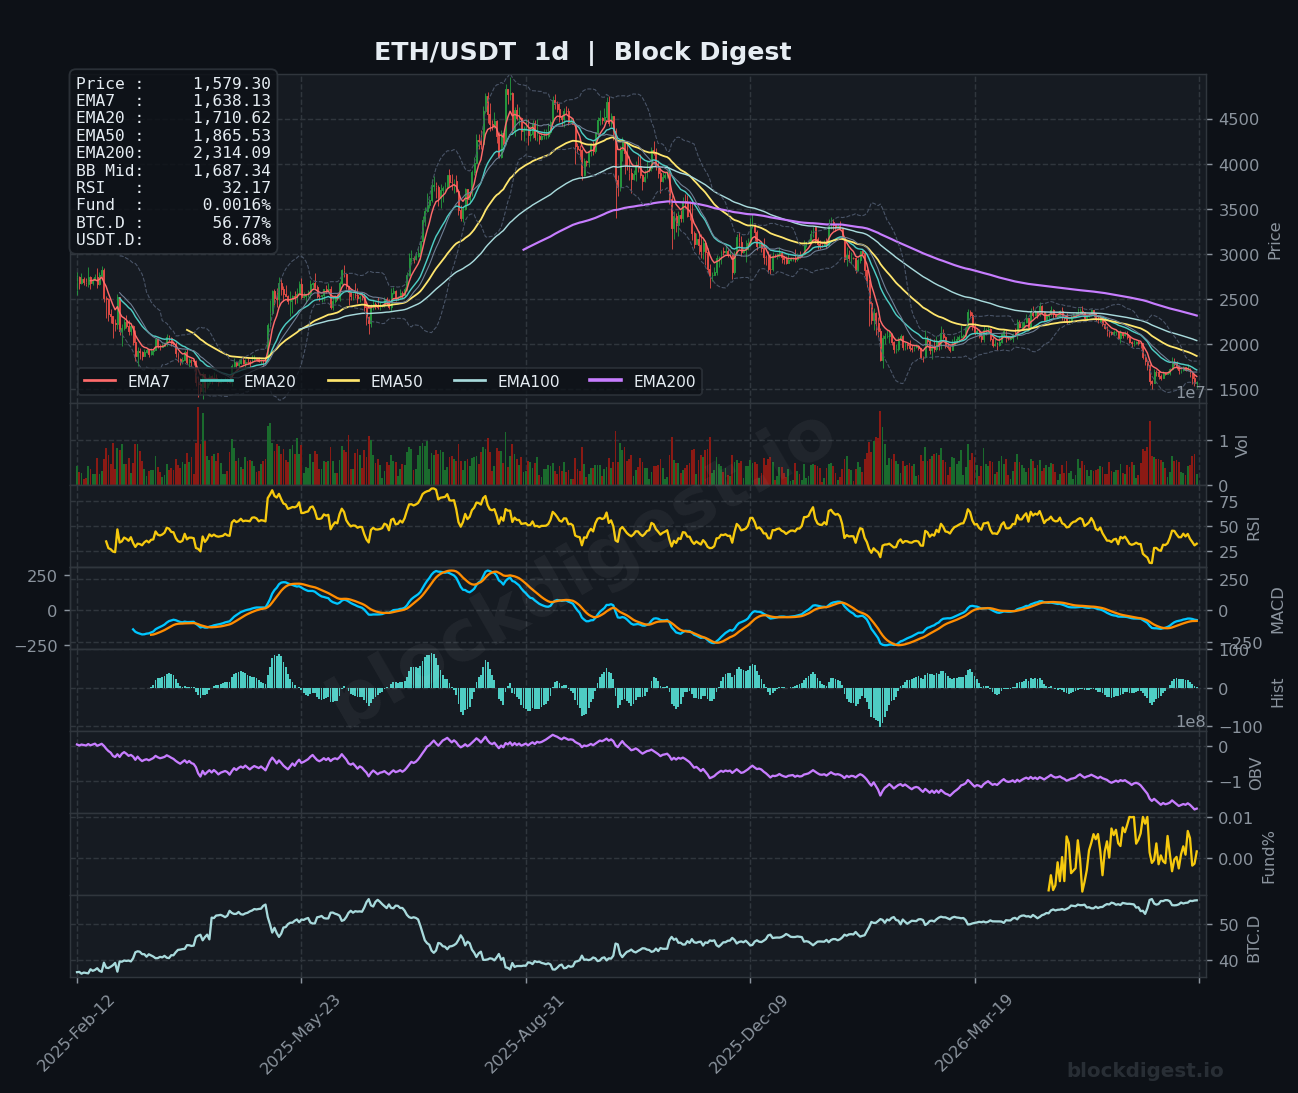
ETH/USDT is currently trading at $1,579.30, positioned in a structurally weak setup across all major timeframes. Price sits below every significant EMA on the daily chart — EMA7 at $1,638.13, EMA20 at $1,710.62, EMA50 at $1,865.53, and the EMA200 at a distant $2,314.09 — confirming an entrenched bearish trend that has been in place since early 2025 highs above $4,000. The Bollinger Band midline on the daily sits at $1,687.34, with price trading well beneath it, indicating continued downward pressure and no meaningful mean-reversion attempt. The dominant daily trend remains decisively bearish, with each EMA in a bearish cascade formation that leaves little structural support above current levels.
Multi-Timeframe Confluence
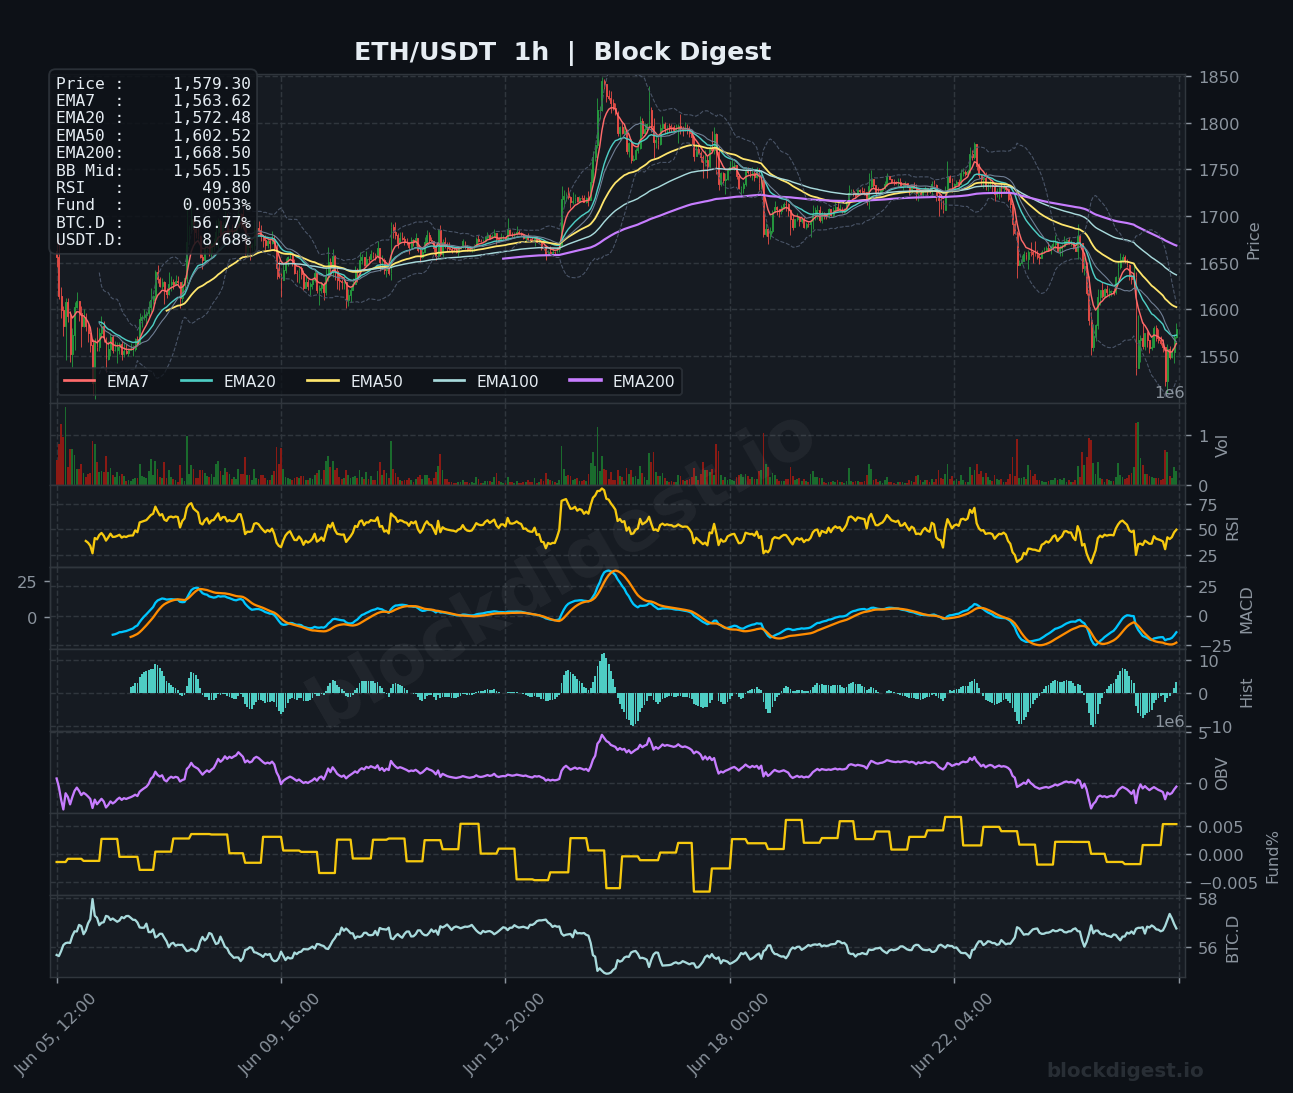
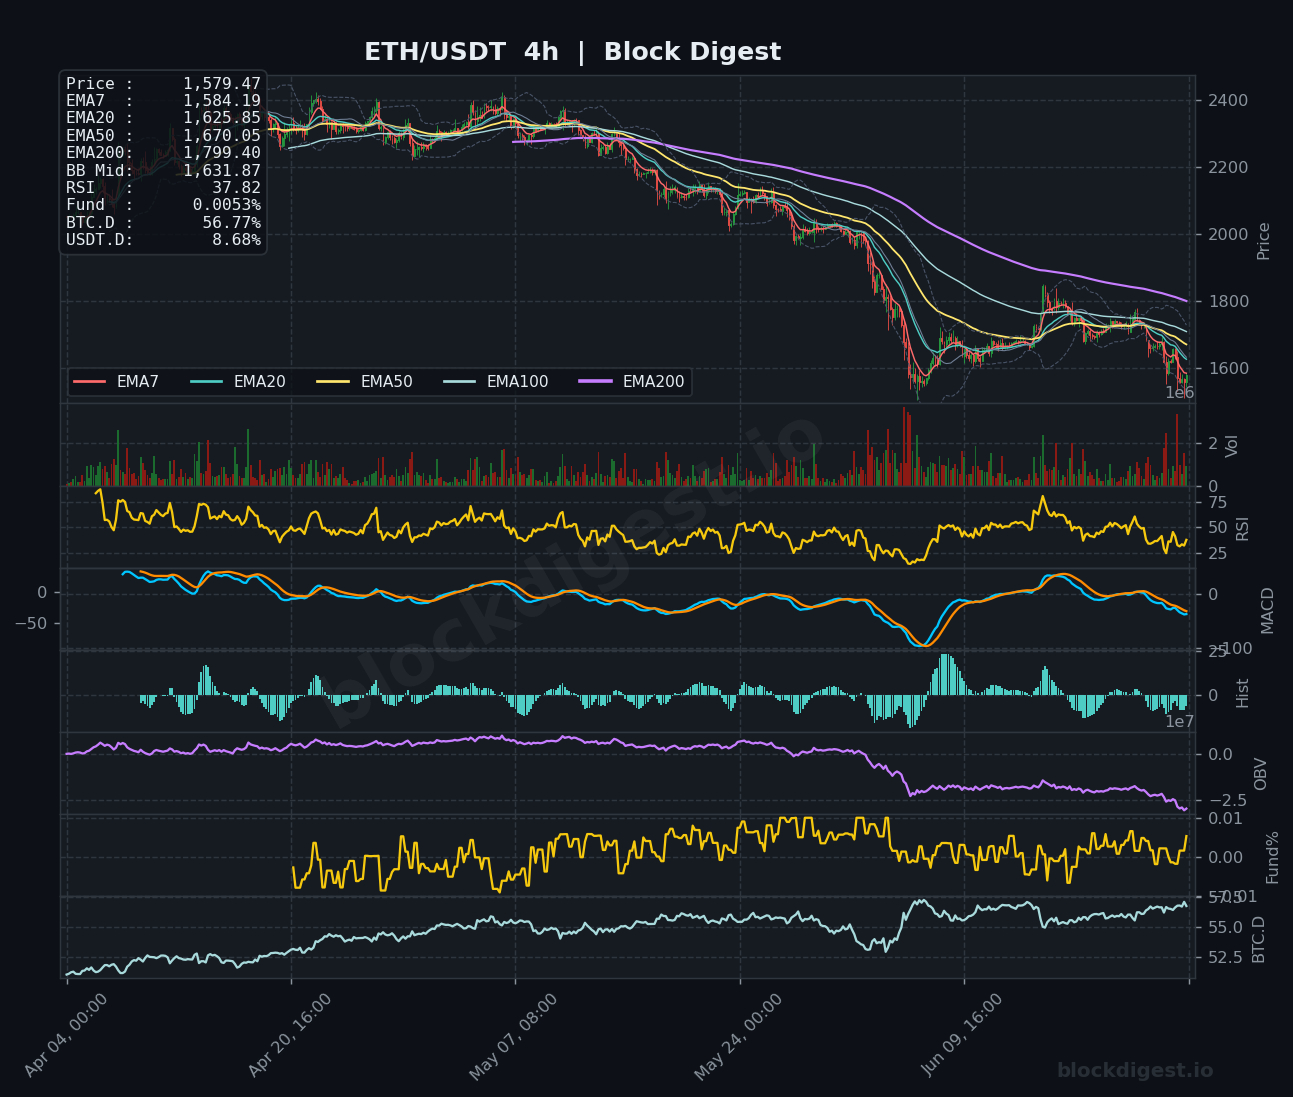
On the 4-hour chart, price at $1,579.47 is trading below all key EMAs — EMA7 ($1,584.19), EMA20 ($1,625.85), EMA50 ($1,670.05), and EMA200 ($1,799.40) — mirroring the daily’s bearish alignment and confirming no meaningful intermediate recovery has materialized. The 1-hour chart presents a marginally more nuanced picture: price at $1,579.30 trades just above the EMA7 ($1,563.62) and EMA20 ($1,572.48), suggesting a minor short-term stabilization attempt, but this is firmly capped by the EMA50 at $1,602.52 and EMA200 at $1,668.50. The convergence of bearish EMA structure across the 4h and 1d timeframes overwhelms any tentative hourly stabilization, meaning short-term momentum is not yet sufficient to challenge the higher timeframe trend. There is no meaningful multi-timeframe bullish confluence present at this stage.
Key Levels to Watch
- Resistance: $1,602–$1,610 — the 1h EMA50 cluster acting as the immediate overhead barrier where rallies have been sold recently
- Resistance: $1,625–$1,638 — confluence of the 4h EMA20 and 1d EMA7, a critical zone that would need to be reclaimed for any trend shift to gain credibility
- Resistance: $1,668–$1,670 — the 1h EMA200 and 4h EMA50 intersection, representing a major structural supply zone
- Support: $1,550–$1,540 — recent local lows visible on the 1h chart; a break here opens the path toward the $1,500 psychological level
- Support: $1,500 — key psychological round number with potential historical significance as a demand zone
- Support: $1,460–$1,440 — deeper structural support derived from prior consolidation zones on the broader daily chart if the $1,500 level fails
Momentum & On-Chain Signals
The RSI readings paint a consistently bearish picture: the daily RSI sits at a deeply oversold 32.17, the 4h RSI at 37.82, and the 1h RSI at a near-neutral 49.80 — the hourly reading suggesting a minor short-term bounce attempt without follow-through conviction. The 4h MACD remains in negative territory with both signal lines below zero, though the histogram is showing some contraction, hinting that downside momentum may be moderating slightly without yet reversing. OBV on the 4h chart has declined sharply and remains depressed, confirming sustained distribution and absence of meaningful accumulation; the daily OBV similarly trends lower, reinforcing the bearish volume profile. The funding rate remains a low positive at 0.0053%, indicating the derivatives market is not overleveraged to either side, which removes an immediate short-squeeze catalyst but also suggests longs are not aggressively positioned for recovery.
BTC Dominance & Market Sentiment
BTC dominance stands at 56.77% — a notably elevated reading that reflects continued capital rotation preference toward Bitcoin over altcoins, a dynamic that has been structurally damaging to ETH’s relative performance throughout this cycle. USDT dominance at 8.68% indicates a meaningful portion of market capital remains parked in stablecoins, suggesting risk appetite is subdued and investors are not yet deploying aggressively into altcoin positions. For ETH specifically, this combination of high BTC.D and elevated USDT.D represents a headwind, as a sustained ETH recovery typically requires both BTC.D compression and USDT.D decline — neither of which is currently in motion.
Risk Scenarios
- Bullish case: A sustained hourly close above $1,602 followed by reclaim of the $1,625–$1,638 EMA cluster on the 4h timeframe, combined with a declining USDT.D reading, could trigger a relief rally targeting the $1,670–$1,710 range with potential to test $1,760.
- Bearish case: Failure to hold the $1,550 support zone on elevated volume would confirm continued capitulation, with the next meaningful targets at $1,500 and, on a sustained break below, $1,440–$1,460.
Outlook
The overall bias for ETH/USDT remains cautiously bearish heading into the next 24–48 hours, with the weight of evidence — EMA structure, OBV distribution, BTC dominance elevation, and price positioning below all major daily EMAs — all aligned to the downside. The daily RSI at 32.17 does introduce the possibility of a technically oversold bounce, but oversold conditions alone are insufficient to reverse an established trend without fundamental catalyst or volume-backed demand. Key triggers to watch include any decisive 4h close above $1,638 for a bullish thesis shift, or a break and retest of $1,550 as resistance for confirmation of further downside. Until price reclaims at minimum the $1,638–$1,670 zone with conviction, any intraday strength should be treated as a corrective bounce within a prevailing bearish structure rather than a trend reversal.
Disclaimer: This analysis is for informational purposes only and does not constitute financial advice. Cryptocurrency markets are highly volatile and unpredictable. All trading decisions should be made based on your own research and risk tolerance. Block Digest is not responsible for any financial losses incurred as a result of acting on this content.
Stay Ahead of the Market
Follow BlockDigest for crypto market intelligence, research and real-time updates.


