
Market Overview
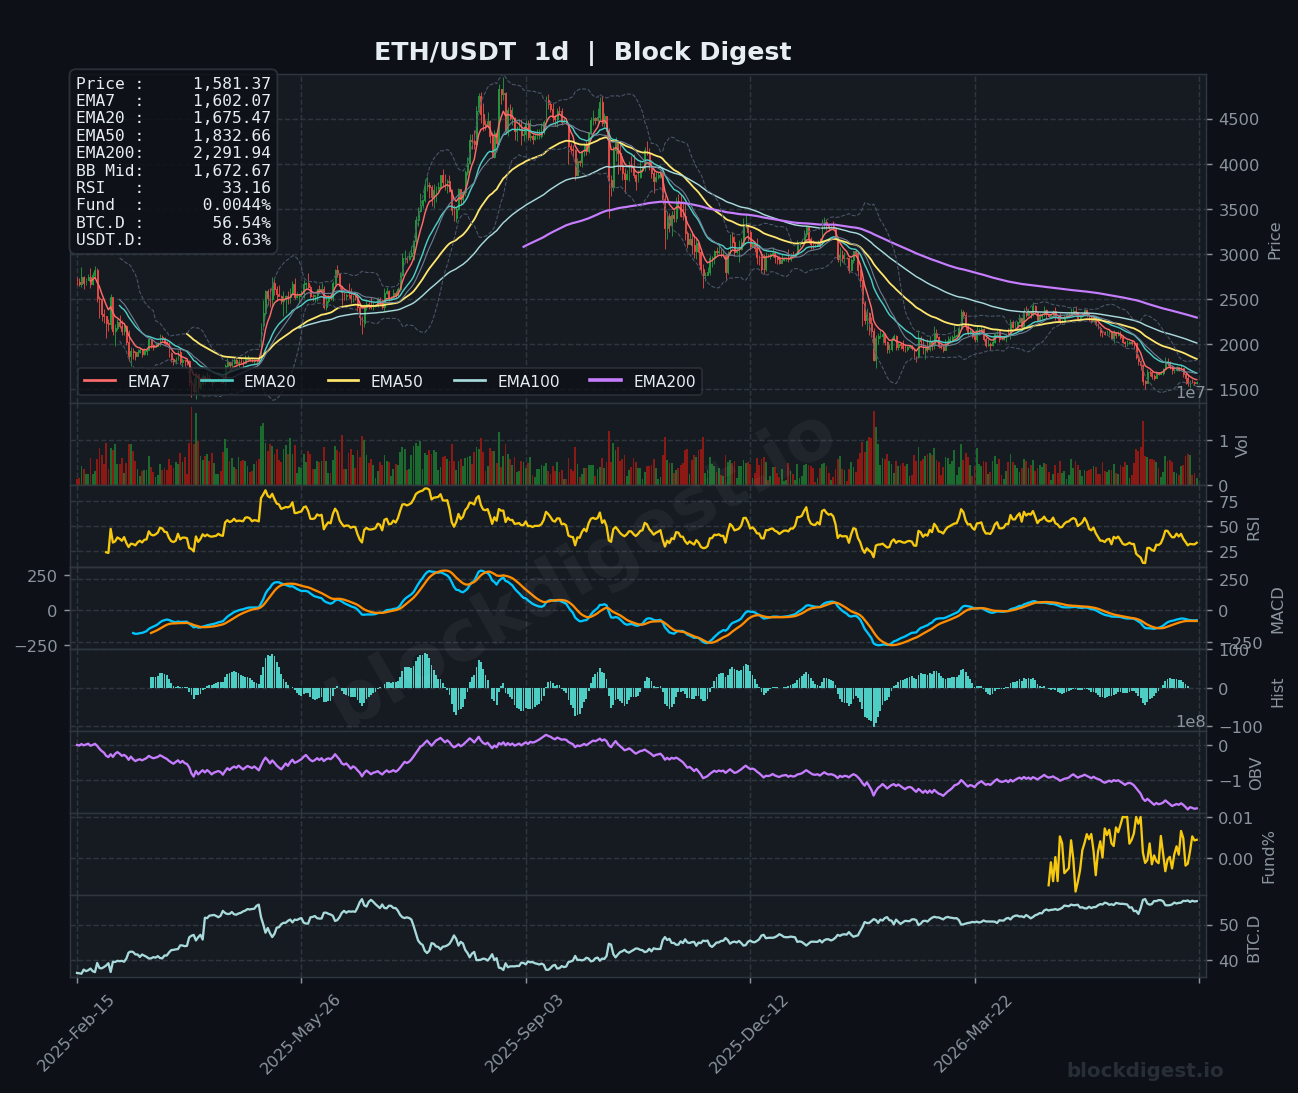
ETH/USDT is currently trading at $1,581.42, navigating a structurally weak environment on the daily timeframe. Price sits well below all major EMAs — the EMA7 at $1,602.09, EMA20 at $1,675.47, EMA50 at $1,832.66, and the EMA200 at $2,291.94 — painting a consistently bearish EMA stack that has been in place for several months. The Bollinger Band midline on the daily sits at $1,672.67, with price pressing against the lower band, indicating sustained selling pressure rather than a mean-reversion bounce. The dominant daily trend remains firmly bearish, with each attempted recovery failing to reclaim meaningful EMA resistance.
Multi-Timeframe Confluence
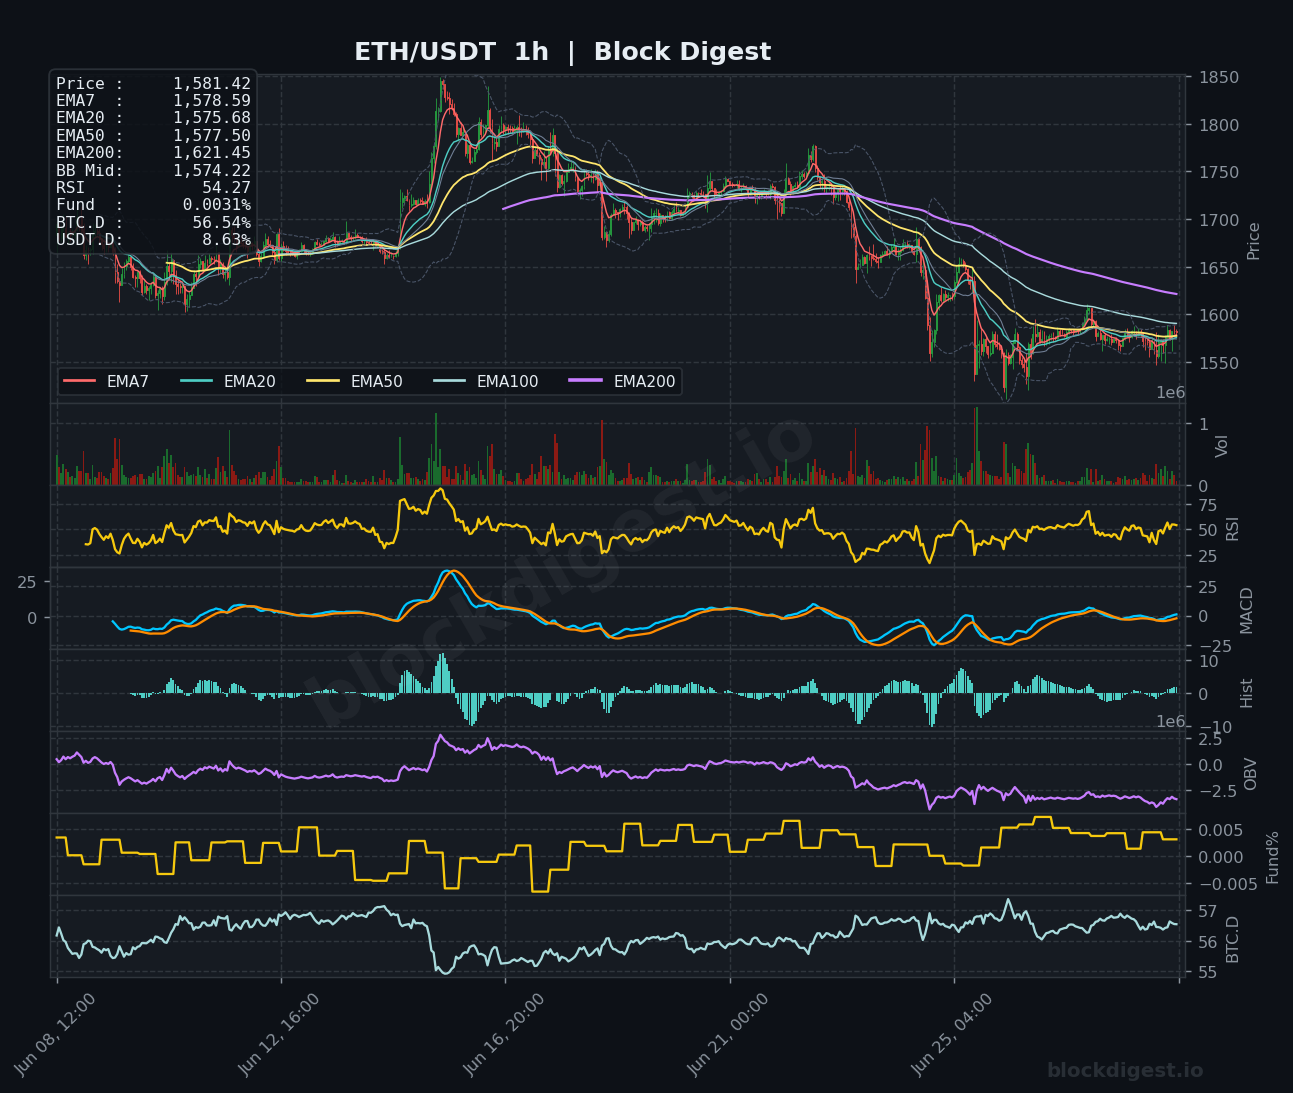
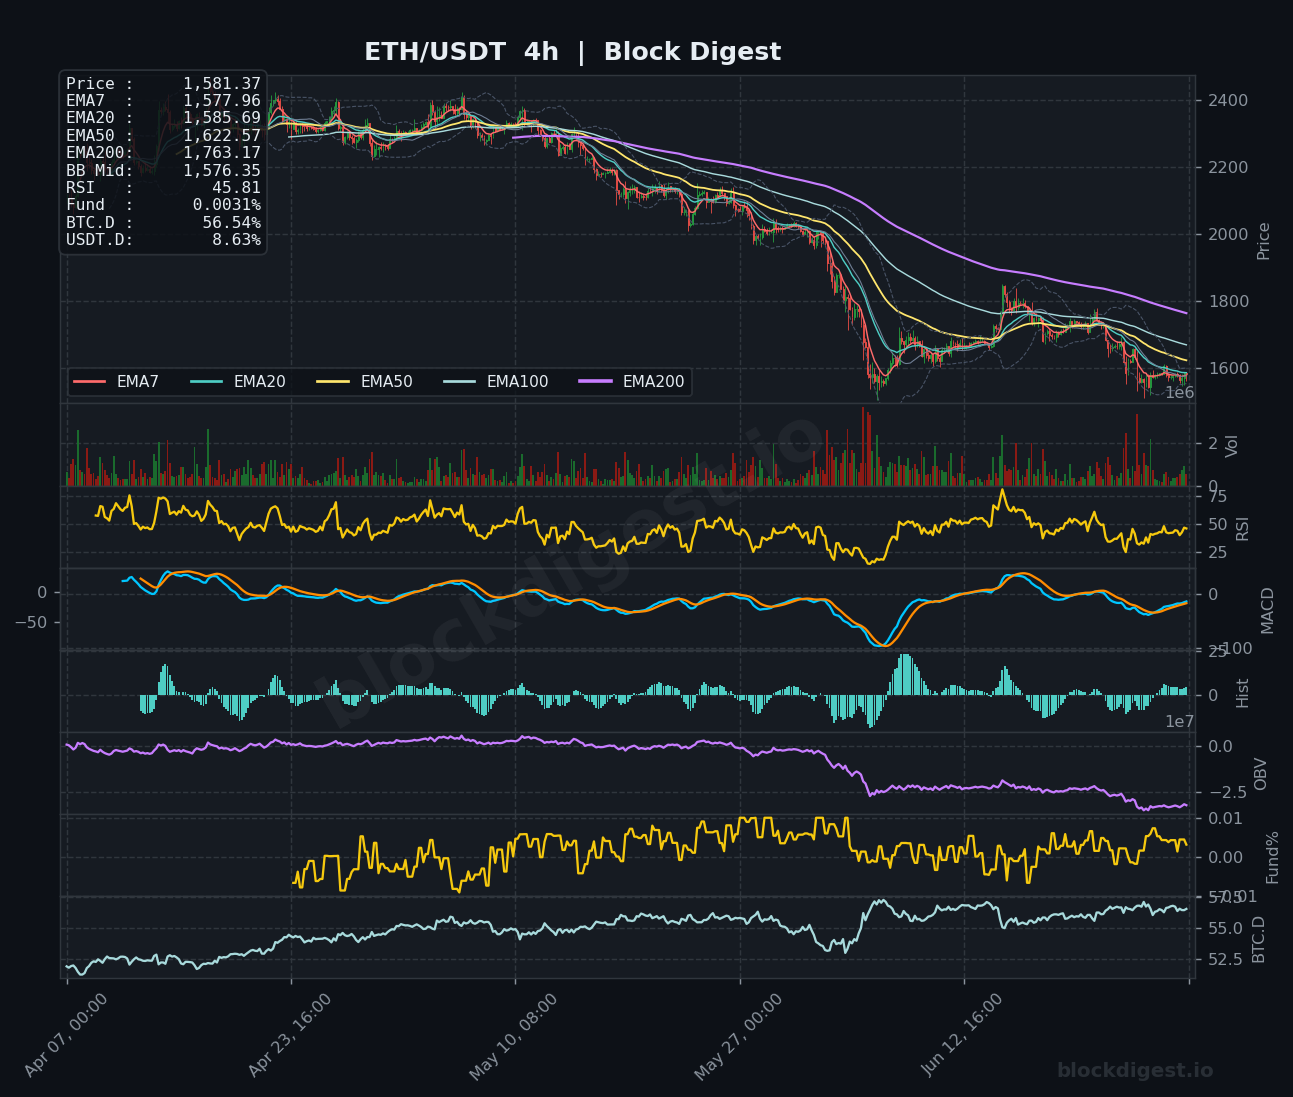
On the 1-hour chart, price at $1,581.42 is marginally above the short-term EMAs (EMA7: $1,578.59, EMA20: $1,575.68, EMA50: $1,577.50), suggesting a very modest intraday stabilization after a sharp decline. However, the 4-hour chart tells a more concerning story: price trades below its EMA7 ($1,577.96) and EMA20 ($1,585.69), with the EMA50 at $1,622.57 acting as immediate overhead resistance. All three timeframes agree on one critical point — the EMA200 looms far above (4h: $1,763.17; 1d: $2,291.94), confirming that any near-term bounce remains a counter-trend move within a larger downtrend. Short-term momentum on the 1-hour provides a tentative stabilization signal, but it is insufficient to challenge the bearish structure established on higher timeframes.
Key Levels to Watch
- Resistance: $1,622.57 — 4h EMA50, the first meaningful overhead obstacle where sellers have previously reasserted control; $1,672.67 — daily Bollinger Band midline, a key mean-reversion level that has capped prior bounces; $1,763.17 — 4h EMA200, a major macro resistance level that would need to be reclaimed to shift the medium-term bias.
- Support: $1,574.22 — 1h Bollinger Band midline, currently acting as short-term dynamic support underpinning current price action; $1,550.00 — a round-number psychological level and proximity to recent lows on the 1-hour chart; $1,500.00 — major psychological support representing a critical structural floor, the breach of which would accelerate further downside.
Momentum & On-Chain Signals
The RSI divergence across timeframes is telling: the 1-hour RSI sits at a relatively neutral 54.27, suggesting minor short-term relief, while the 4-hour RSI at 45.81 indicates continued bearish pressure without yet reaching oversold territory. Most critically, the daily RSI at 33.17 is approaching oversold conditions but has not yet triggered a confirmed reversal signal, meaning further downside cannot be dismissed. The MACD on the 4-hour remains in negative territory with the signal line only marginally recovering, while the daily MACD histogram continues to print negative bars, confirming the absence of bullish momentum on the macro scale. OBV on both the 4-hour and daily charts trends persistently downward, confirming sustained distribution rather than accumulation — a bearish divergence that warns against premature bottom-calling despite the low RSI readings.
BTC Dominance & Market Sentiment
BTC dominance stands at 56.54%, a notably elevated level that reflects capital concentration in Bitcoin at the expense of altcoins, including ETH. USDT dominance at 8.63% suggests a meaningful portion of market capital remains parked in stablecoins, indicating risk-off sentiment that broadly suppresses altcoin bids. For ETH specifically, the combination of high BTC.D and elevated USDT.D is a headwind, as a sustained ETH recovery typically requires BTC.D to retreat and stablecoin capital to rotate back into risk assets.
Risk Scenarios
- Bullish case: A reclaim of the 4h EMA20 at $1,585.69 followed by a sustained close above the 4h EMA50 at $1,622.57 would signal a potential short-term trend reversal, opening a path toward the $1,672–$1,700 range. Confirmation would require OBV to inflect upward and BTC.D to begin declining in tandem.
- Bearish case: A failure to hold the $1,574 Bollinger Band midline on the 1-hour and a break below the $1,550 support zone would likely accelerate selling toward the $1,500 psychological level. A daily close below $1,500 would represent a significant structural breakdown with limited nearby support until the $1,400–$1,420 area.
Outlook
The overall bias remains cautiously bearish as of June 29, 2026, with ETH trading in a structurally damaged condition across all major timeframes. The 24–48 hour setup hinges on whether price can sustain a hold above $1,574–$1,578 and build momentum to challenge the $1,622 resistance cluster; failure at this level would confirm continued distribution. The daily RSI approaching 33 introduces a potential oversold bounce scenario, but the persistent OBV downtrend and macro EMA bearish stack suggest any relief rally should be treated with skepticism unless accompanied by a clear shift in volume dynamics. Traders should monitor BTC.D closely — a decisive drop below 55% would materially improve the probability of an ETH recovery, while a further rise toward 58% would sustain downside pressure.
Disclaimer: This analysis is for informational purposes only and does not constitute financial advice. Cryptocurrency markets are highly volatile and unpredictable. All trading decisions should be made based on your own research and risk tolerance. Block Digest is not responsible for any financial losses incurred as a result of acting on this content.
Stay Ahead of the Market
Follow BlockDigest for crypto market intelligence, research and real-time updates.


