
Market Overview
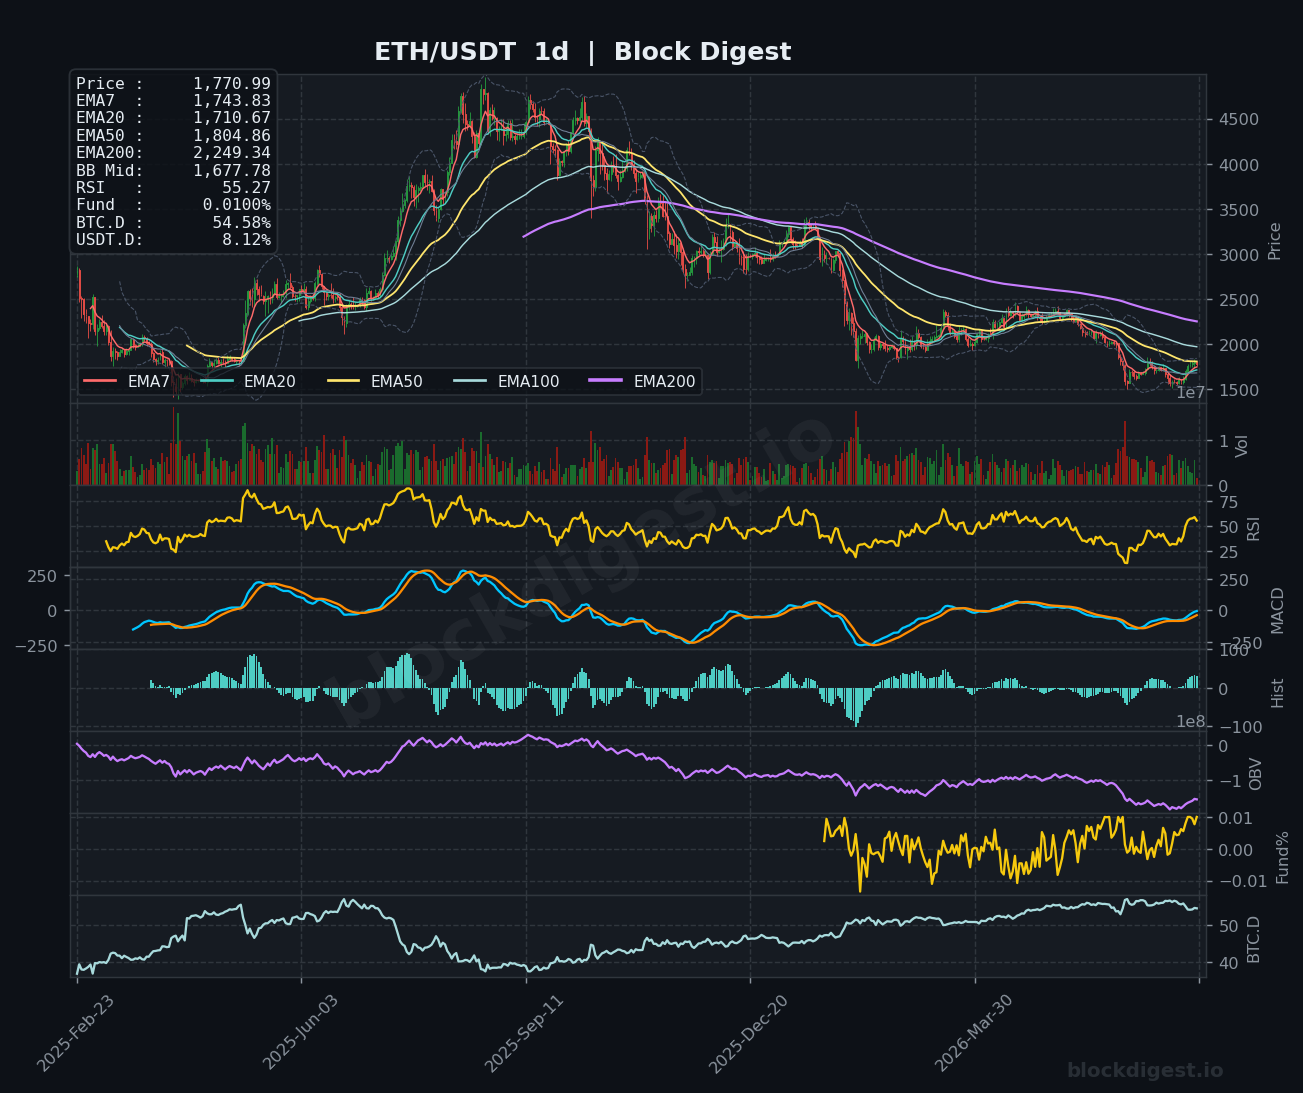
Ethereum is currently trading at approximately $1,771–$1,773, consolidating just below the psychologically significant $1,800 level after a sharp recovery from lows near $1,550 seen in late June. On the daily timeframe, price remains well beneath the declining EMA200 ($2,249) and EMA50 ($1,804), confirming the dominant macro trend is still bearish — ETH has been in a prolonged downtrend since the 2025 highs above $4,000. However, the daily Bollinger Band midline sits at $1,677.78, and price is now trading comfortably above it, suggesting short-term recovery momentum is intact. The EMA7 ($1,743) and EMA20 ($1,710) on the daily have begun curling upward, hinting at a potential near-term structural shift worth monitoring closely.
Multi-Timeframe Confluence
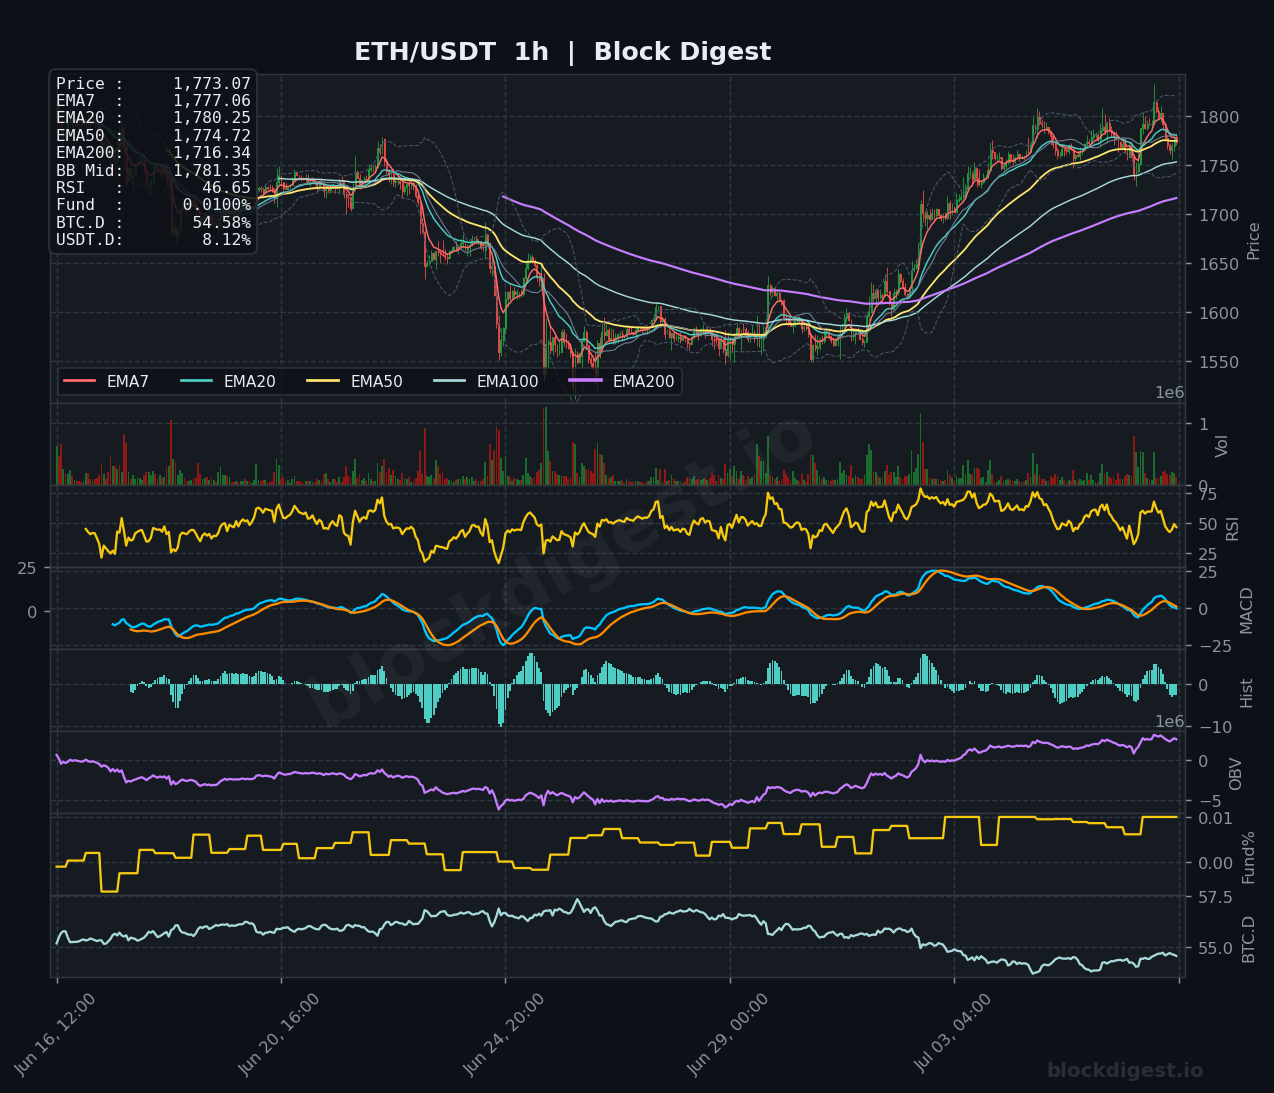
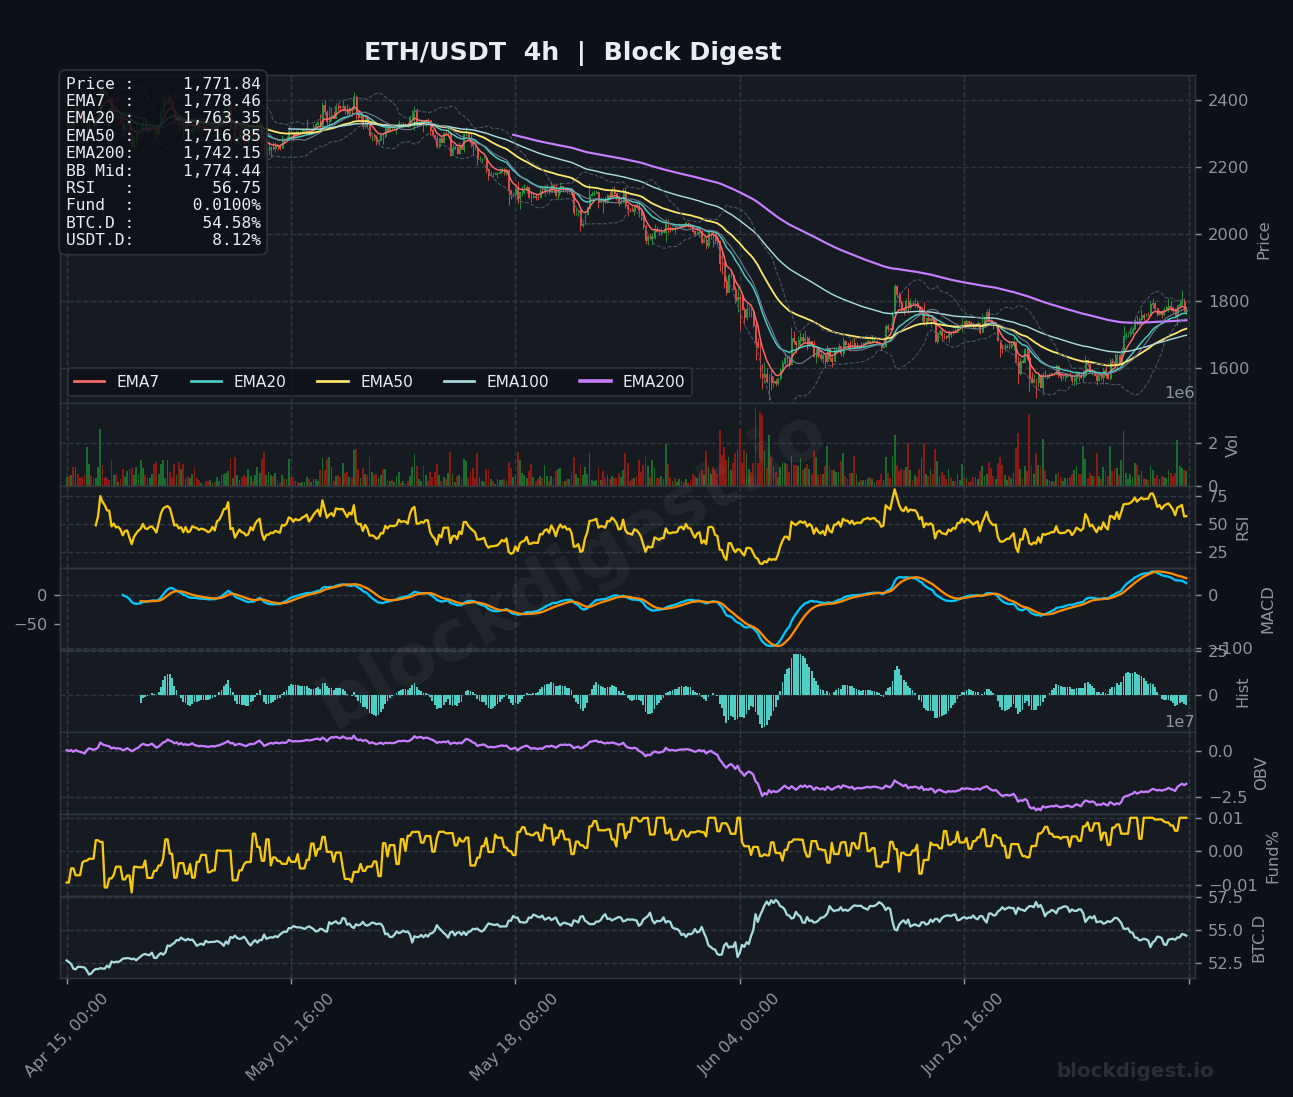
On the 1-hour chart, ETH is trading below its BB midline ($1,781) and all short-term EMAs are tightly clustered between $1,774–$1,780, with price at $1,773 sitting marginally below this cluster — a minor bearish signal in the short term. The 4-hour chart is more constructive: RSI sits at 56.75, price recently reclaimed its EMA20 ($1,763) and EMA50 ($1,716), and the MACD signal lines have crossed back above zero, confirming the recovery from the June lows. However, on the daily, price is still approaching the overhead EMA50 resistance at $1,804, where sellers are likely to reassert pressure. The convergence of the 4H and 1H EMAs around $1,763–$1,780 forms a near-term support cluster, while the $1,800–$1,804 zone acts as the critical multi-timeframe decision level.
Key Levels to Watch
- Resistance: $1,800–$1,804 — confluence of the daily EMA50 ($1,804) and the round-number psychological level; reclaiming this on a daily close would be a significant structural shift. $1,850 — the upper boundary cited by market participants as the next meaningful resistance zone and a recent swing high area. $2,249 — the daily EMA200, representing the macro downtrend ceiling and a level ETH has not traded near since late 2025.
- Support: $1,763–$1,774 — the 4H EMA20/EMA50 cluster and 1H EMA50, forming the immediate short-term floor. $1,716 — the 4H EMA200, which provided strong support during the recent recovery and would be critical to hold on any pullback. $1,677 — the daily Bollinger Band midline; a breach here on a closing basis would neutralize the short-term recovery thesis.
Momentum & On-Chain Signals
The 1-hour RSI at 46.65 is drifting toward the neutral zone from above, consistent with near-term consolidation or mild bearish pressure following the recent push toward $1,800. The 4-hour MACD lines have crossed above zero with a mildly positive histogram, while the daily MACD, though still negative in absolute terms, is showing a constructive narrowing of the gap between signal lines — a potential bullish crossover developing over the coming sessions. On the 1-hour OBV, there is a notable uptick in accumulation following the recovery from late June lows, and this trend is mirrored on the 4-hour chart, suggesting institutional buying interest is gradually returning. The funding rate across all timeframes holds steady at 0.01%, indicating a neutral-to-slightly-long market with no extreme leverage positioning — a healthy backdrop for further measured upside if catalysts emerge, consistent with BitMine’s ongoing ETH accumulation strategy.
BTC Dominance & Market Sentiment
BTC dominance currently reads 54.58% — elevated but showing signs of a measured pullback from recent highs above 57% visible on the 4-hour chart, which historically correlates with capital beginning to rotate into altcoins, including ETH. USDT dominance at 8.12% remains relatively high, indicating that a meaningful portion of capital is still sitting on the sidelines and has not fully rotated into risk assets. If BTC.D continues declining while USDT.D compresses, ETH could be a primary beneficiary, particularly given the positive fundamental backdrop around the “Lean Ethereum” roadmap and Vitalik’s recently announced major network rebuild.
Risk Scenarios
- Bullish case: A confirmed daily close above $1,804 (the daily EMA50) with sustained volume would signal a meaningful trend shift, opening a path toward the $1,850 resistance and potentially $1,950 on continuation. Declining BTC dominance alongside BitMine’s institutional accumulation amplifying retail momentum could accelerate this move.
- Bearish case: Failure to hold the $1,763–$1,774 support cluster on a 4-hour closing basis, combined with a renewed BTC.D surge toward 56–57%, would likely drag ETH back toward the $1,716 EMA200 (4H) and risk a retest of the $1,650–$1,600 zone. A rejection at the daily EMA50 ($1,804) that produces a clear bearish engulfing candle on the daily chart would be the clearest invalidation signal.
Outlook
ETH sits at a technically critical juncture heading into July 7: the recovery from late June’s $1,550 lows has been impressive, but the asset now faces the decisive test of the daily EMA50 at $1,804, a level that has capped price during multiple recovery attempts. The 4-hour structure is constructive with RSI above 50 and MACD positive, but the 1-hour is beginning to show consolidation fatigue below the $1,780 EMA cluster. A break and daily close above $1,804–$1,815 would represent a meaningful bullish shift, while rejection from this zone could see a healthy pullback to the $1,716–$1,763 support band before the next leg higher is attempted. The macro daily trend remains bearish until ETH recaptures the EMA200 at $2,249 — but near-term, the risk/reward for cautious bulls appears asymmetric, particularly if broader market rotation away from BTC dominance accelerates.
Disclaimer: This analysis is for informational purposes only and does not constitute financial advice. Cryptocurrency markets are highly volatile and unpredictable. All trading decisions should be made based on your own research and risk tolerance. Block Digest is not responsible for any financial losses incurred as a result of acting on this content.
Stay Ahead of the Market
Follow BlockDigest for crypto market intelligence, research and real-time updates.


