
Market Overview
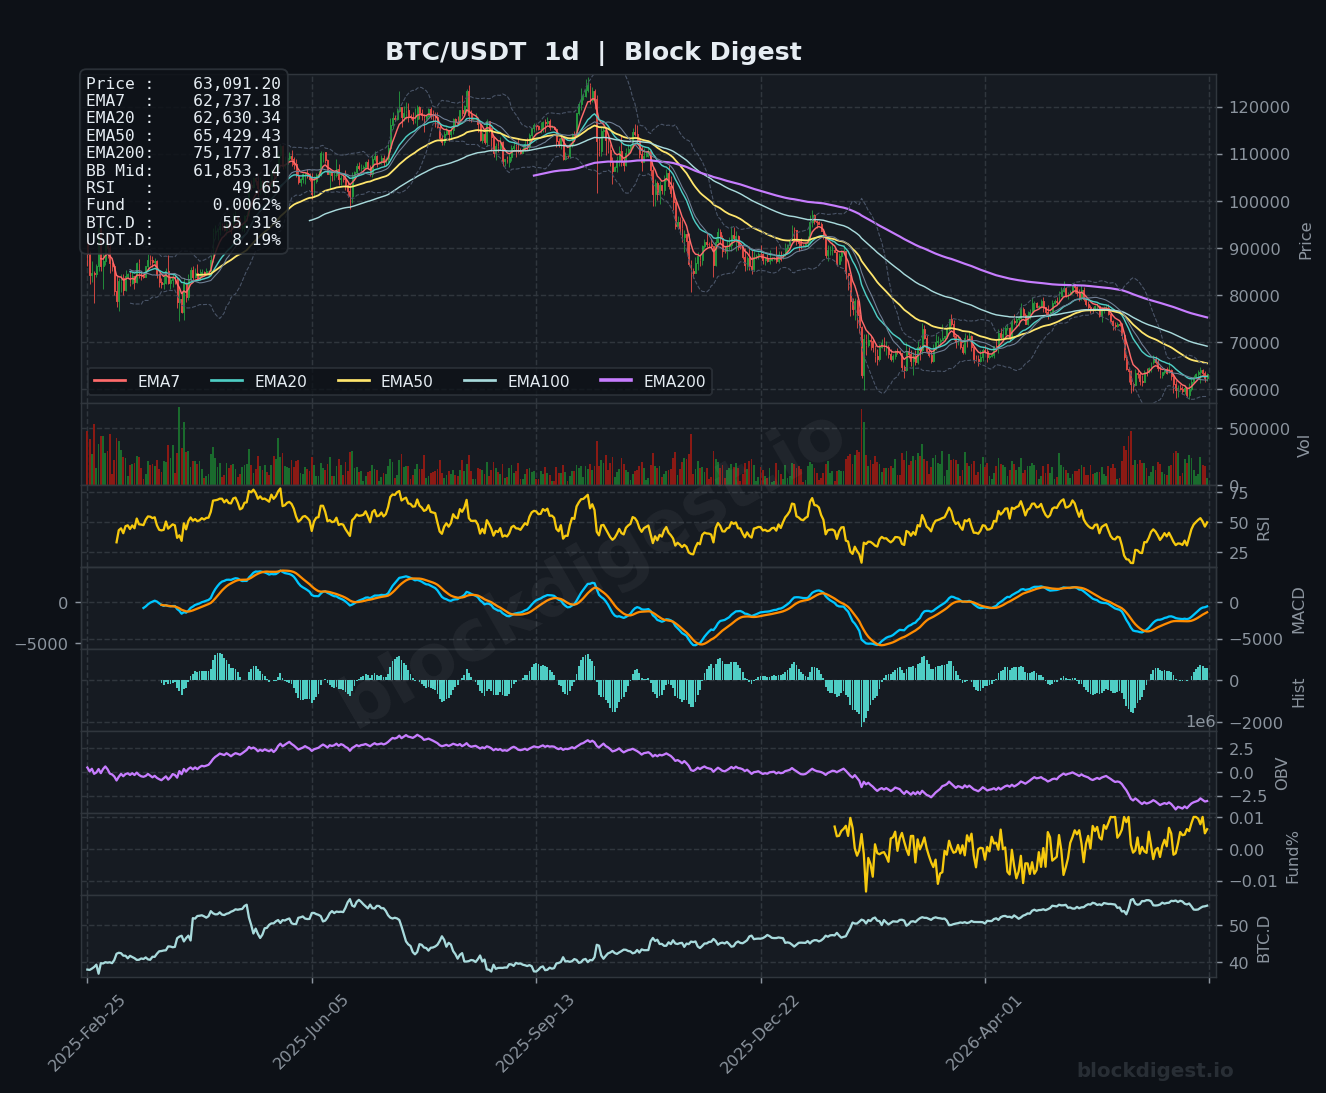
Bitcoin is currently trading at approximately $63,091–$63,097 across timeframes, sitting in a structurally precarious position roughly 50% below its all-time high of $126,210 set in October 2025. On the daily chart, price remains firmly below the EMA50 ($65,429) and EMA200 ($75,177), with the entire short-to-medium-term EMA stack in bearish alignment — a clear indicator that the macro downtrend originating from the October peak remains intact. Price has, however, recovered above the daily EMA7 ($62,737) and EMA20 ($62,630), suggesting a nascent short-term recovery attempt is underway. The Bollinger Band midline on the daily sits at $61,853, and current price trading above this level provides marginal bullish context in the immediate term.
Multi-Timeframe Confluence
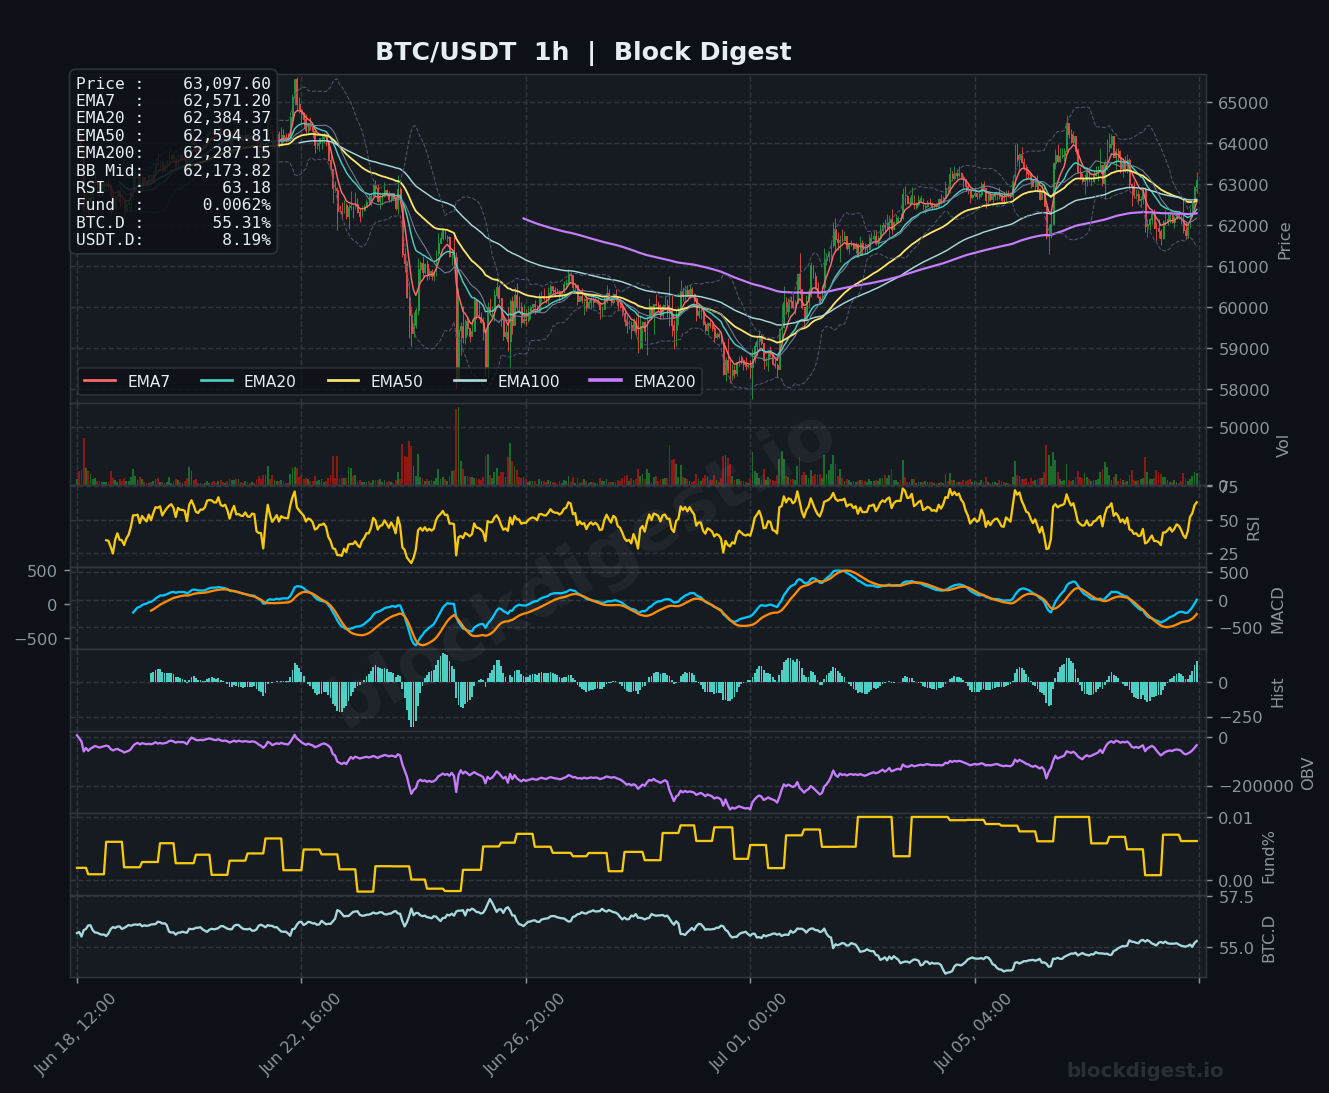
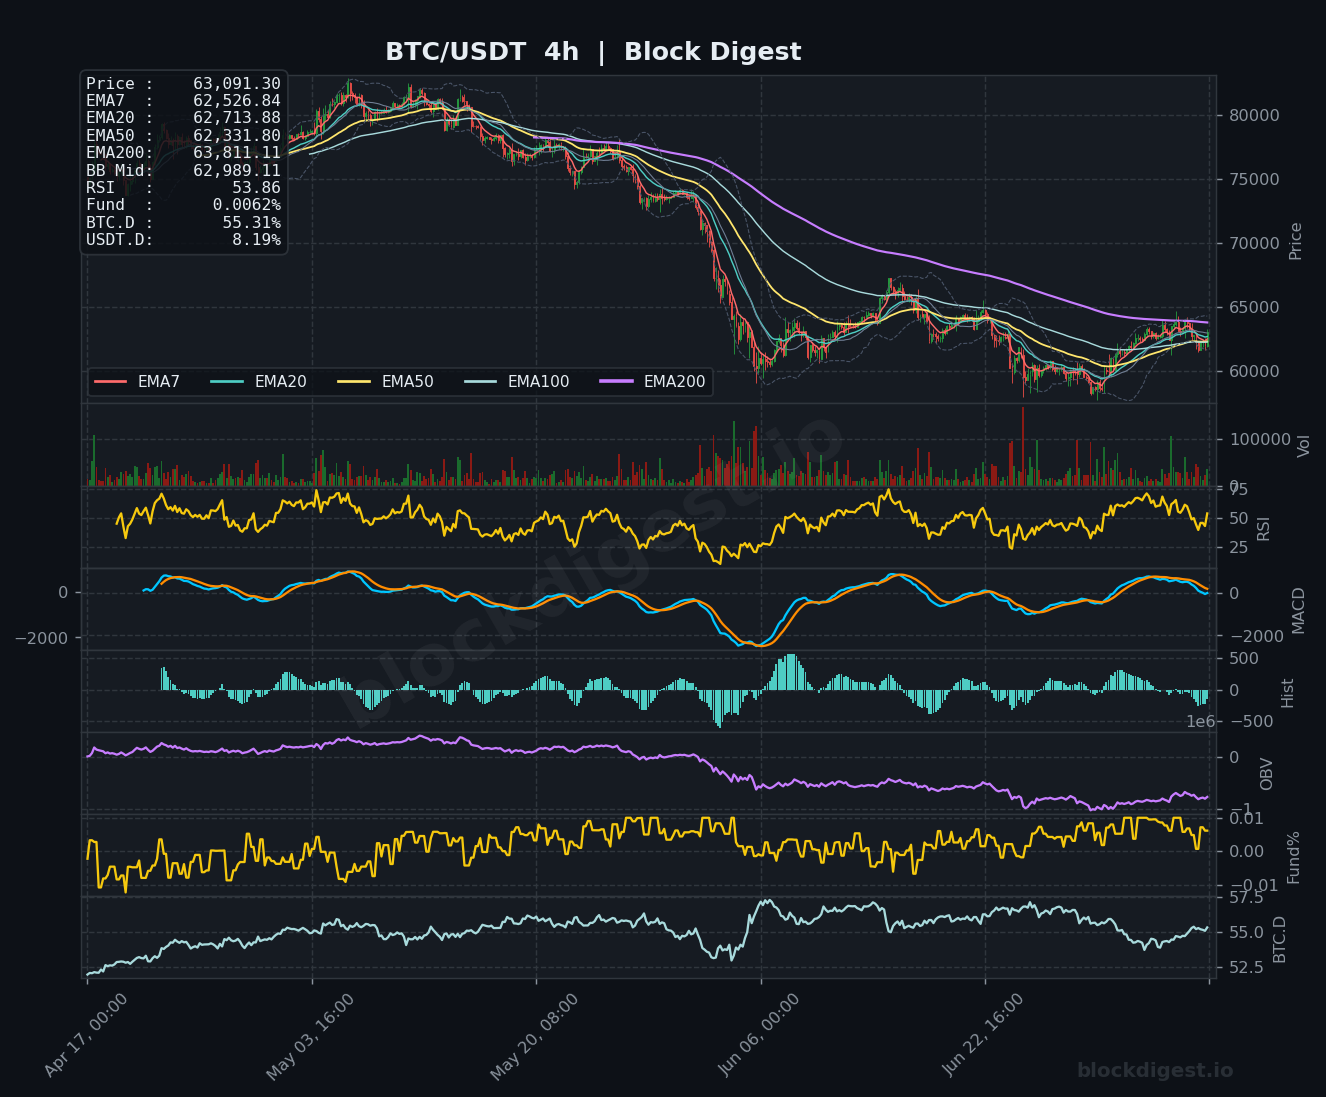
On the 1-hour chart, price at $63,097 is trading above all short-term EMAs (EMA7: $62,571; EMA20: $62,384; EMA50: $62,594; EMA200: $62,287), indicating short-term bullish structure. The 4-hour chart tells a more cautious story — price at $63,091 is above EMA7 ($62,526), EMA20 ($62,713), and EMA50 ($62,331), but critically remains below the EMA200 at $63,811, which acts as an immediate overhead resistance cluster. The daily confirms the bearish higher-timeframe bias, with the EMA50 at $65,429 and EMA200 at $75,177 both looming far above current price as formidable resistance. The short-term EMAs across 1h and 4h are supportive, but this recovery appears corrective within a larger downtrend rather than a confirmed trend reversal.
Key Levels to Watch
- Resistance: $63,811 — 4h EMA200, the most immediate overhead barrier that has capped recent recovery attempts; $65,429 — daily EMA50, a major structural resistance that would need to be reclaimed to shift medium-term bias; $67,000–$68,000 — prior consolidation zone visible on the 4h chart, where heavy supply was distributed during the broader decline.
- Support: $62,173–$62,384 — confluence of 1h BB midline and EMA20, first line of defense on any near-term pullback; $61,853 — daily Bollinger Band midline, a key dynamic support that bulls must defend to maintain the current recovery; $59,500–$60,000 — recent swing lows on the 4h chart, representing the last meaningful structural support before a retest of deeper levels near $58,000.
Momentum & On-Chain Signals
The RSI readings tell a diverging story across timeframes: the 1h RSI sits at 63.18 (mildly bullish momentum), the 4h RSI is at 53.86 (neutral, just above equilibrium), while the daily RSI at 49.65 remains below the 50 midline — technically in bearish territory and consistent with the macro downtrend. The 4h MACD lines are converging near zero with a slightly negative histogram, suggesting momentum is stalling without a decisive directional catalyst. The OBV on both the 1h and 4h charts continues to trend lower from prior highs, indicating persistent distribution pressure that contradicts the modest price recovery — a concerning divergence. Funding rates at 0.0062% are marginally positive but essentially neutral, reflecting an absence of excessive long-side leverage.
BTC Dominance & Market Sentiment
BTC Dominance at 55.31% remains elevated and has been trending higher over the observed period on the daily BTC.D panel, suggesting capital continues to rotate into Bitcoin relative to altcoins rather than broadly into the crypto market — a risk-off posture within the digital asset space. USDT.D at 8.19% indicates a non-trivial portion of market participants remain in stablecoins, reflecting cautious sentiment and dry powder on the sidelines. This combination — high BTC.D with elevated USDT.D — typically signals a market that is consolidating defensively rather than entering an expansive risk-on phase.
Risk Scenarios
- Bullish case: A sustained hourly close above the 4h EMA200 at $63,811, followed by a retest and hold of that level as support, would validate a short-term trend shift targeting the $65,429 daily EMA50. A confirmed break above $65,429 on volume could open a path toward the $67,000–$68,000 supply zone.
- Bearish case: Failure to hold the $62,173–$62,384 support cluster on the 1h timeframe, particularly on elevated volume, would signal distribution is resuming and risk a retest of $61,853 daily BB midline. A daily close below $60,000 would invalidate the current recovery structure entirely and expose the $58,000–$59,000 zone.
Outlook
The near-term directional bias is cautiously neutral-to-bearish, with price trapped in a low-conviction bounce inside a dominant macro downtrend. The critical trigger to watch over the next 24–48 hours is whether BTC can reclaim and sustain above the 4h EMA200 at $63,811 — failure at this level would likely confirm the current recovery as a relief rally rather than a reversal. The OBV divergence and daily RSI below 50 are the two most concerning signals warranting defensive positioning. Until the daily EMA50 at $65,429 is reclaimed on a closing basis, any upside should be treated as a corrective move within the broader bear structure.
Disclaimer: This analysis is for informational purposes only and does not constitute financial advice. Cryptocurrency markets are highly volatile and unpredictable. All trading decisions should be made based on your own research and risk tolerance. Block Digest is not responsible for any financial losses incurred as a result of acting on this content.
Stay Ahead of the Market
Follow BlockDigest for crypto market intelligence, research and real-time updates.


