
Market Overview
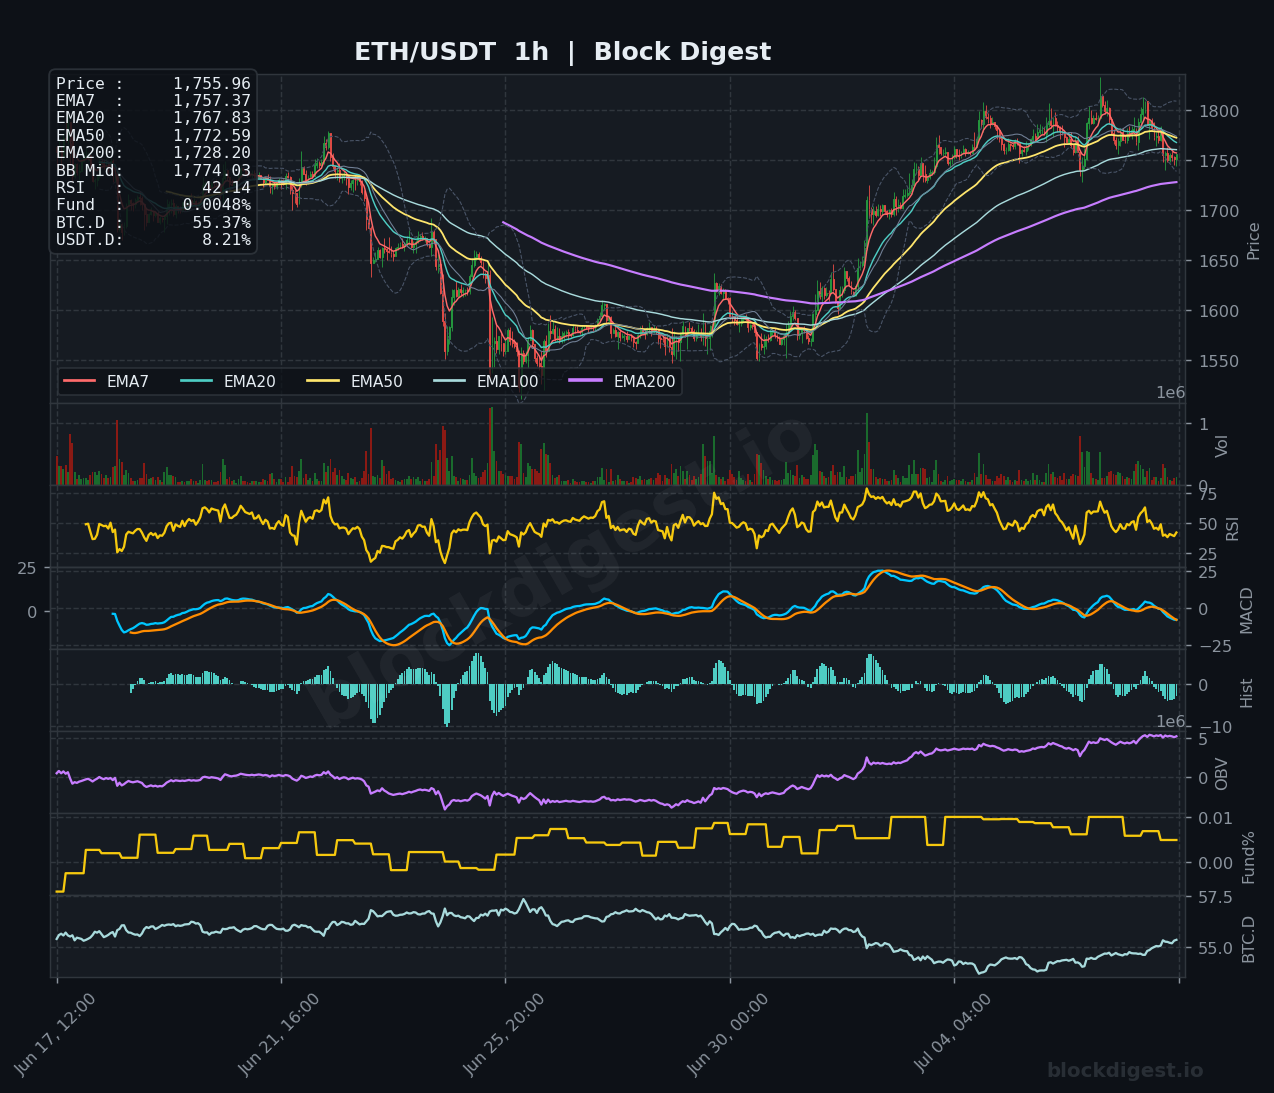
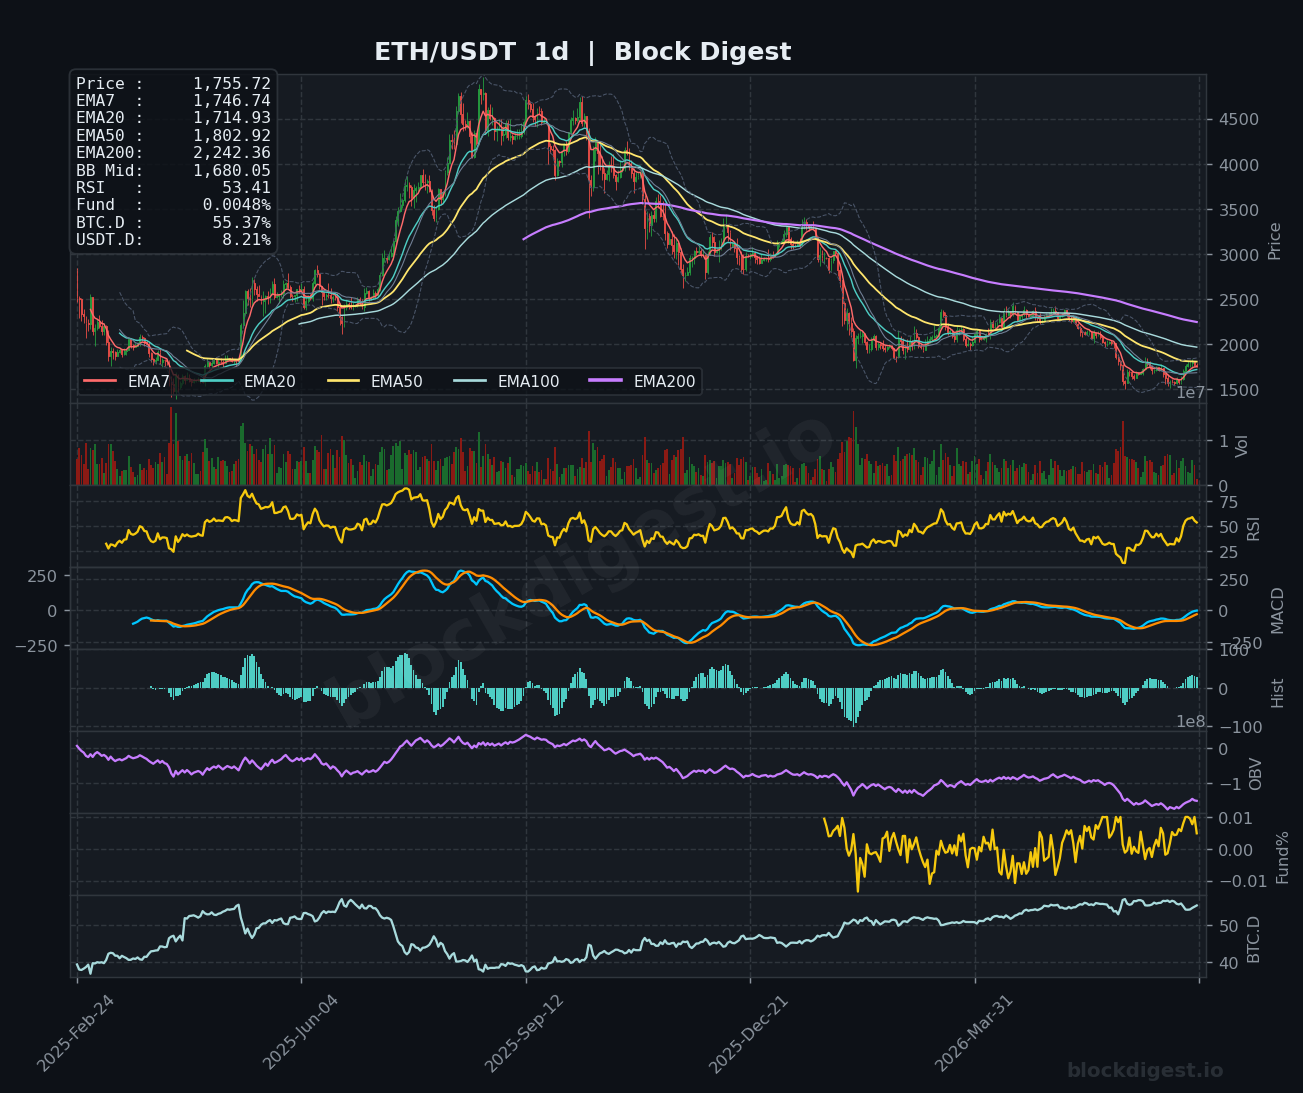
ETH/USDT is trading at approximately $1,755.96 as of July 8, 2026, sitting beneath a cluster of short-term resistance formed by the EMA7 ($1,757.37), EMA20 ($1,767.83), and EMA50 ($1,772.59) on the 1-hour chart — a bearish EMA stack that reflects fading near-term momentum following a notable recovery from the mid-$1,500s. On the daily timeframe, price remains structurally bearish, trading well below the EMA50 ($1,802.92) and the heavily descending EMA200 ($2,242.36), confirming a dominant downtrend that has been in place since the 2025 highs above $4,000. The daily Bollinger Band midline sits at $1,680.05, and price is currently pressing against the upper band region, suggesting the recent bounce may be approaching an exhaustion zone without a meaningful catalyst to sustain it.
Multi-Timeframe Confluence
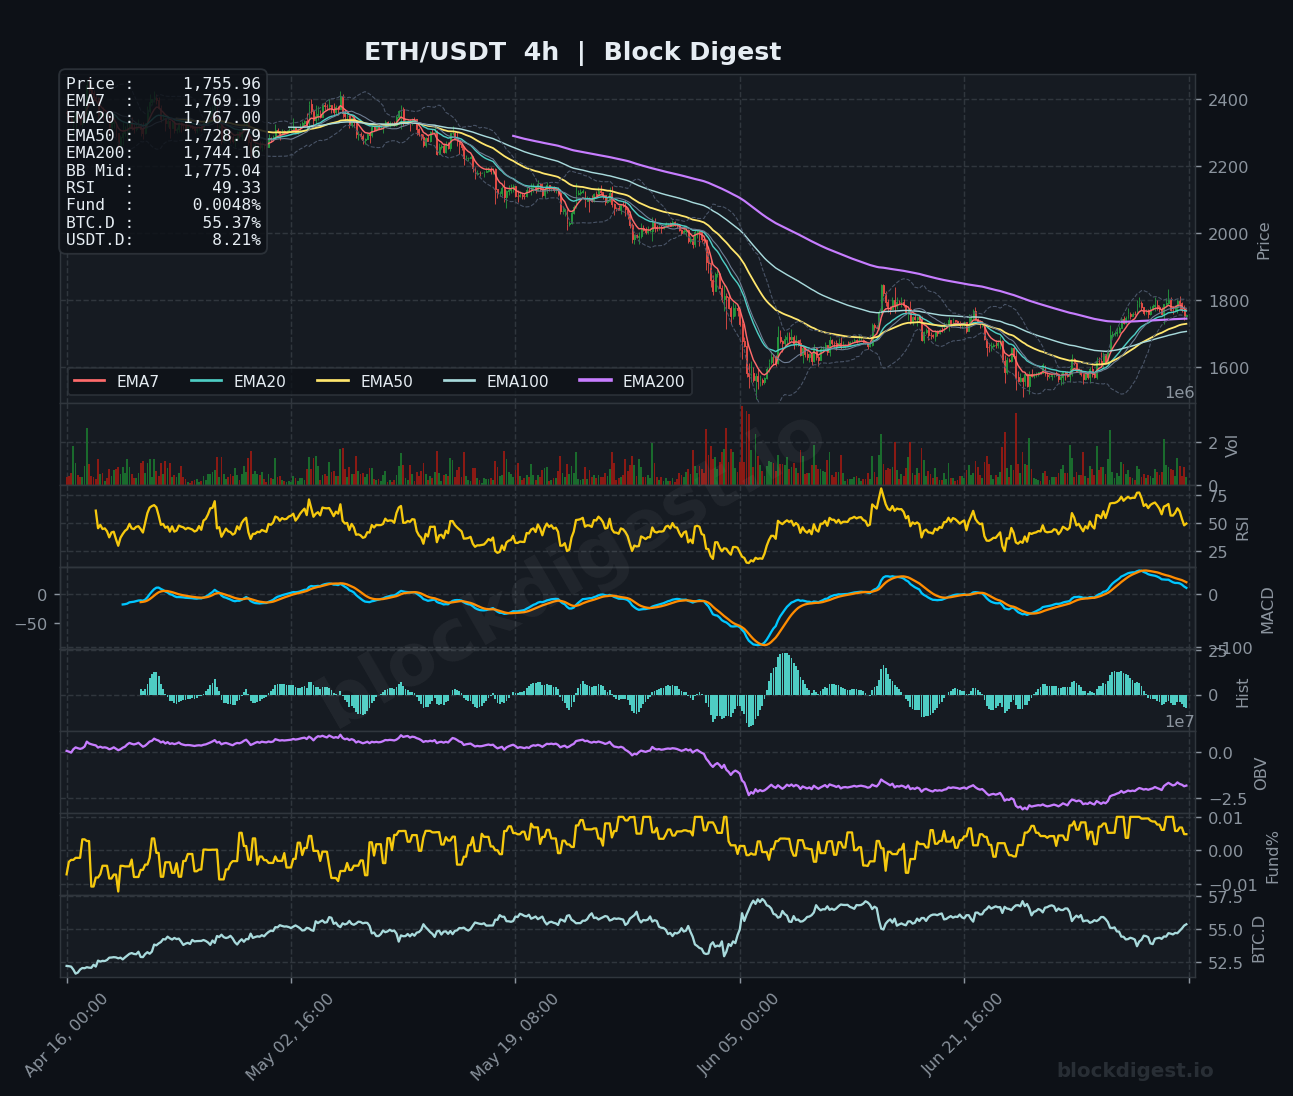
Across all three timeframes, the broader structure remains bearish, with the recovery from recent lows looking increasingly like a corrective bounce rather than a trend reversal. On the 4-hour chart, price has reclaimed the EMA7 ($1,769.19), EMA20 ($1,767.00), and EMA50 ($1,728.79), which is constructive in isolation, but the EMA200 at $1,744.16 on the same timeframe has only recently been crossed, and the cluster of EMAs between $1,755 and $1,775 represents a dense overhead resistance zone. The 1-hour RSI at 42.14 is drifting into bearish territory, diverging from the 4-hour RSI at 49.33 and the daily RSI at 53.41 — suggesting that short-term selling pressure is currently outpacing the intermediate and longer-term recovery signal. This multi-timeframe divergence in momentum points to consolidation at best, with downside risk if the $1,750 level fails to hold.
Key Levels to Watch
- Resistance: $1,775–$1,780 — confluent zone of the 1-hour BB midline ($1,774.03), 4-hour BB midline ($1,775.04), and the recent swing high near $1,800; this area has repeatedly capped price.
- Resistance: $1,800–$1,810 — the daily EMA50 at $1,802.92 aligns with the psychologically significant $1,800 round number and the recent local high; reclaiming this level would be a meaningful structural shift.
- Resistance: $1,840–$1,860 — a broader supply zone from prior consolidation structure; bulls would need sustained volume to break through this region.
- Support: $1,728–$1,730 — the 4-hour EMA50 ($1,728.79) and the 1-hour EMA200 ($1,728.20) converge here, forming a key near-term floor.
- Support: $1,680 — the daily Bollinger Band midline; a break below this level would signal reversion toward the lower band and a continuation of the macro downtrend.
- Support: $1,540–$1,560 — the recent structural low and demand zone where price found significant buying interest; losing this would open the door to multi-year lows.
Momentum & On-Chain Signals
The 1-hour RSI at 42.14 is trending lower and approaching oversold territory, while the 4-hour RSI at 49.33 sits near the neutral midpoint — neither confirming bullish continuation nor signaling an imminent breakdown. The daily MACD shows a tentative bullish crossover in progress, with the histogram producing small positive bars, but the signal remains fragile and early-stage. OBV on the 1-hour chart has been rising consistently since the mid-June lows, indicating underlying accumulation pressure, but the 4-hour OBV remains in negative territory from the broader sell-off, highlighting that the recovery has not yet restored meaningful institutional buying conviction. The funding rate at 0.0048% is mildly positive, reflecting slight long bias in perpetuals — not overheated, but any sudden sentiment shift could trigger cascade liquidations.
BTC Dominance & Market Sentiment
BTC dominance sits at 55.37%, a notable reading that continues to reflect capital rotation favoring Bitcoin over altcoins — a headwind for ETH specifically, as market participants appear reluctant to take on the additional risk profile that Ethereum carries in the current macro environment. USDT dominance at 8.21% suggests a meaningful portion of market capital remains sidelined in stablecoins, consistent with the broader Fear sentiment reading and reinforcing the narrative that a significant rotation back into ETH is not yet underway. Until BTC.D shows a clear reversal lower, ETH is likely to remain under relative pressure and struggle to outperform Bitcoin.
Risk Scenarios
- Bullish case: A reclaim and daily close above $1,800 — specifically above the daily EMA50 at $1,802.92 — accompanied by a sustained uptick in 4-hour OBV and RSI holding above 55 on the daily, would suggest the recovery has legs, with initial targets toward $1,860 and potentially $2,000 over the following days. Continued ETF inflows into Bitcoin and a broader macro risk-on signal would be the catalysts needed to drive this scenario.
- Bearish case: A failure to hold $1,728 on a 4-hour closing basis, combined with a daily RSI rollover below 50, would suggest the corrective bounce has concluded and the macro downtrend is resuming — targeting a retest of the $1,540–$1,560 support zone, with a break below that opening the path to deeper lows.
Outlook
ETH/USDT is at a technically critical juncture on July 8, 2026 — the recent six-session recovery has stalled just beneath a dense EMA resistance cluster between $1,757 and $1,775, and the 1-hour momentum indicators are deteriorating in real time. The directional bias leans cautiously bearish in the near term, given the fading short-term RSI, the still-dominant macro downtrend on the daily, and BTC dominance remaining elevated. Key triggers to watch in the next 24–48 hours include whether ETH can reclaim $1,775 on a sustained hourly basis or whether the $1,728–$1,730 EMA confluence gives way, which would shift the probability sharply toward a retest of lower support. The thesis would change materially on a confirmed daily close above $1,802, which would represent the first meaningful recapture of a major daily EMA and signal a potential structural shift.
Disclaimer: This analysis is for informational purposes only and does not constitute financial advice. Cryptocurrency markets are highly volatile and unpredictable. All trading decisions should be made based on your own research and risk tolerance. Block Digest is not responsible for any financial losses incurred as a result of acting on this content.
Stay Ahead of the Market
Follow BlockDigest for crypto market intelligence, research and real-time updates.


