
Market Overview
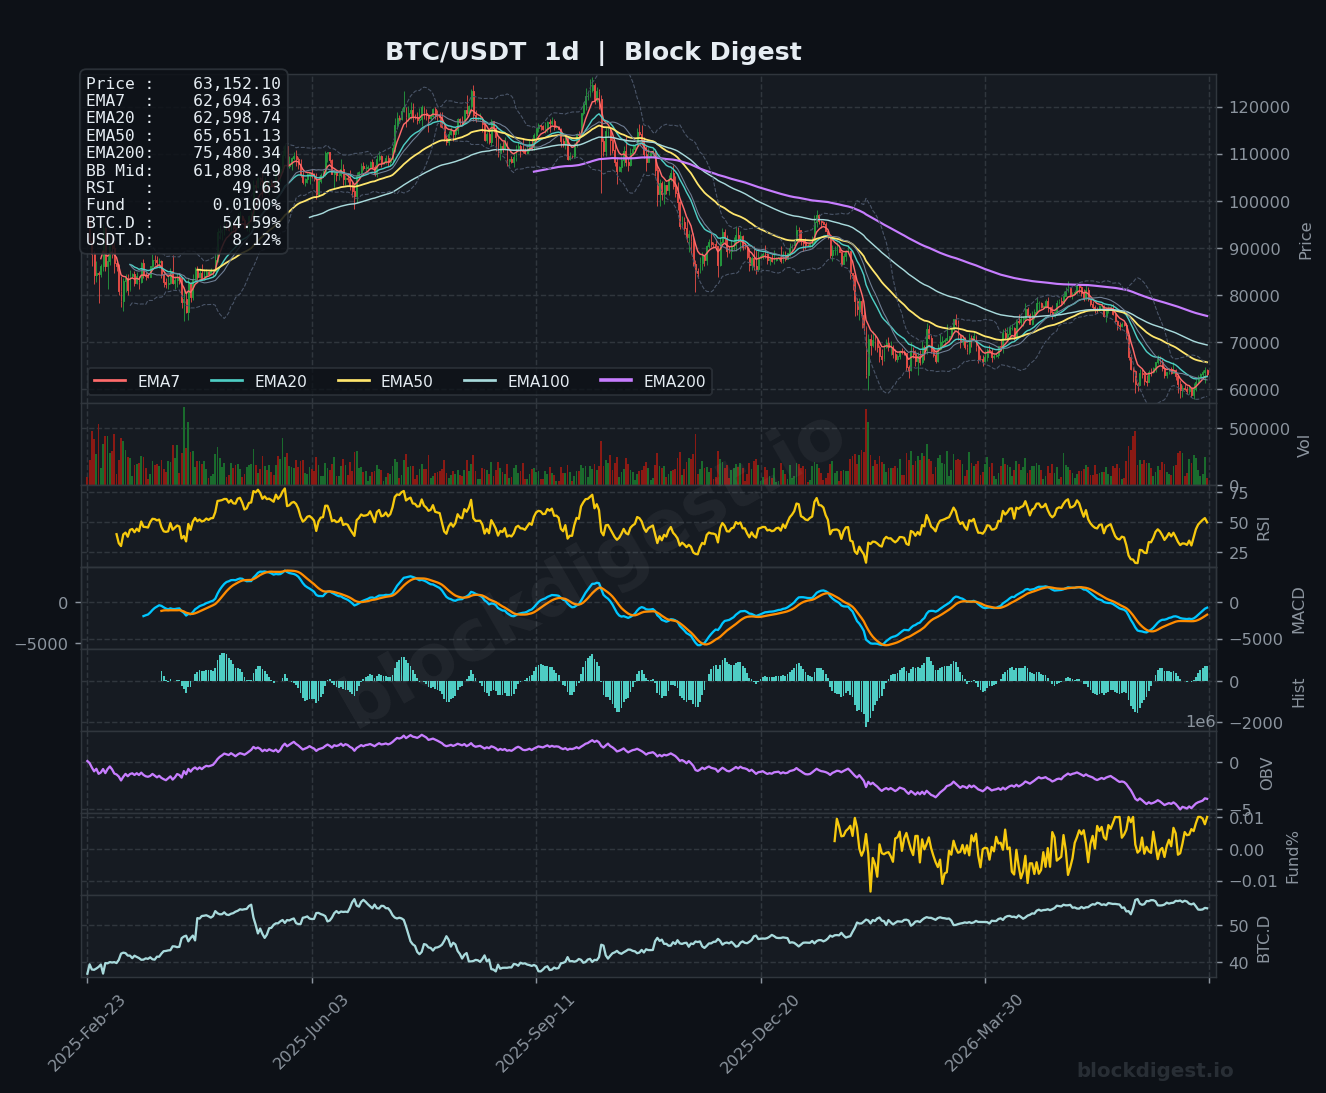
Bitcoin is trading at $63,152.10 as of July 7, 2026, attempting a fragile recovery after hitting a 21-month low just days prior. On the daily timeframe, the dominant structure remains deeply bearish — price sits well below the EMA200 at $75,480.34 and the EMA50 at $65,651.13, confirming the macro downtrend that has been in place since late 2025. The daily Bollinger Band midline at $61,898.49 sits below current price, suggesting the recent bounce has pushed BTC into the upper half of the daily band, but this alone does not confirm a trend reversal. The overall market structure continues to print lower highs and lower lows on the higher timeframe, warranting caution despite the short-term recovery.
Multi-Timeframe Confluence
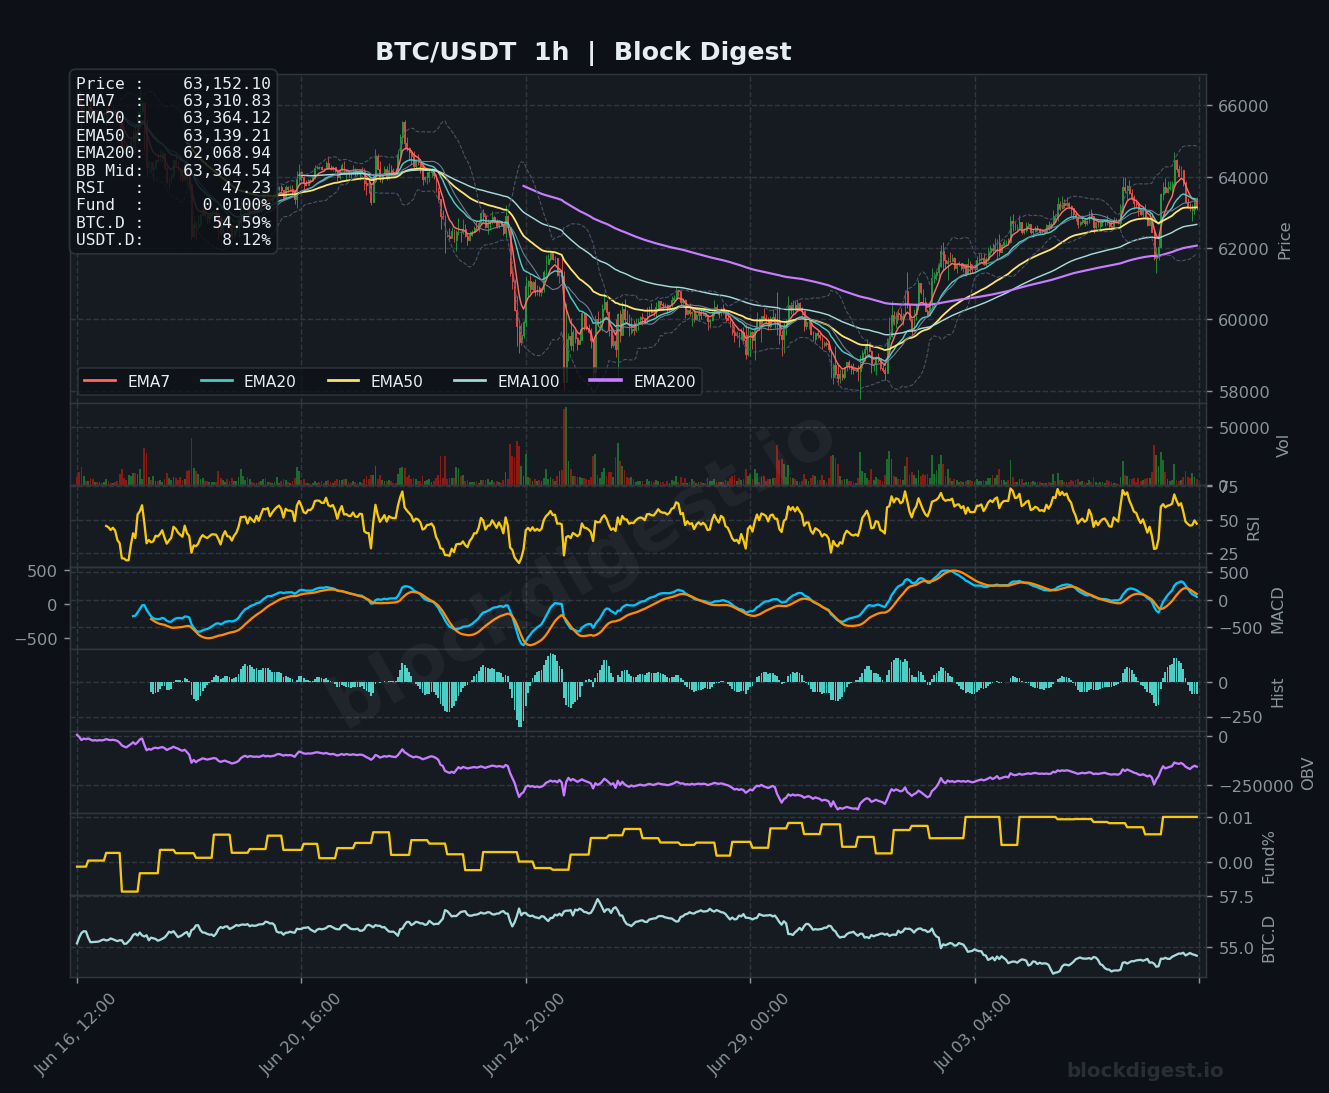
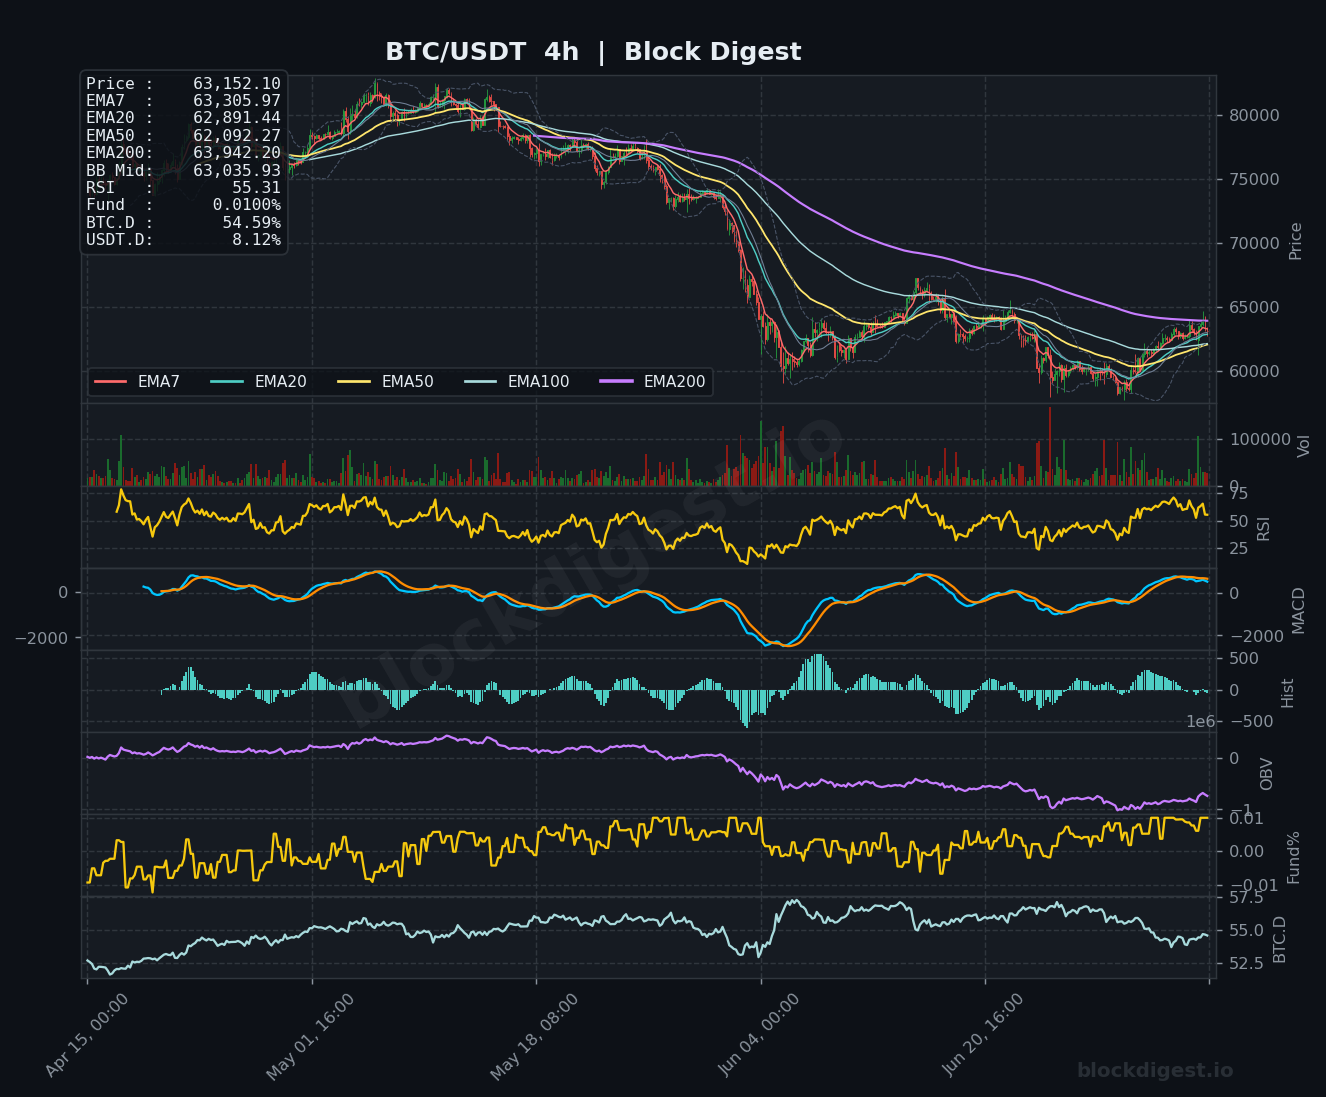
On the 1-hour chart, price at $63,152.10 is trading in a tight cluster just below the EMA7 ($63,310.83), EMA20 ($63,364.12), and EMA50 ($63,139.21) — all compressed within a narrow ~$225 range, signaling a momentum decision point is imminent. The 4-hour chart shows price has reclaimed the EMA7 ($63,305.97) and EMA20 ($62,891.44) but remains contested below the EMA200 ($63,942.20), which acts as a key overhead resistance. The daily chart’s EMA7 ($62,694.63) and EMA20 ($62,598.74) are both now below price — a modest near-term positive — but the EMA50 at $65,651.13 represents a significant ceiling that would need to be cleared to shift the intermediate bias. Short-term momentum is tentatively supportive, but it diverges meaningfully from the deeply bearish higher-timeframe structure.
Key Levels to Watch
- Resistance: $63,942 — 4h EMA200, the most critical near-term overhead level; a clean close above here would mark the first structural reclaim in weeks
- Resistance: $65,651 — Daily EMA50, the defining intermediate barrier; rejection here would reaffirm the macro downtrend
- Resistance: $66,000–$67,000 — Prior consolidation zone and psychological round number from the recent breakdown; likely to attract significant selling pressure
- Support: $62,068–$62,598 — Cluster of 1h EMA200 ($62,068.94) and daily EMA7/EMA20 ($62,694/$62,598); first line of defense on any near-term pullback
- Support: $61,898 — Daily Bollinger Band midline; a breakdown below this level would shift near-term momentum back to bears
- Support: $59,500–$60,000 — The recent multi-month low zone; a retest of this area would represent a critical test of the broader bottom thesis
Momentum & On-Chain Signals
The 1-hour RSI at 47.23 is neutral-to-soft, unable to sustain a push above 50, reflecting the indecision at current levels. The 4-hour RSI at 55.31 is more encouraging, suggesting the intermediate bounce still has some room before reaching overbought conditions. The daily RSI at 49.63 hovers just below the midline — a level that has historically acted as resistance during bear market relief rallies. On the 4h MACD, the signal lines appear to be crossing bullishly near zero, while the histogram has turned positive — a constructive near-term signal. However, the daily OBV continues to slope downward, indicating persistent net distribution at the macro level, and the 1h OBV, while recovering from its trough, has not yet confirmed accumulation. Funding rates at a neutral 0.0100% across timeframes suggest the market is not overleveraged in either direction.
BTC Dominance & Market Sentiment
BTC.D sits at 54.59%, having declined from highs above 57% visible on the daily chart, suggesting some modest rotation from Bitcoin into altcoins — though this remains within a generally risk-averse environment. USDT.D at 8.12% remains elevated relative to historical norms, indicating that a significant portion of market participants are still parked in stablecoins rather than deploying into risk assets. This combination suggests the broader crypto market has not yet entered a convincing risk-on phase, and any BTC rally may struggle to gain sustained altcoin participation until sentiment meaningfully shifts.
Risk Scenarios
- Bullish case: A decisive 4-hour close above the EMA200 at $63,942, followed by a daily close above $65,000, would confirm a structural recovery attempt with an initial target toward the EMA50 at $65,651 and a secondary target in the $67,000–$68,000 resistance zone.
- Bearish case: Failure to hold the $62,068–$62,598 support cluster, combined with a daily close below the Bollinger Band midline at $61,898, would signal the bounce has exhausted and open the door to retesting the recent lows near $59,500–$60,000.
Outlook
The near-term directional bias is cautiously neutral with a slight bullish lean on the short timeframes, driven by the short-liquidation cascade above $62,000 and the EMA structure beginning to coil on the 1h and 4h. However, the macro daily structure remains unambiguously bearish, and the bounce is best characterized as a relief rally within a downtrend until proven otherwise. The next 24–48 hours are critical: traders should watch whether BTC can sustain above the $63,000–$63,400 EMA cluster on the hourly and challenge the 4h EMA200 at $63,942. A confirmed reclaim of $64,000 with volume would strengthen the bullish case, while any failure to hold $62,600 would likely invite renewed selling pressure toward the $60,000 area. The Fear & Greed Index at 24 (Extreme Fear) historically aligns with capitulation zones, but macro headwinds and persistent OBV distribution warn against premature bottom-calling.
Disclaimer: This analysis is for informational purposes only and does not constitute financial advice. Cryptocurrency markets are highly volatile and unpredictable. All trading decisions should be made based on your own research and risk tolerance. Block Digest is not responsible for any financial losses incurred as a result of acting on this content.
Stay Ahead of the Market
Follow BlockDigest for crypto market intelligence, research and real-time updates.


