
Market Context
The altcoin market is navigating a distinctly risk-off environment as of July 9, 2026, with Bitcoin sliding to the $62,000 area amid rising geopolitical tensions tied to U.S.-Iran friction driving oil and bond yields higher. BTC dominance sits at 55.36%, reflecting capital rotation back toward Bitcoin relative safety, while USDT dominance at 8.19% remains elevated — a signal that sidelined stablecoins are not yet re-entering the market with conviction. The Fear & Greed Index reading of 27 confirms that participants are in defensive mode, and the broader $2.23 trillion market cap figure, down on the day, underscores the cautious posture across the altcoin complex.
Solana (SOL)
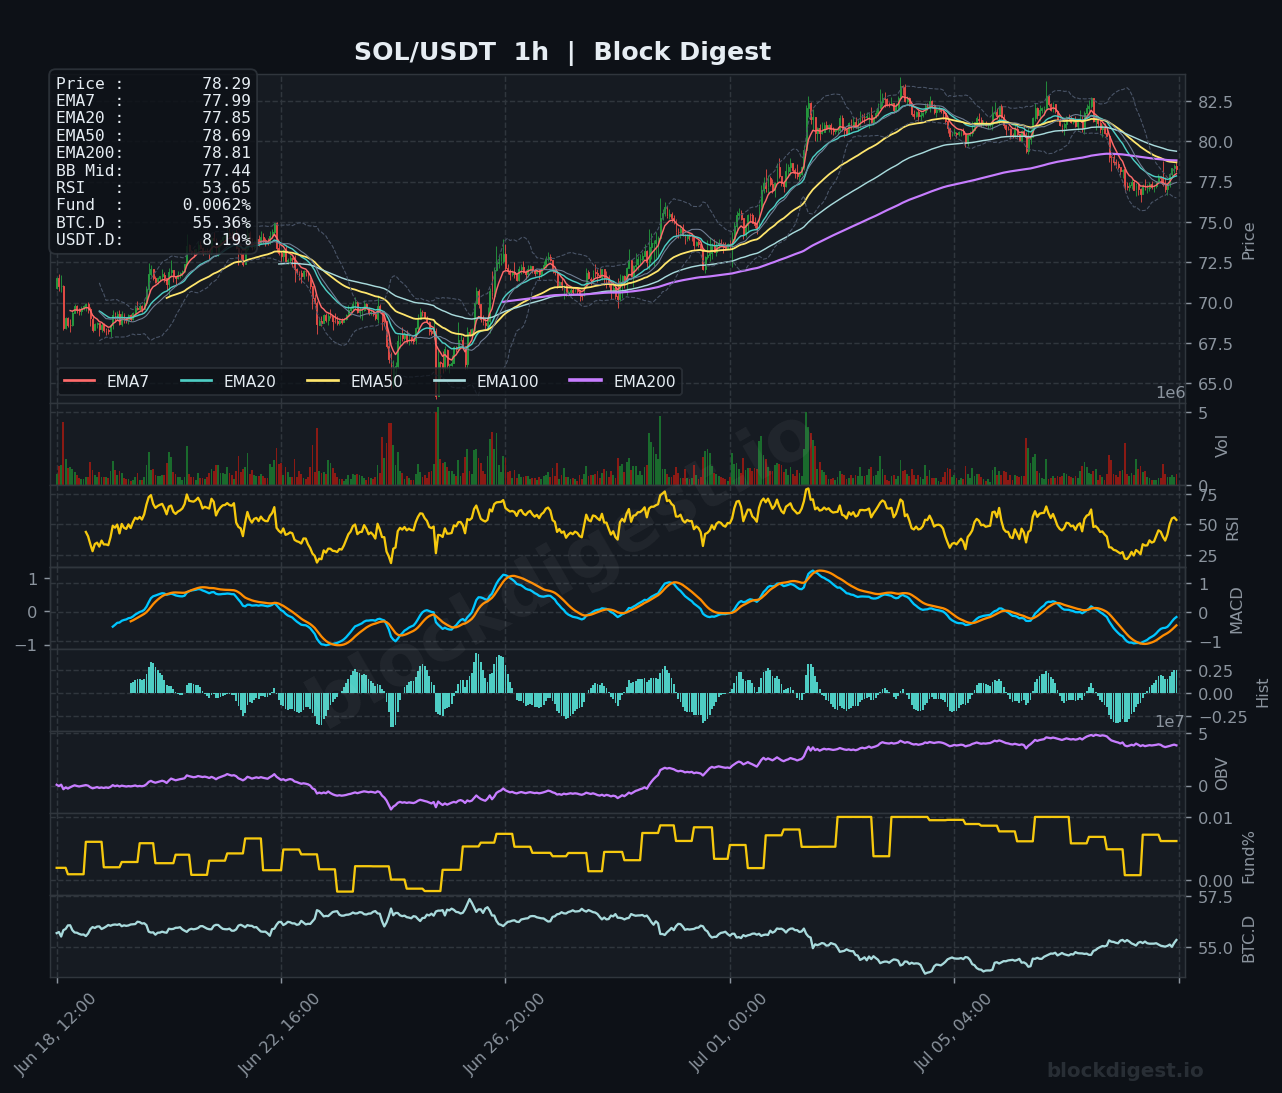
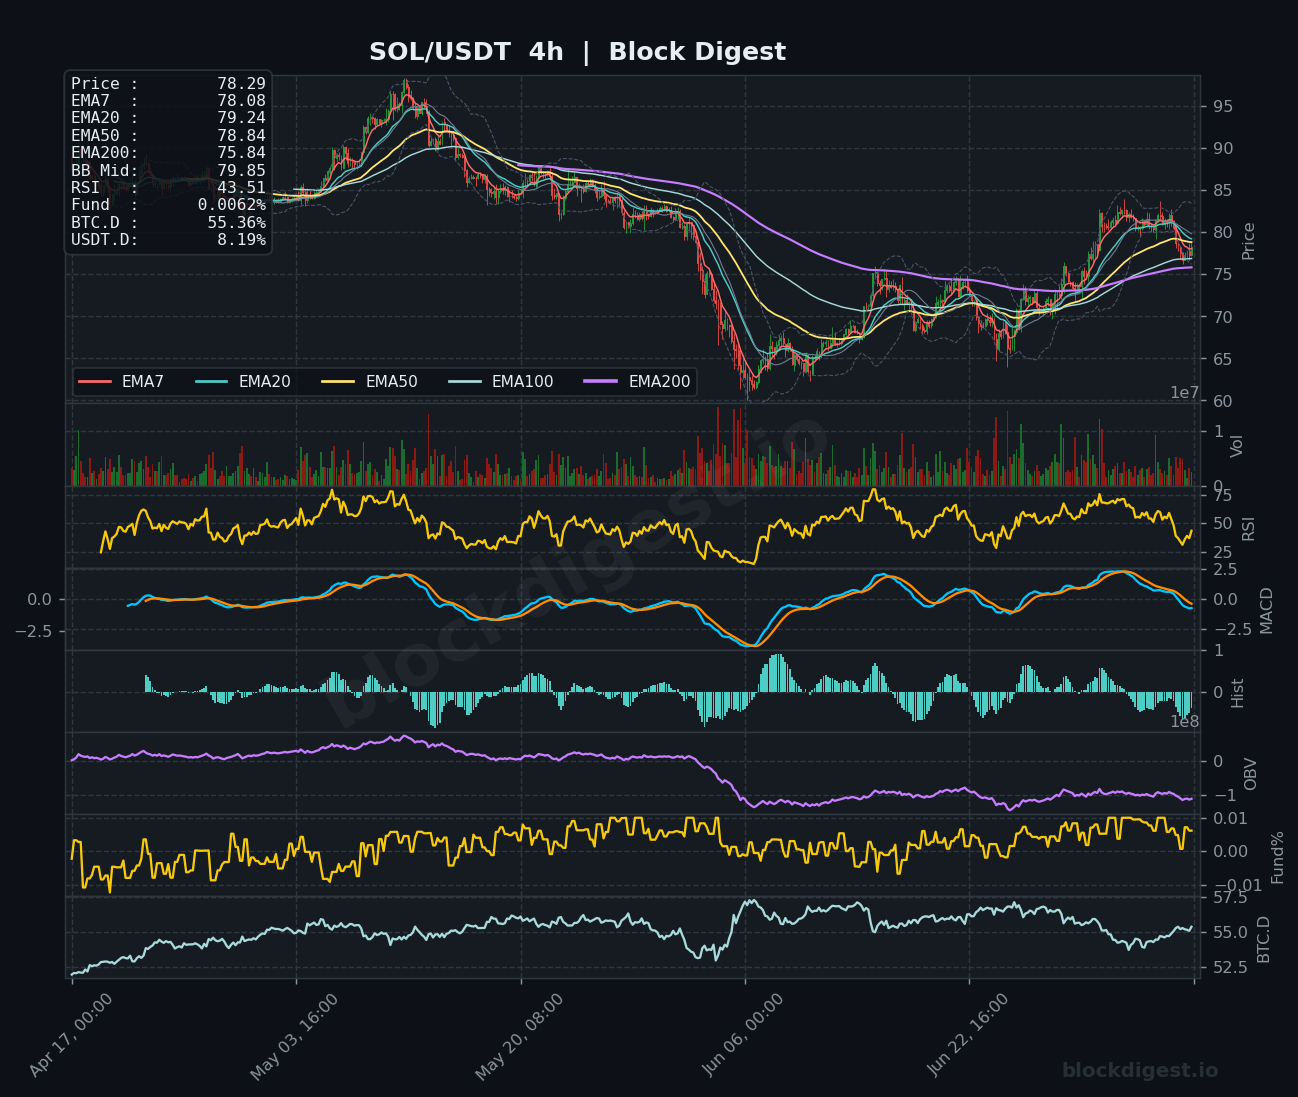
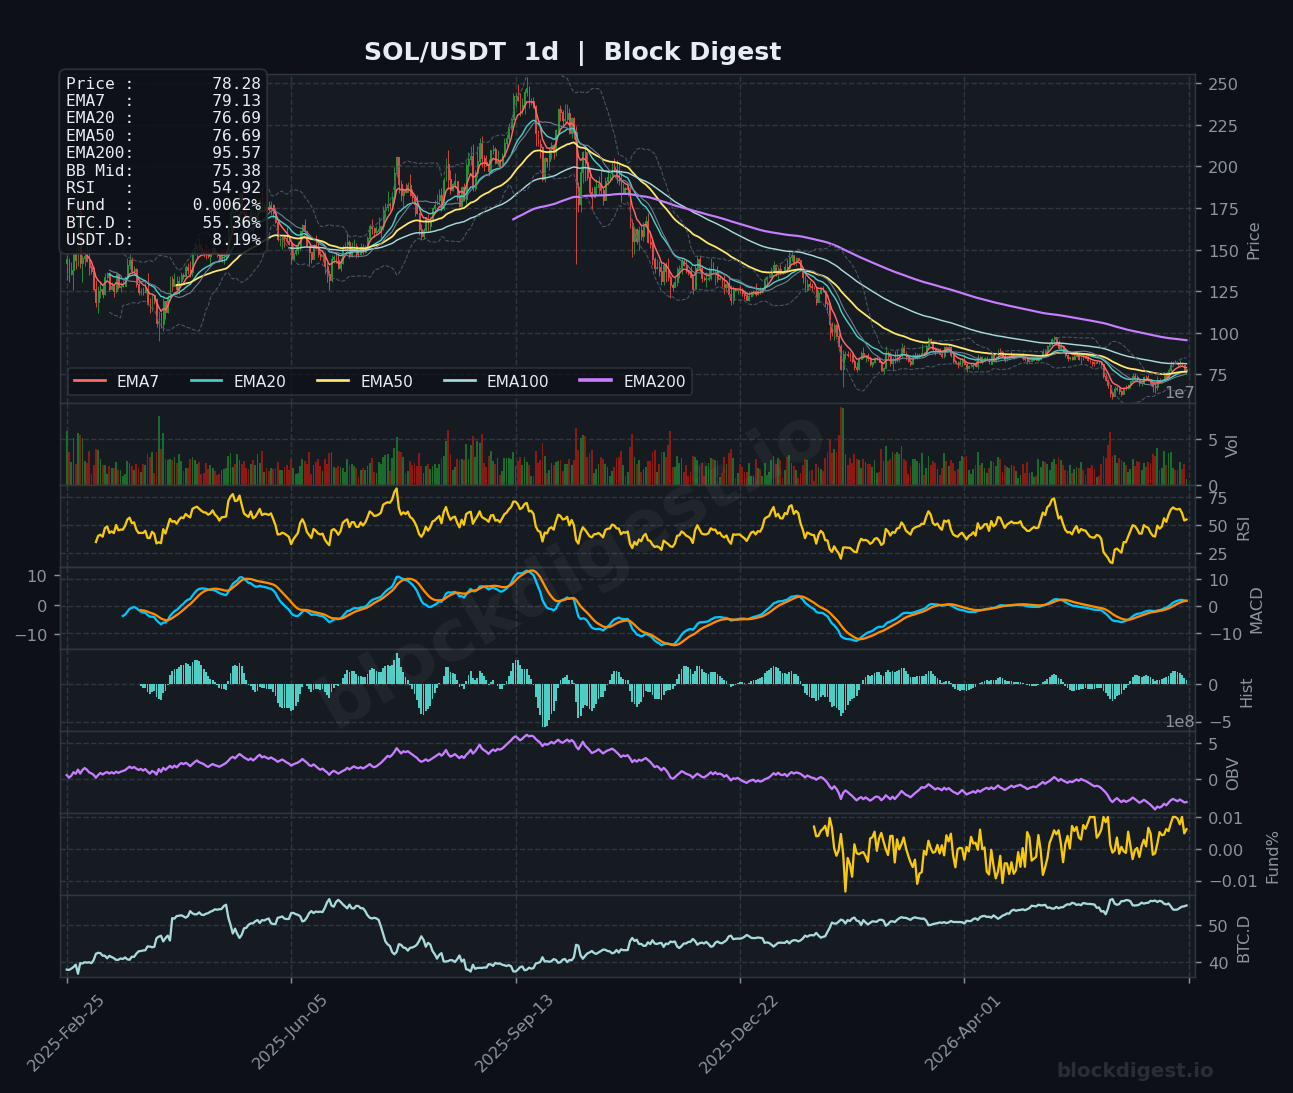
SOL is trading at approximately $78.28, caught in a compression zone just below its EMA50 ($78.84) and EMA200 ($78.81) on the 4h chart, with price action sandwiched between these two dynamic resistances. The 4h RSI at 43.51 is leaning bearish and the MACD remains in negative territory with histogram bars still red, suggesting the intermediate trend has not yet fully recovered from the sharp June drawdown that took price from roughly $95 to the mid-$60s. On the daily chart, the RSI reads 54.92 — a mild improvement — but the EMA200 at $95.57 looms as a formidable macro resistance, and OBV has been declining throughout the correction phase, reflecting persistent net selling pressure. The 1h chart shows some near-term stabilization with RSI at 53.65 and price hovering above all short-term EMAs, but a failure to reclaim $80.00 cleanly would keep the short-term bias cautiously bearish with immediate support around $76–$75.
XRP (XRP)
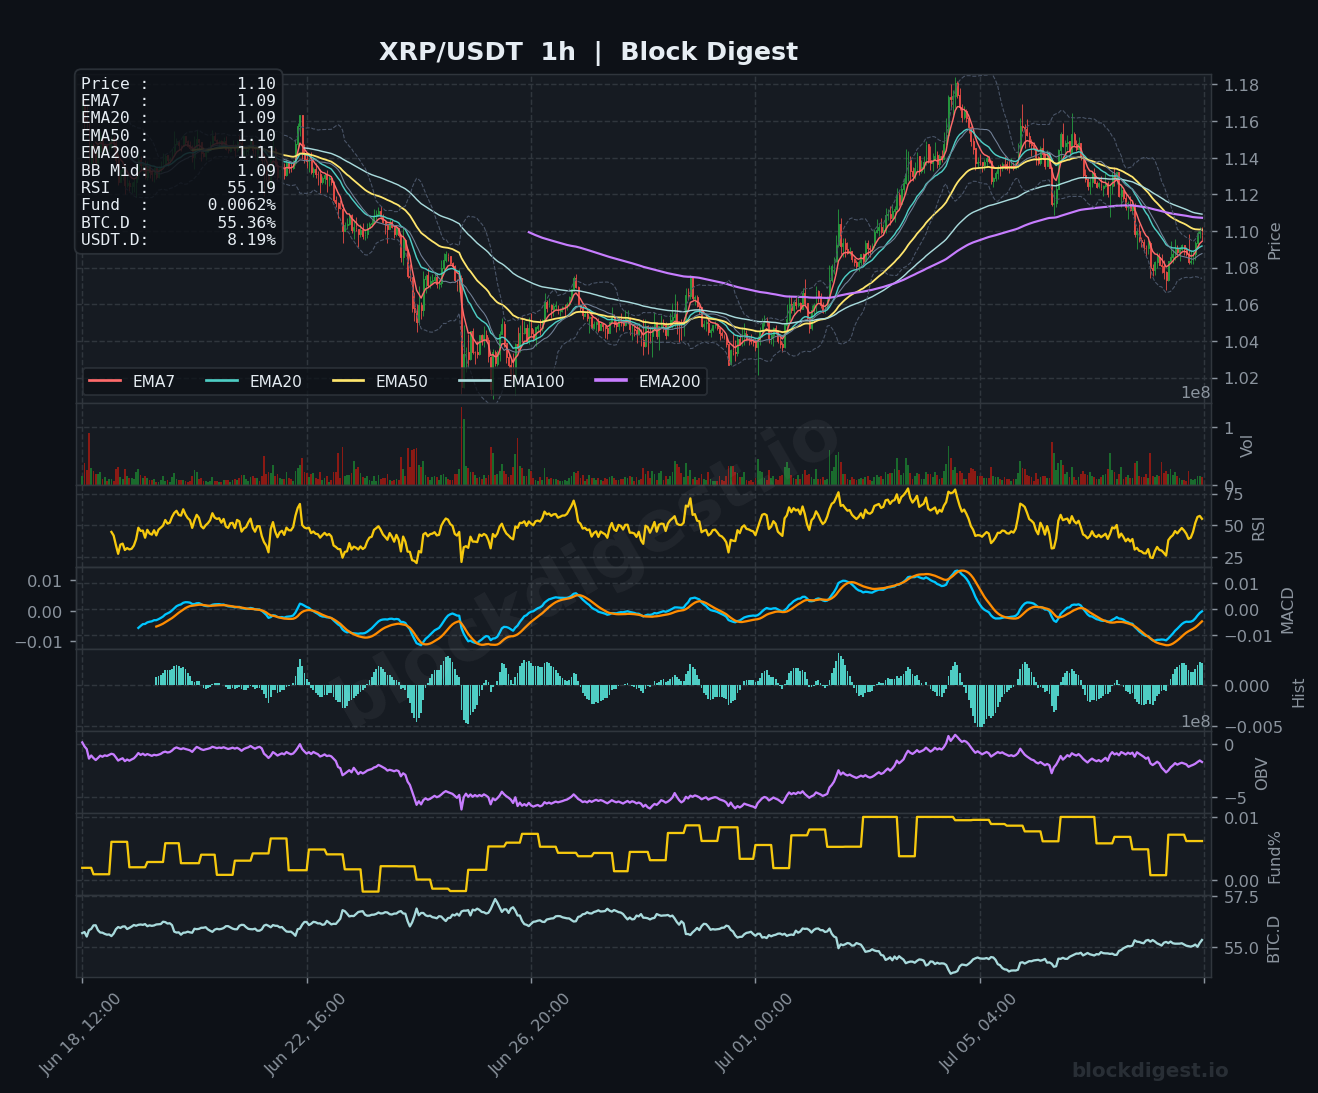
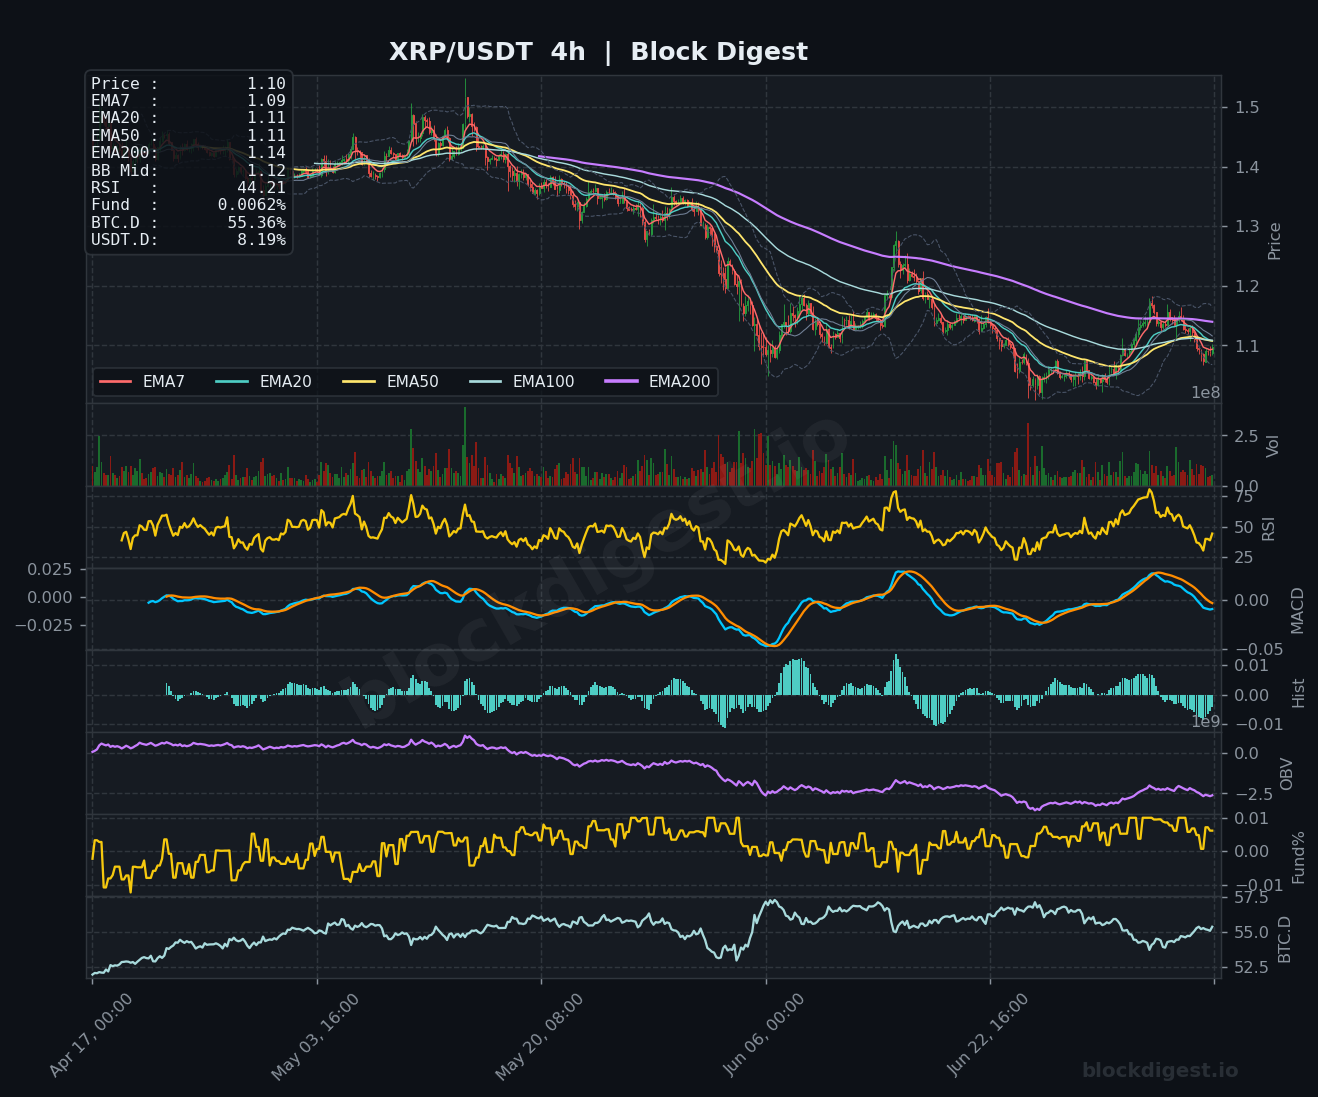
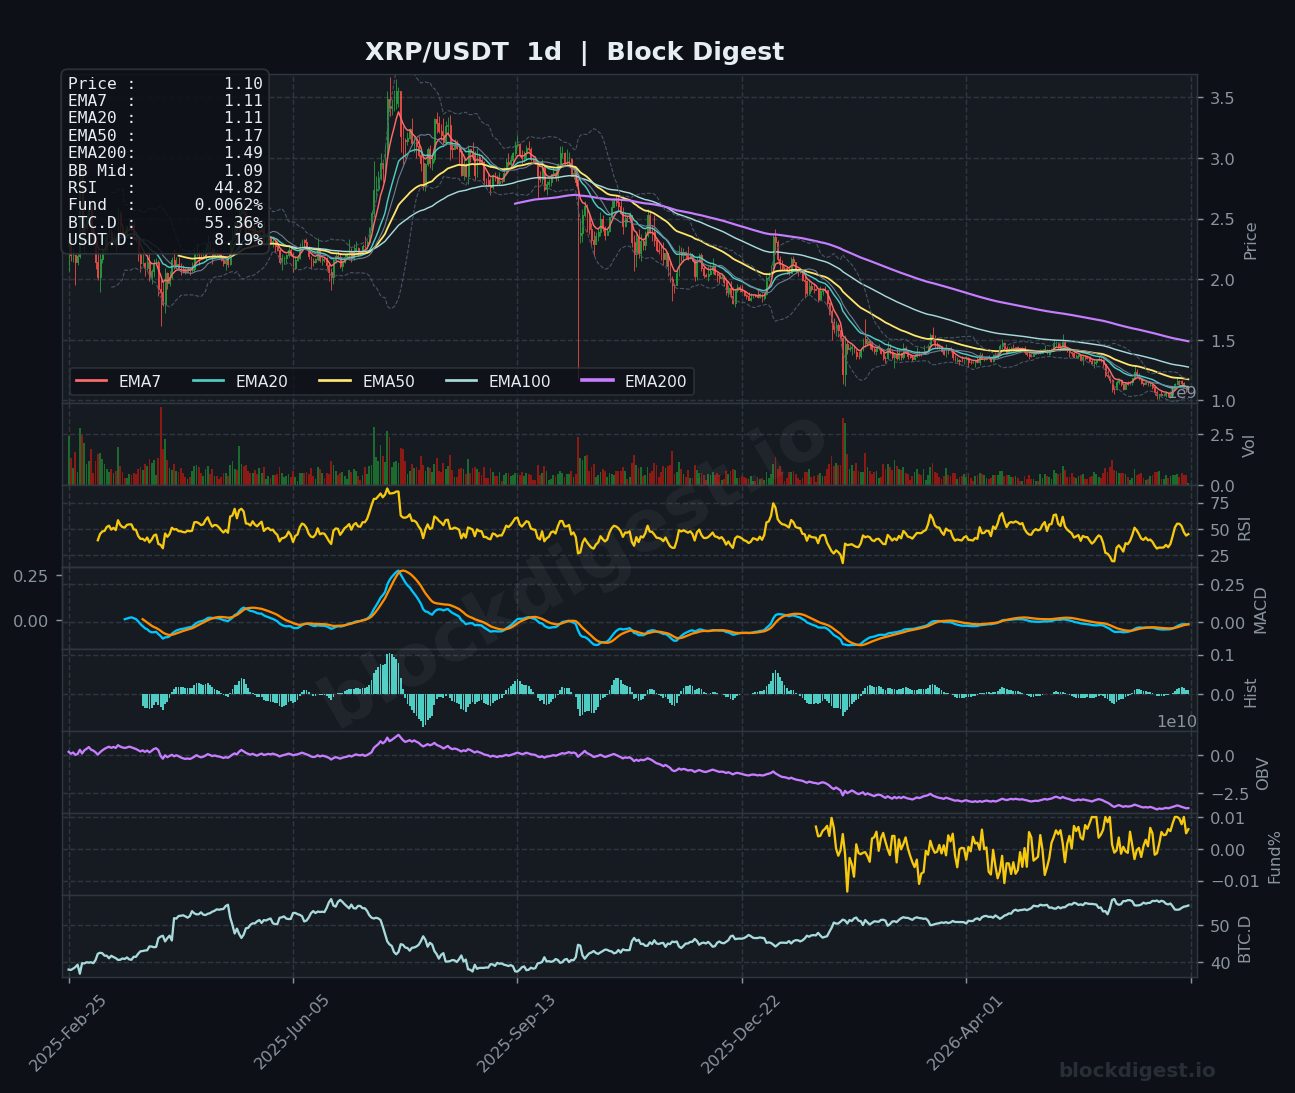
XRP is trading near $1.10, struggling to sustain momentum after a failed attempt to push above the $1.18 zone visible on the 1h chart. The 4h RSI at 44.21 is soft and the MACD has rolled over from its recent recovery peak, with the histogram turning negative — pointing to fading bullish momentum on the intermediate timeframe. On the daily chart, the picture is considerably more bearish: price remains well below the EMA50 ($1.17), EMA200 ($1.49), and all major moving averages are in a steep descending configuration following the collapse from the highs above $3.00 recorded in prior months. Despite XRP Ledger ecosystem tokens being cited as relative sector gainers, the broader technical setup suggests any rallies toward $1.15–$1.18 are likely to face supply, with key support to watch at the $1.04–$1.05 zone; the bias remains neutral-to-bearish until a clean daily close above $1.20 is achieved.
BNB (BNB)
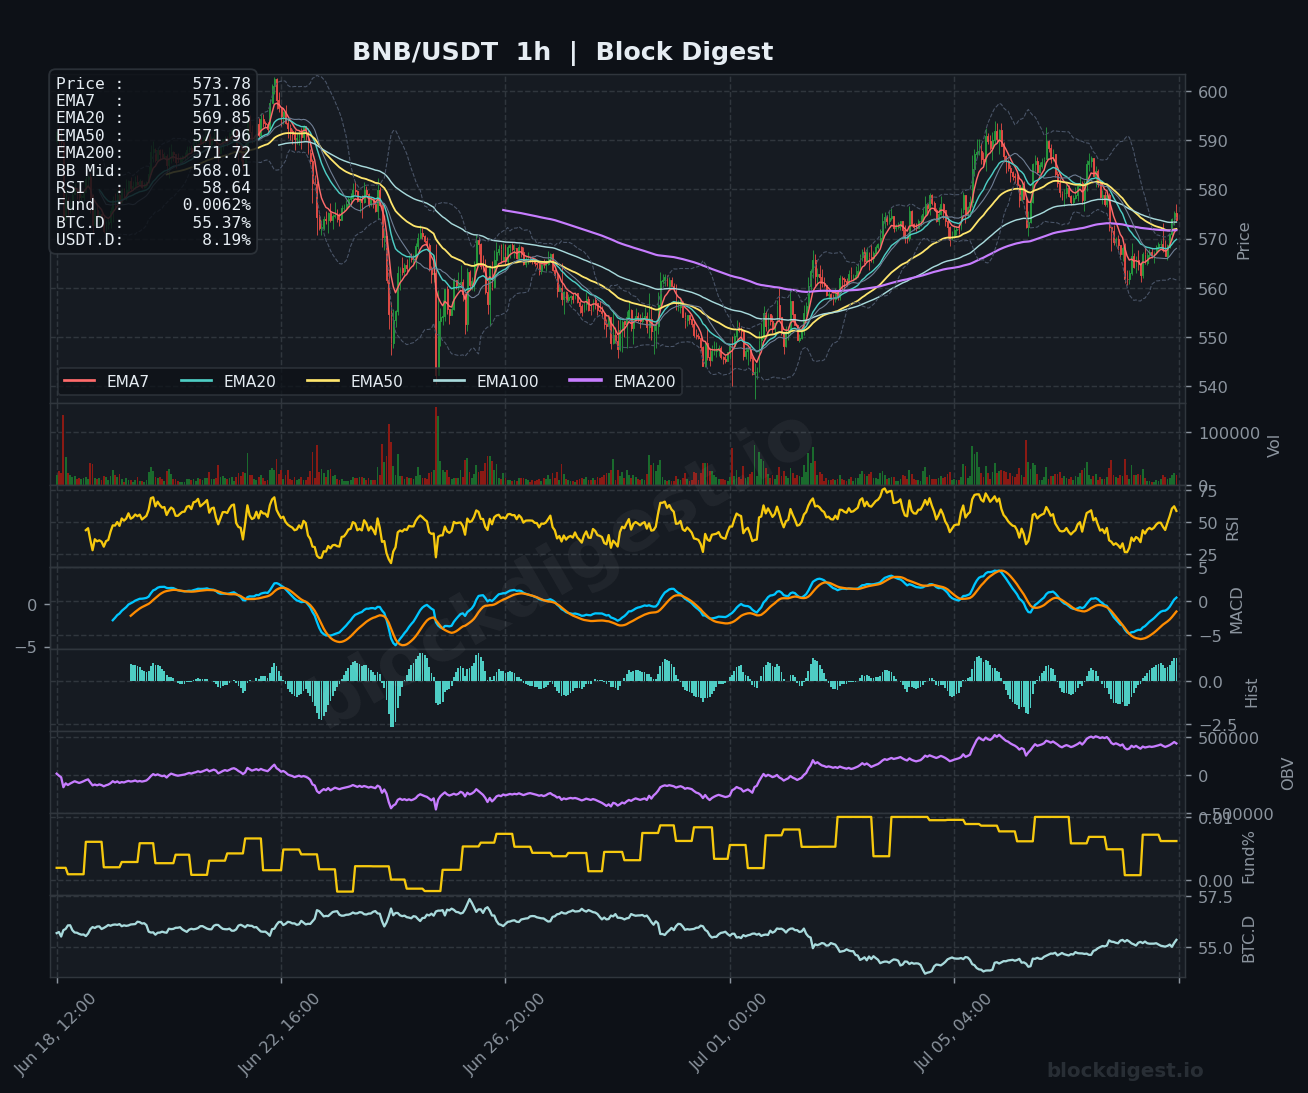
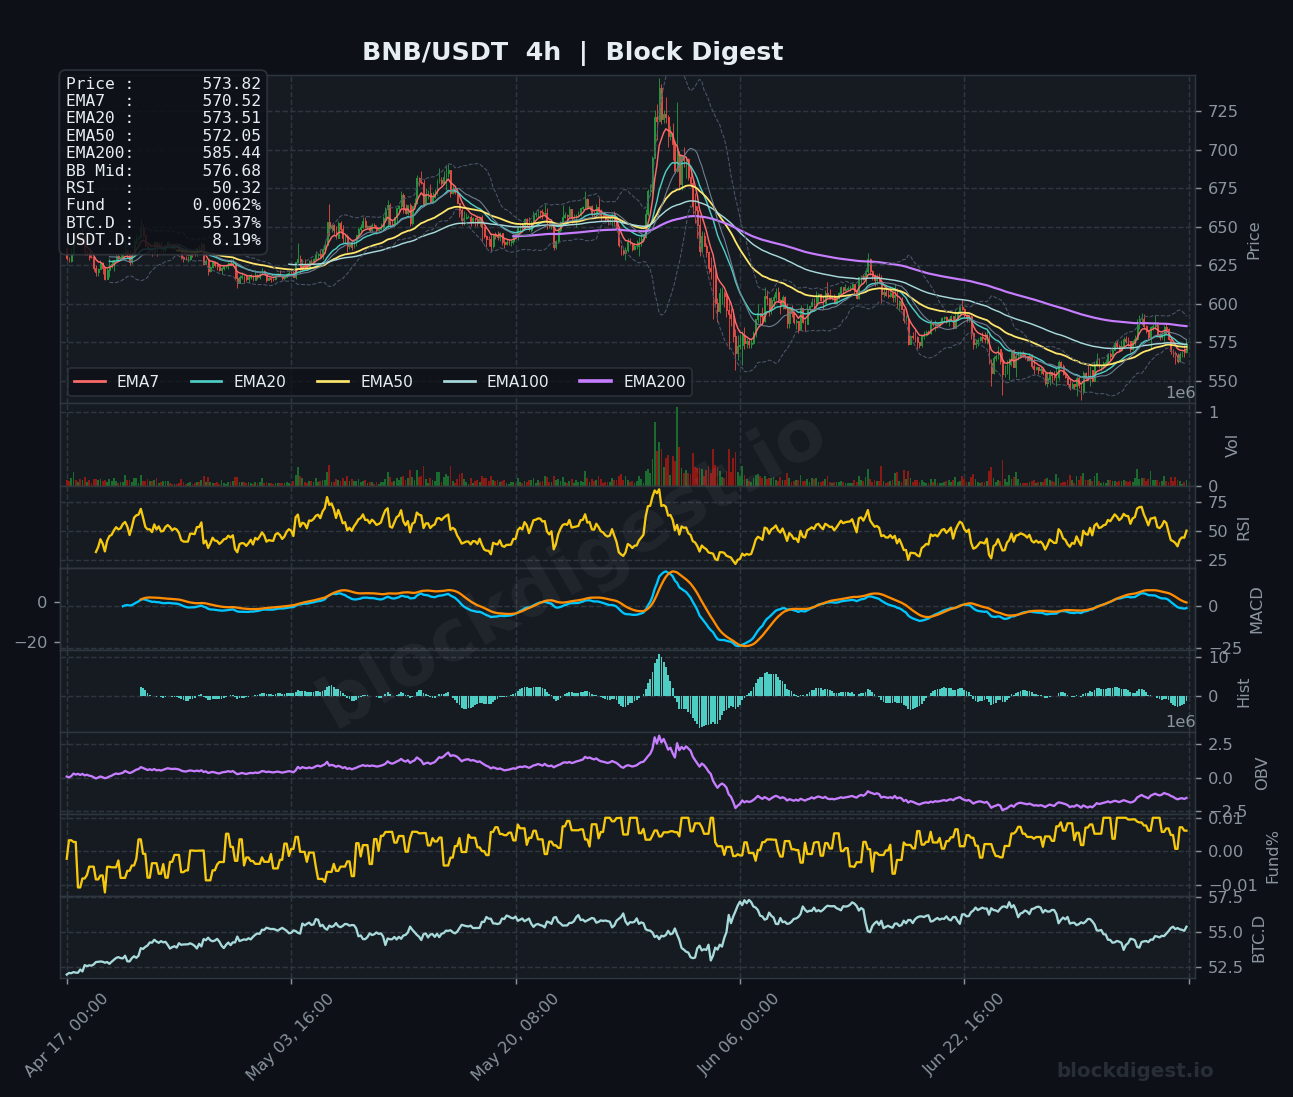
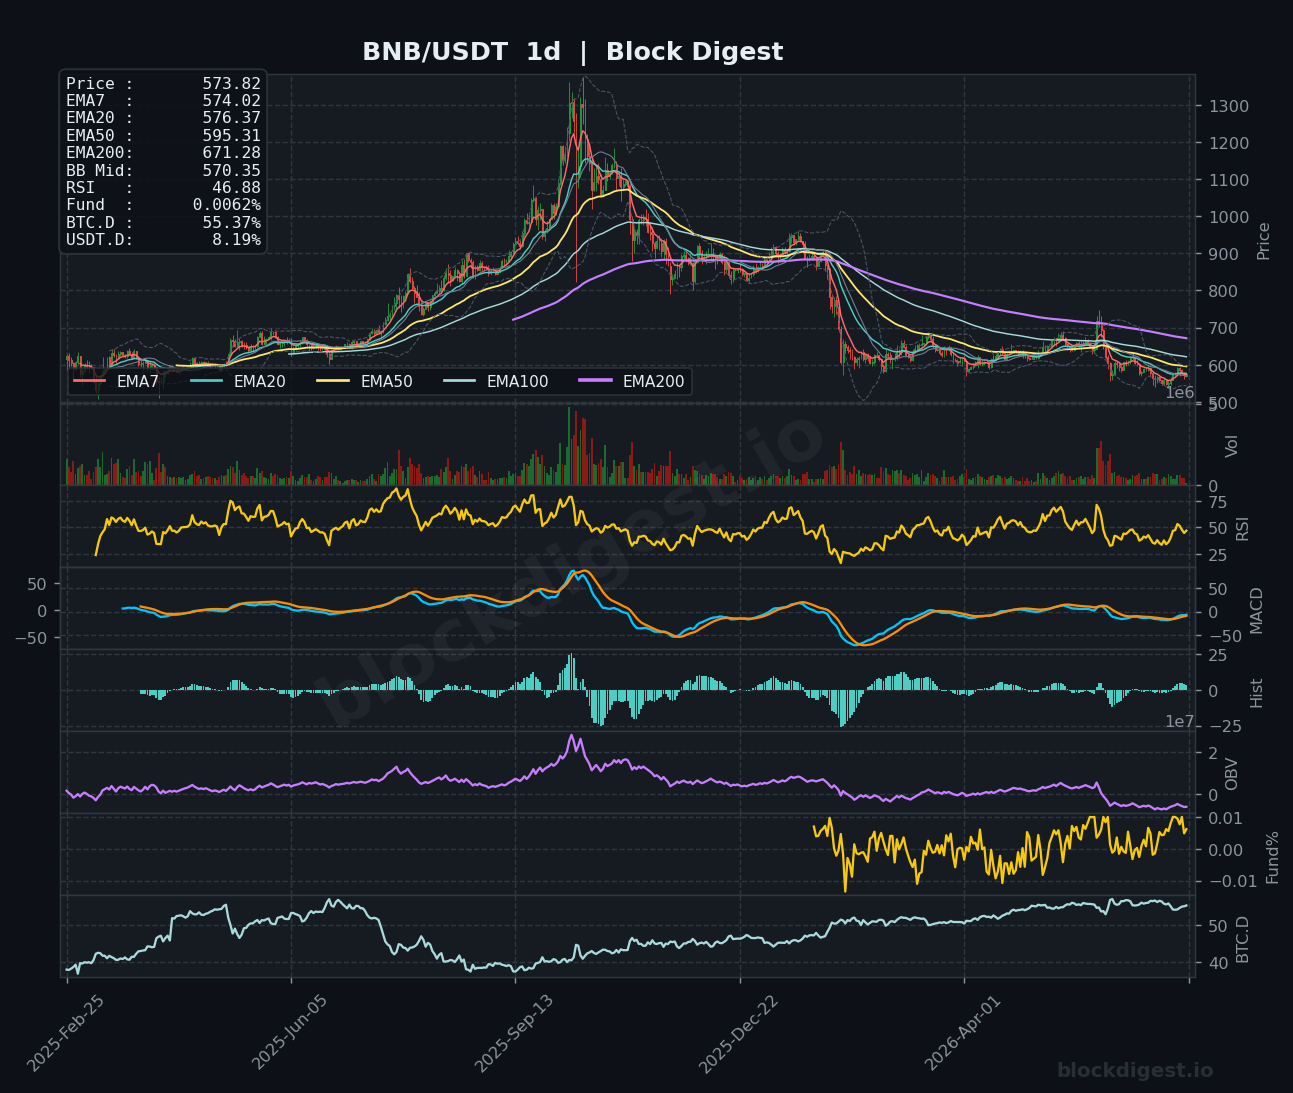
BNB is currently trading around $573.82, showing one of the more resilient short-term structures among the coins reviewed today. The 1h chart shows price holding above all short-term EMAs (EMA7 at $571.86, EMA20 at $569.85, EMA50 at $571.96) with RSI at 58.64 — the strongest hourly RSI reading across this altcoin set — and OBV trending positively, indicating accumulation. On the 4h chart, RSI sits at 50.32, balanced at the midpoint, while the MACD is recovering toward the zero line from deeply negative territory, consistent with a gradual base-building process following the sharp correction from the $725 peak. The daily chart, however, reveals the macro headwind: price remains below the EMA50 ($595.31) and far beneath the EMA200 ($671.28), confirming the dominant trend is still downward; BNB Chain’s new high-frequency layer-1 development is a positive fundamental catalyst, but technicals need to see a sustained reclaim of $590–$600 before the broader bias can shift to bullish.
Dogecoin (DOGE)
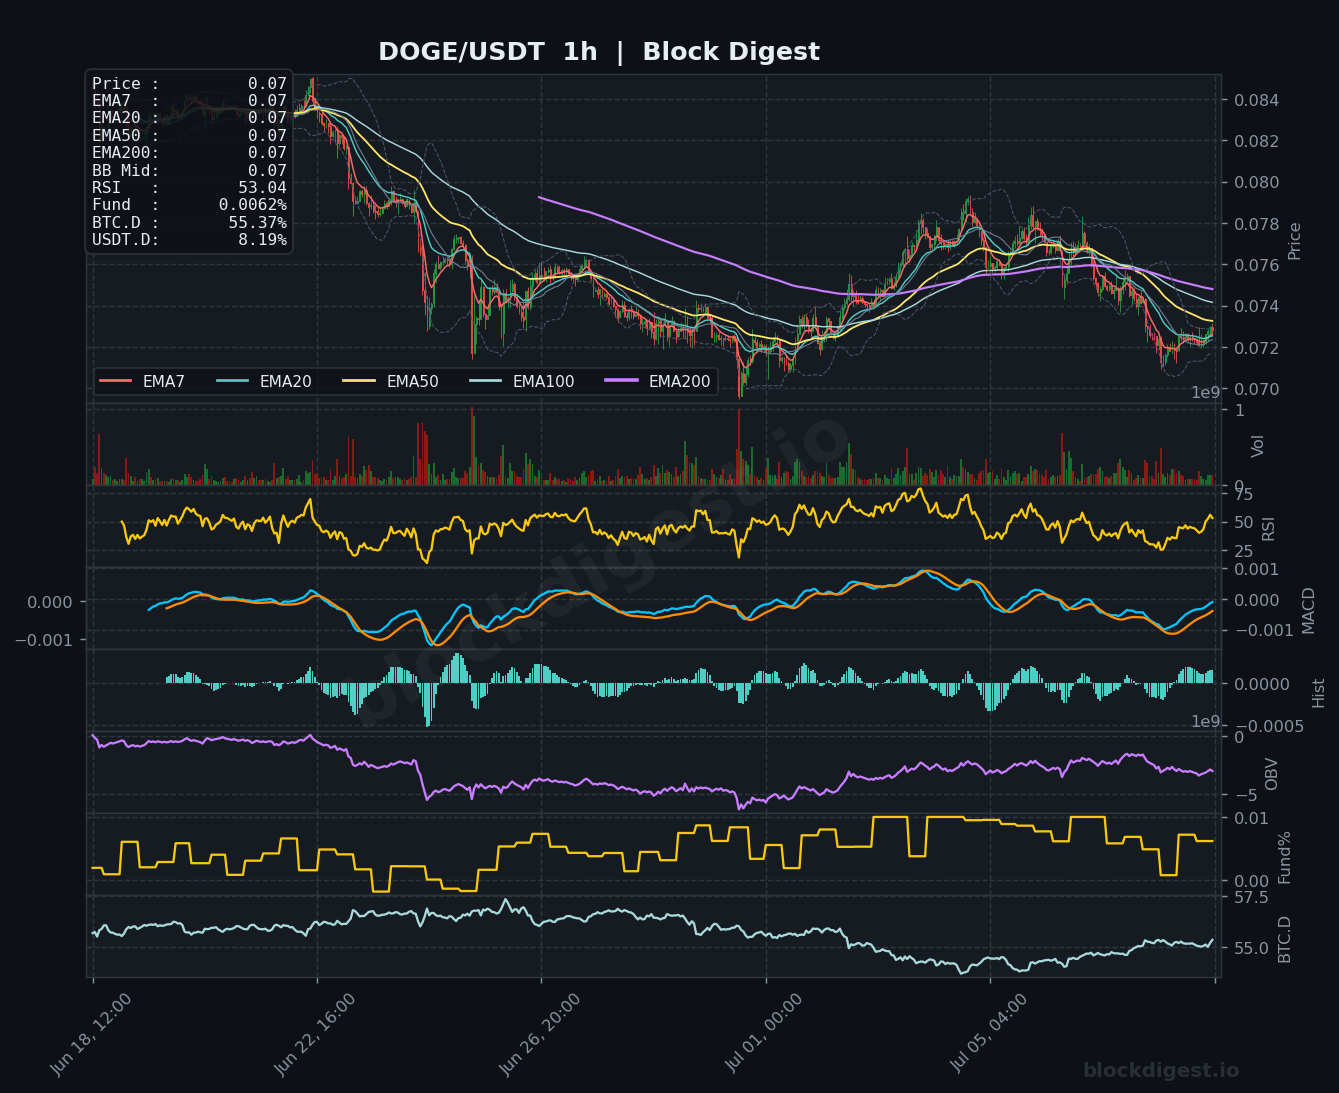
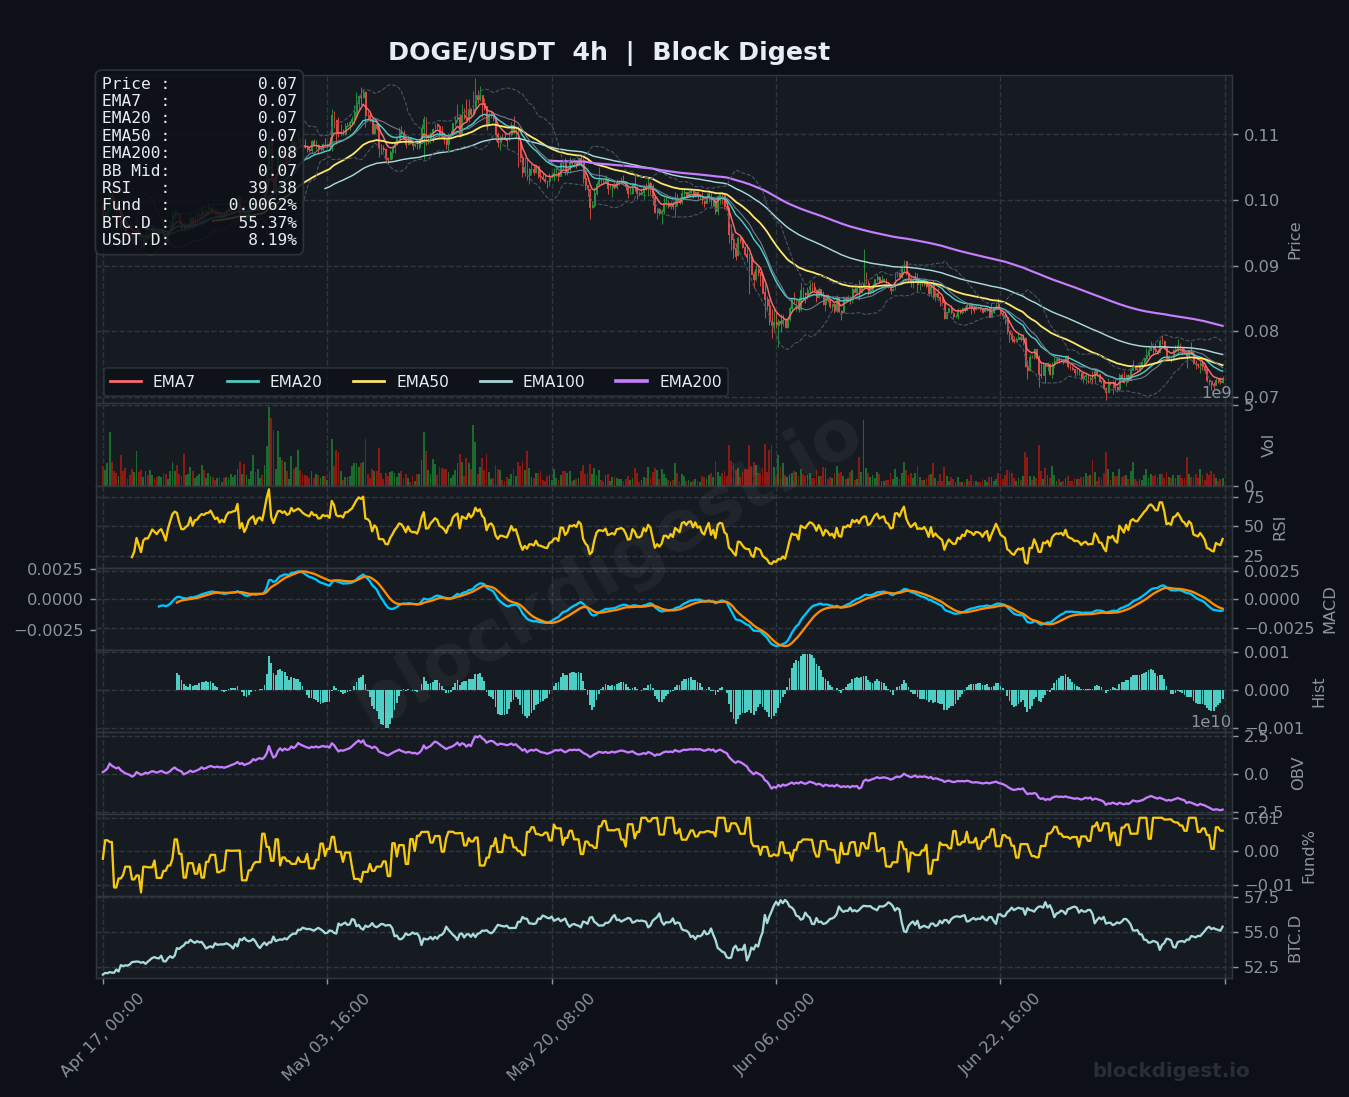
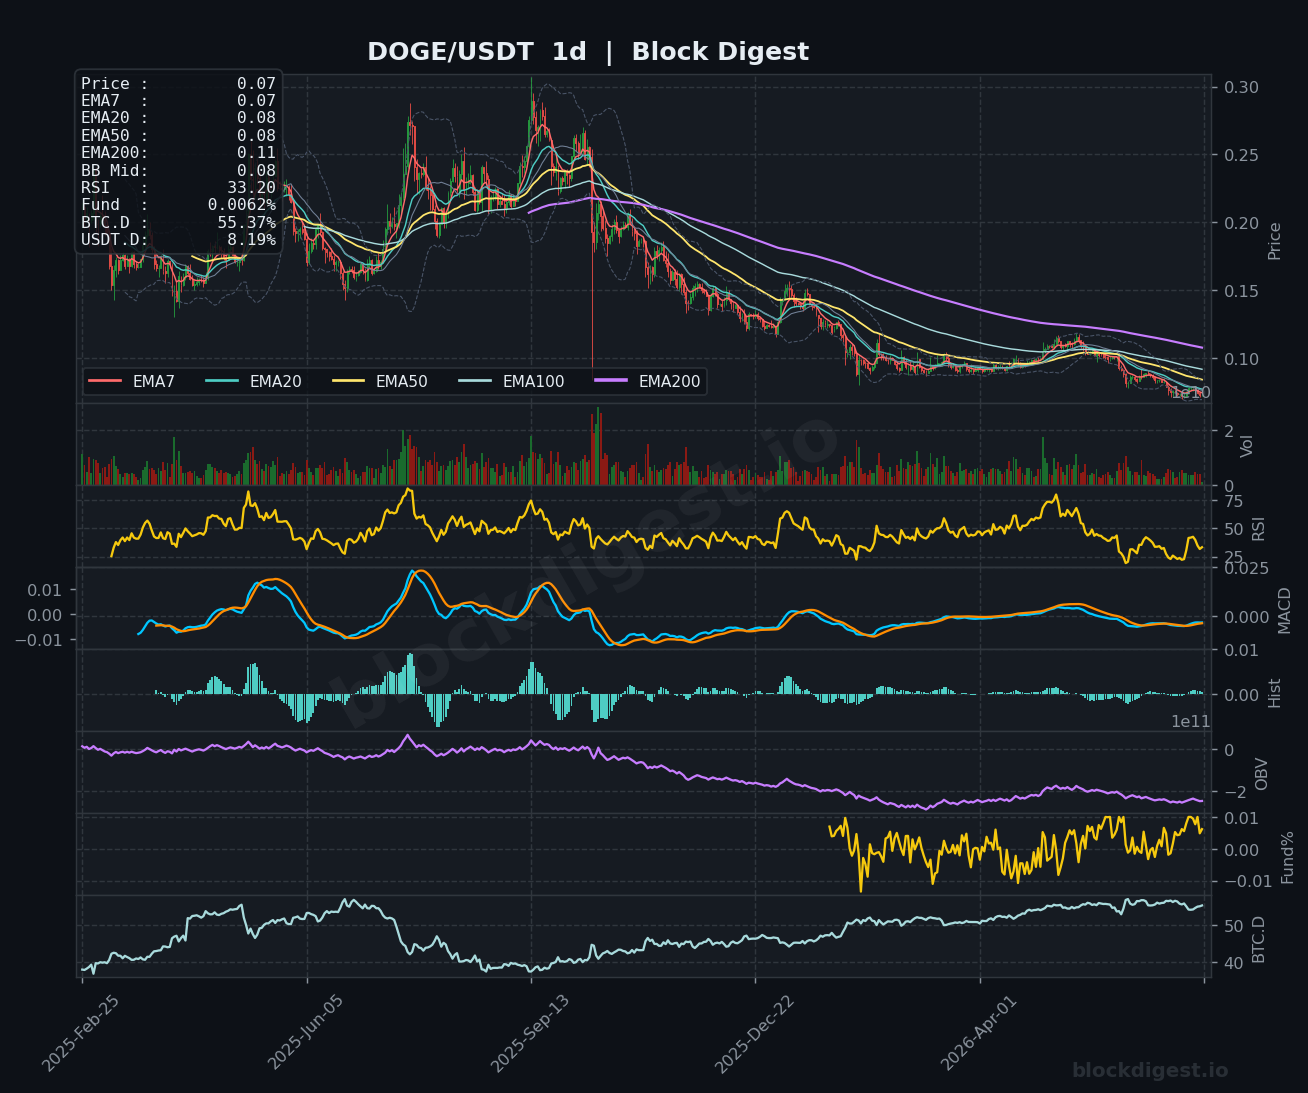
DOGE is trading at approximately $0.0724, and its technical picture is among the weakest in today’s review. The daily RSI has deteriorated to 33.20 — approaching oversold territory but not yet at a level that has historically triggered sharp reversals — while the daily MACD remains in negative territory with the signal line converging but showing no bullish crossover. On the 4h timeframe, RSI at 39.38 confirms sustained bearish pressure, and the OBV has been on a prolonged decline since the mid-cycle highs, indicating persistent distribution rather than accumulation. Price is trading below all key EMAs on the 4h chart, with the EMA200 at $0.08 acting as a formidable overhead resistance; immediate support sits around $0.070–$0.071, and a break below that level could expose the $0.065 region, keeping the short-term bias firmly bearish.
Litecoin (LTC)
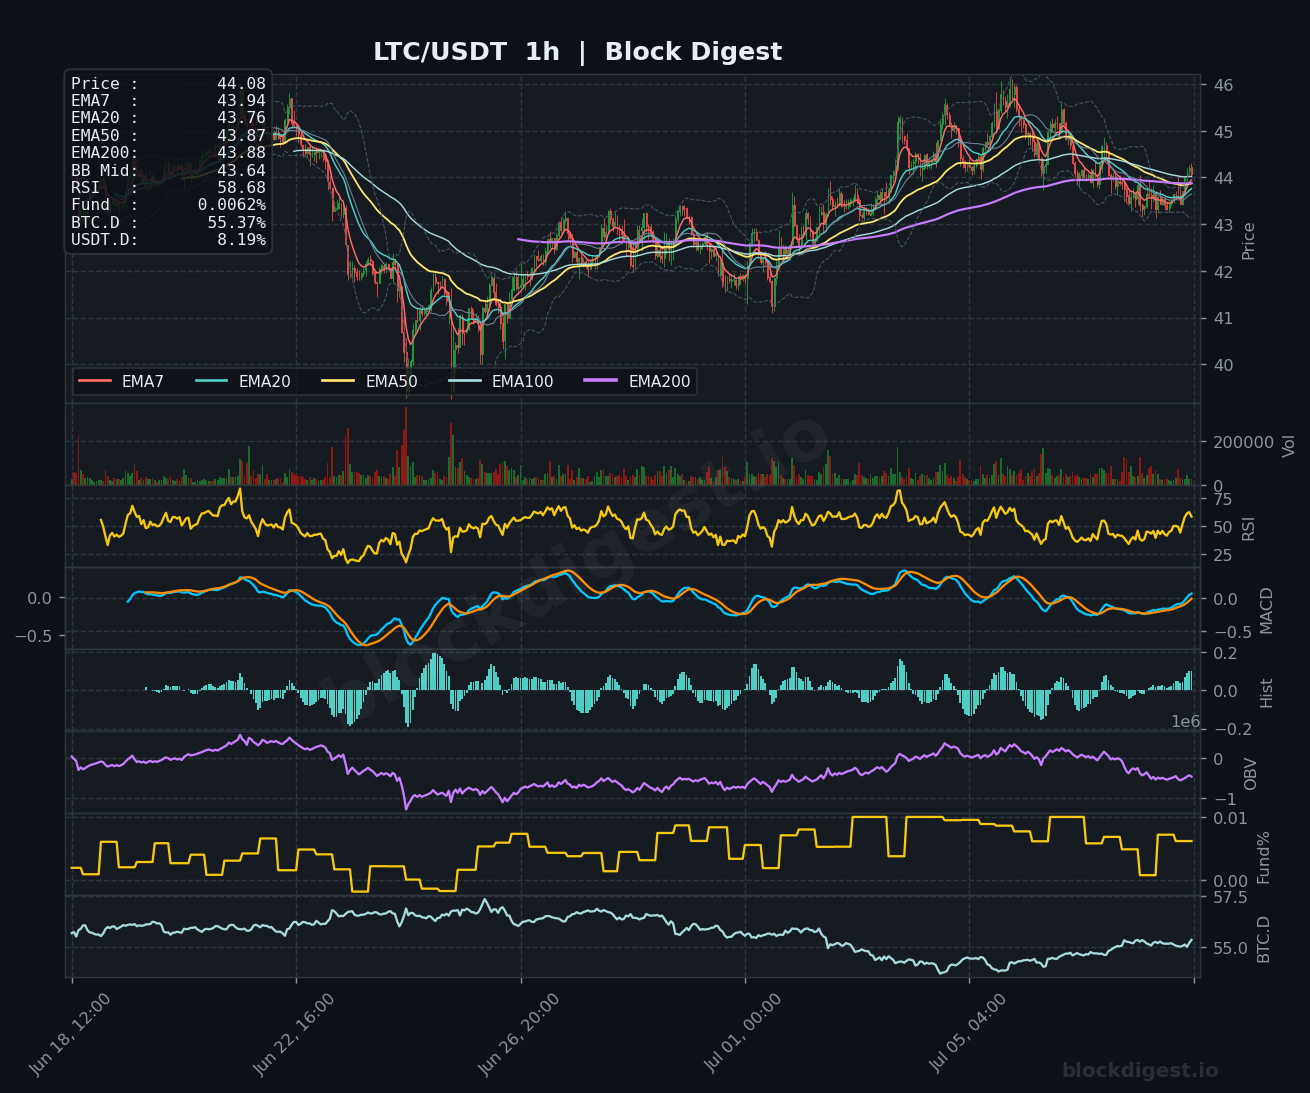
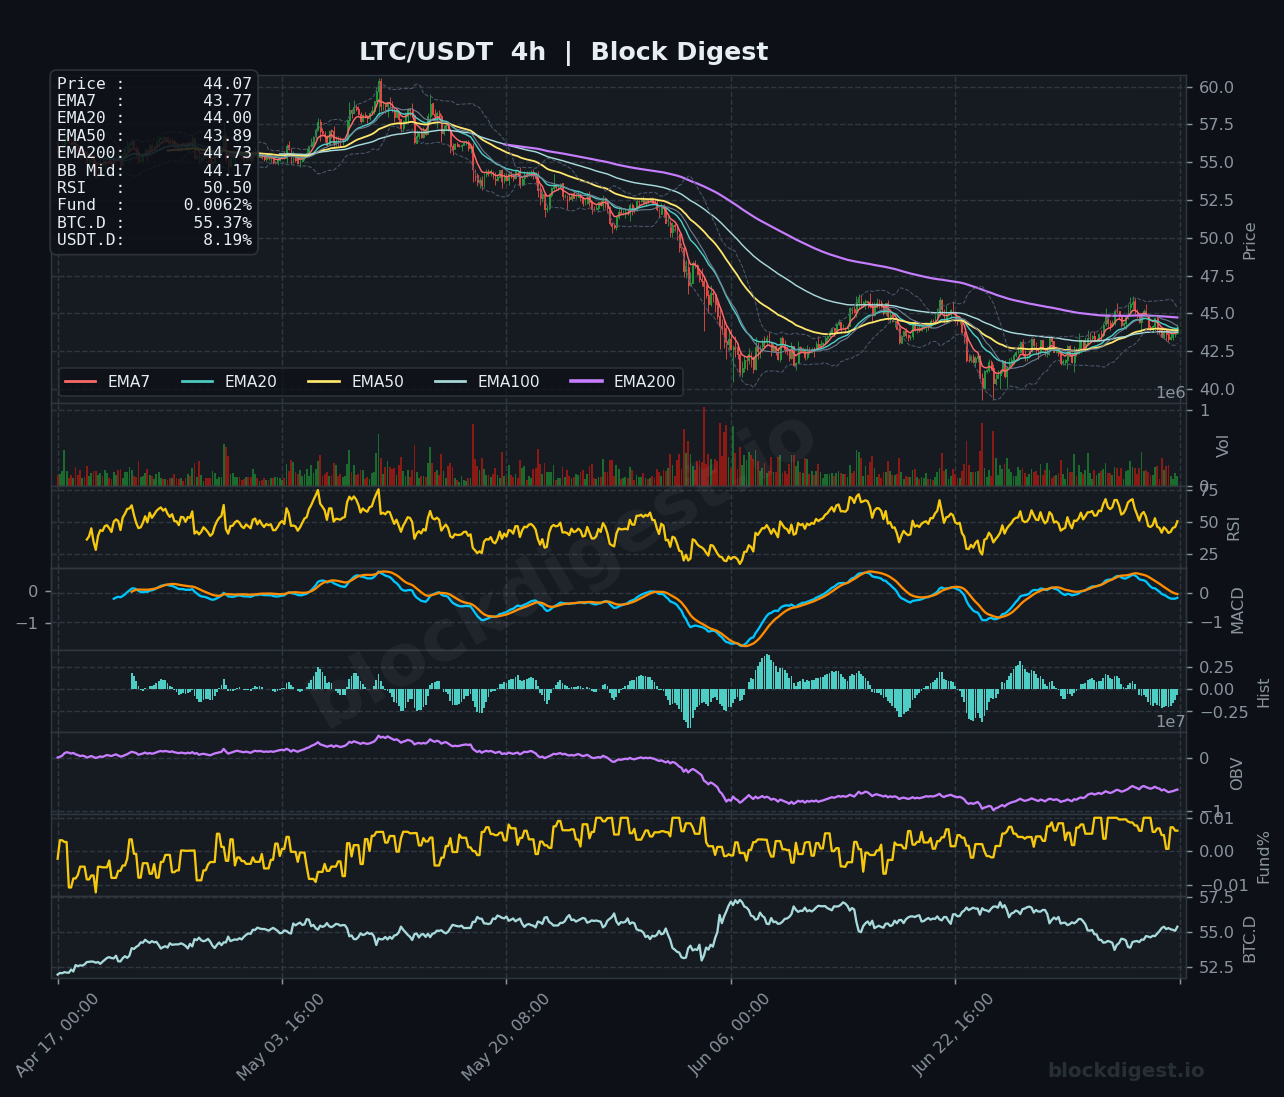
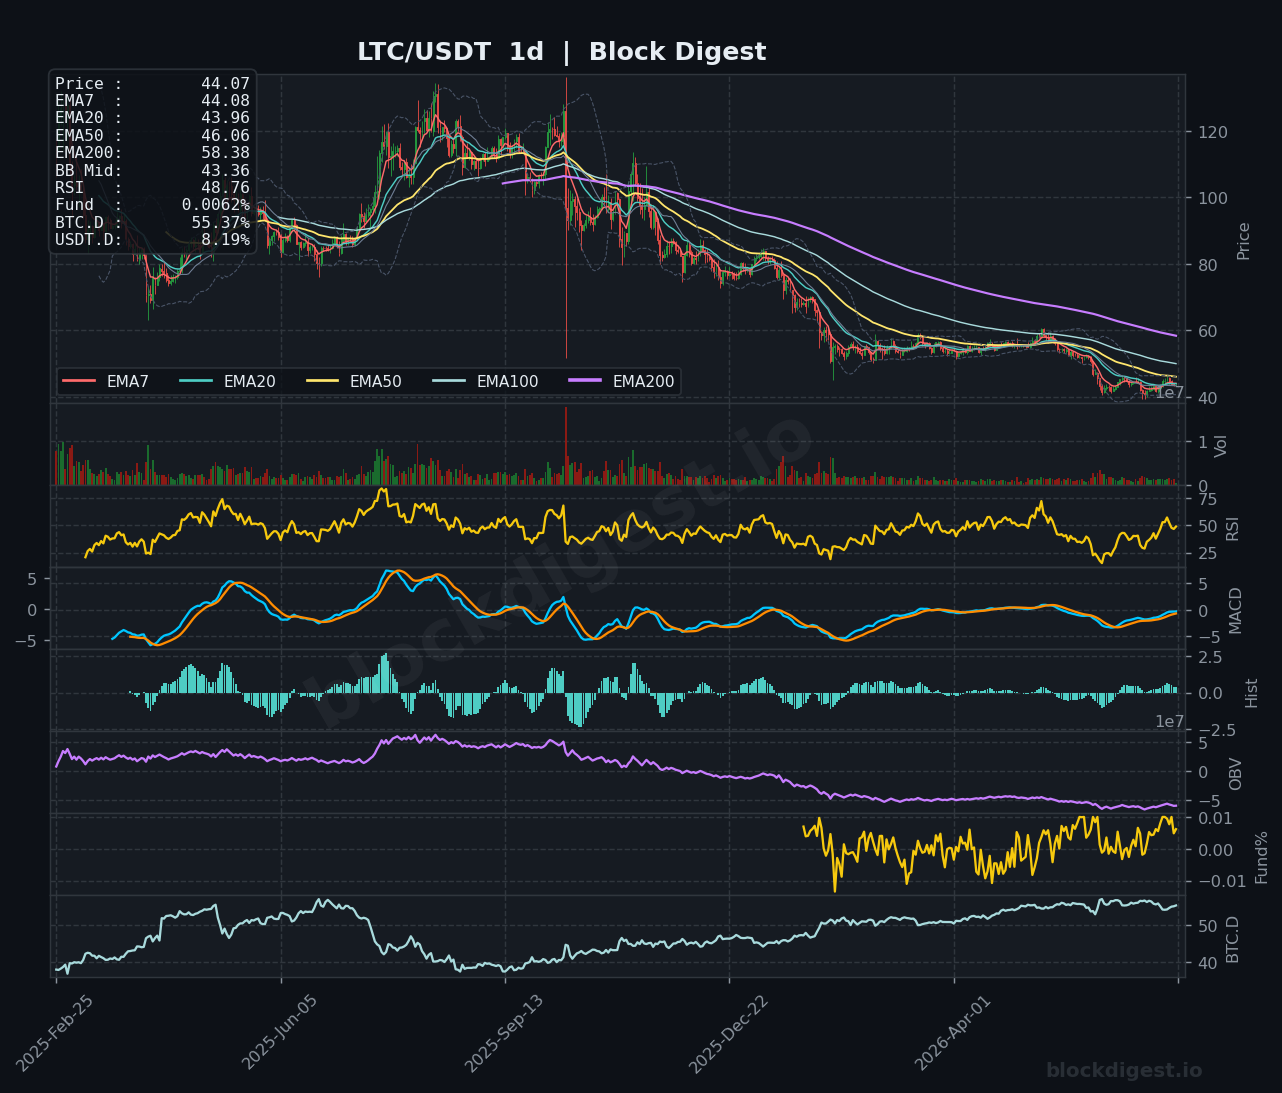
LTC is trading around $44.07, and unlike several peers, it is showing a relatively constructive near-term structure. On the 1h chart, RSI reads 58.68 and price is sitting above all short-term EMAs, with EMA7 ($43.94), EMA20 ($43.76), EMA50 ($43.87), and EMA200 ($43.88) tightly clustered — a potential springboard if buyers can defend the $43.50–$44.00 zone. The 4h RSI at 50.50 is neutral but the MACD is attempting a bullish crossover from below zero, and OBV has been recovering steadily from its recent lows, suggesting some quiet accumulation underway. However, the daily chart tells a sobering macro story: LTC has shed more than half its value from peak levels, the EMA200 at $58.38 remains distant overhead resistance, and daily RSI at 48.76 keeps the coin in no-man’s land; bulls need a clean break and hold above $46.00 to signal a more meaningful recovery, otherwise $41–$42 remains a realistic downside scenario on any BTC-driven leg lower.
TRON (TRX)
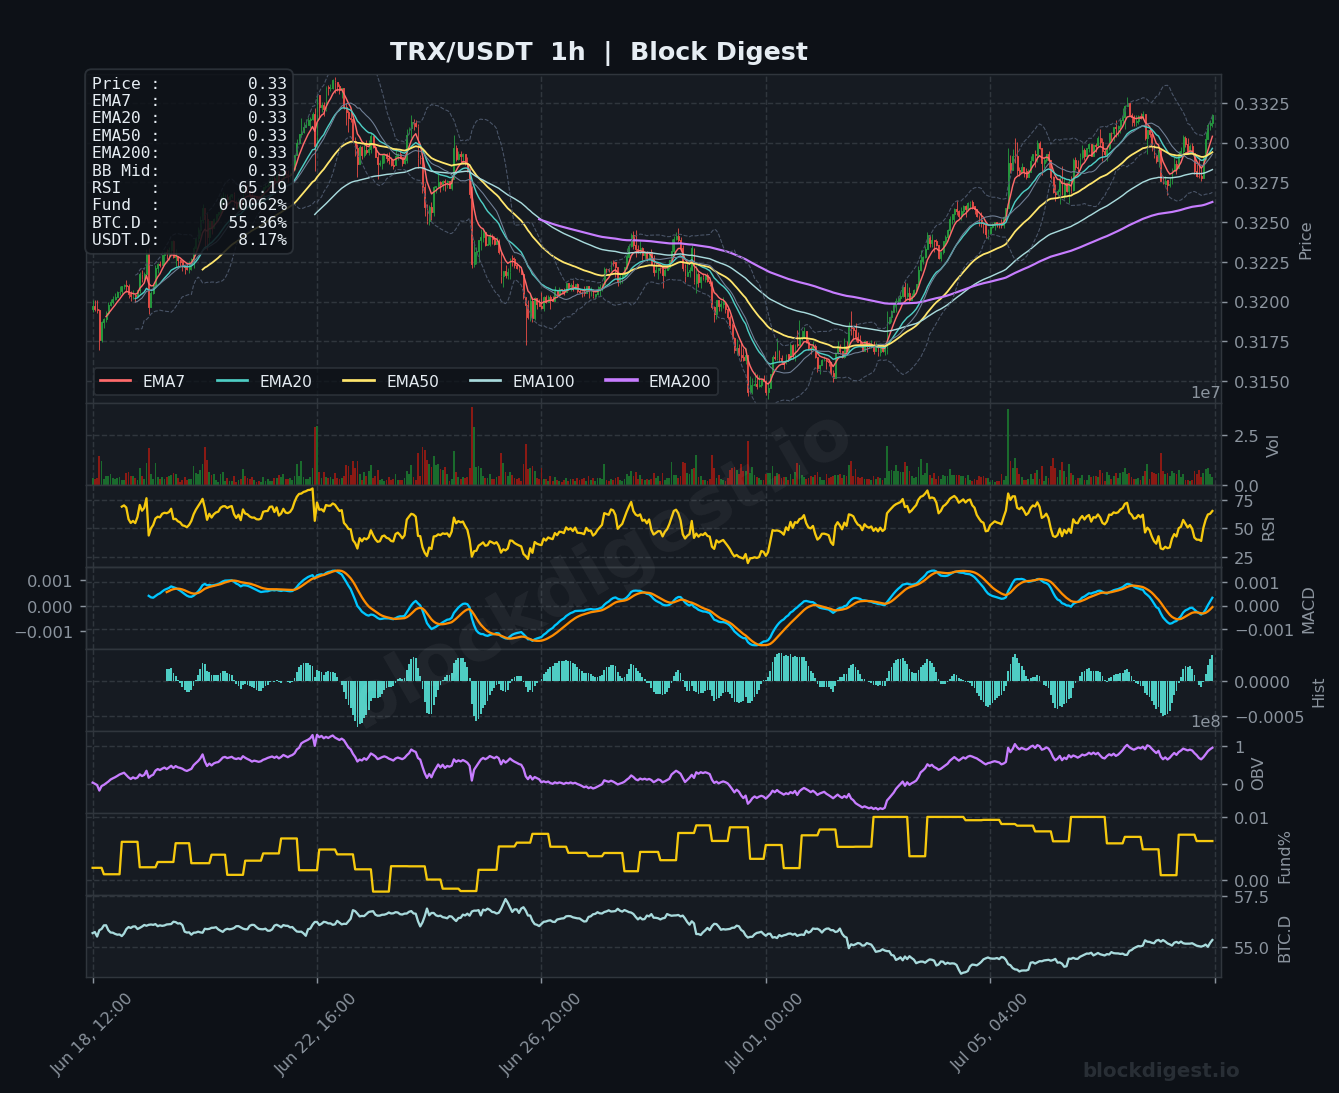
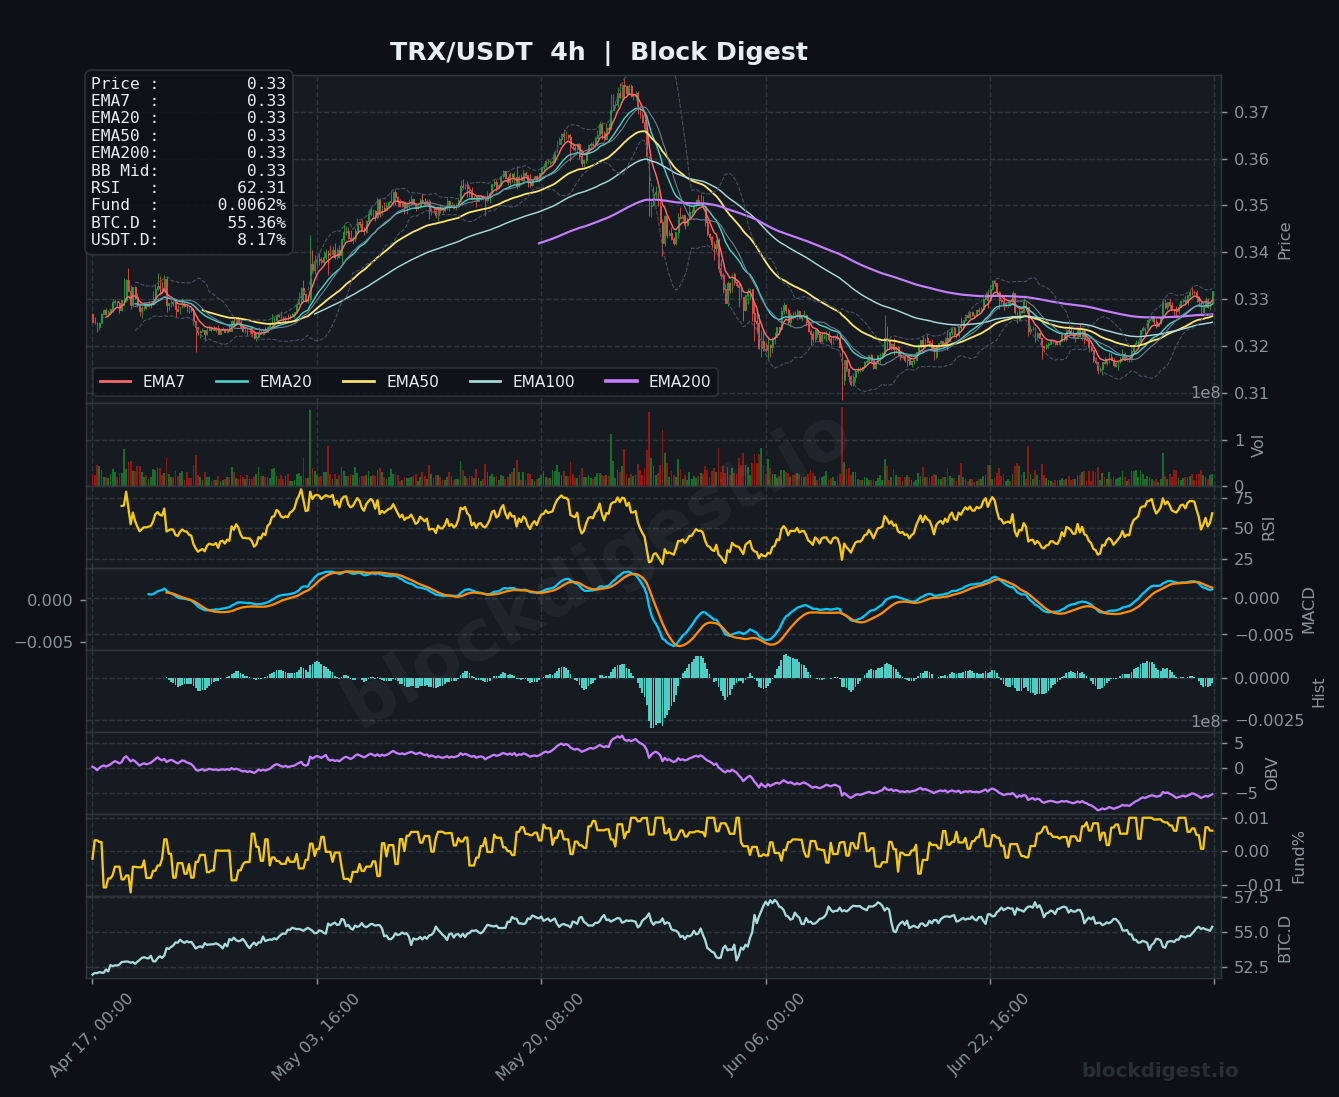
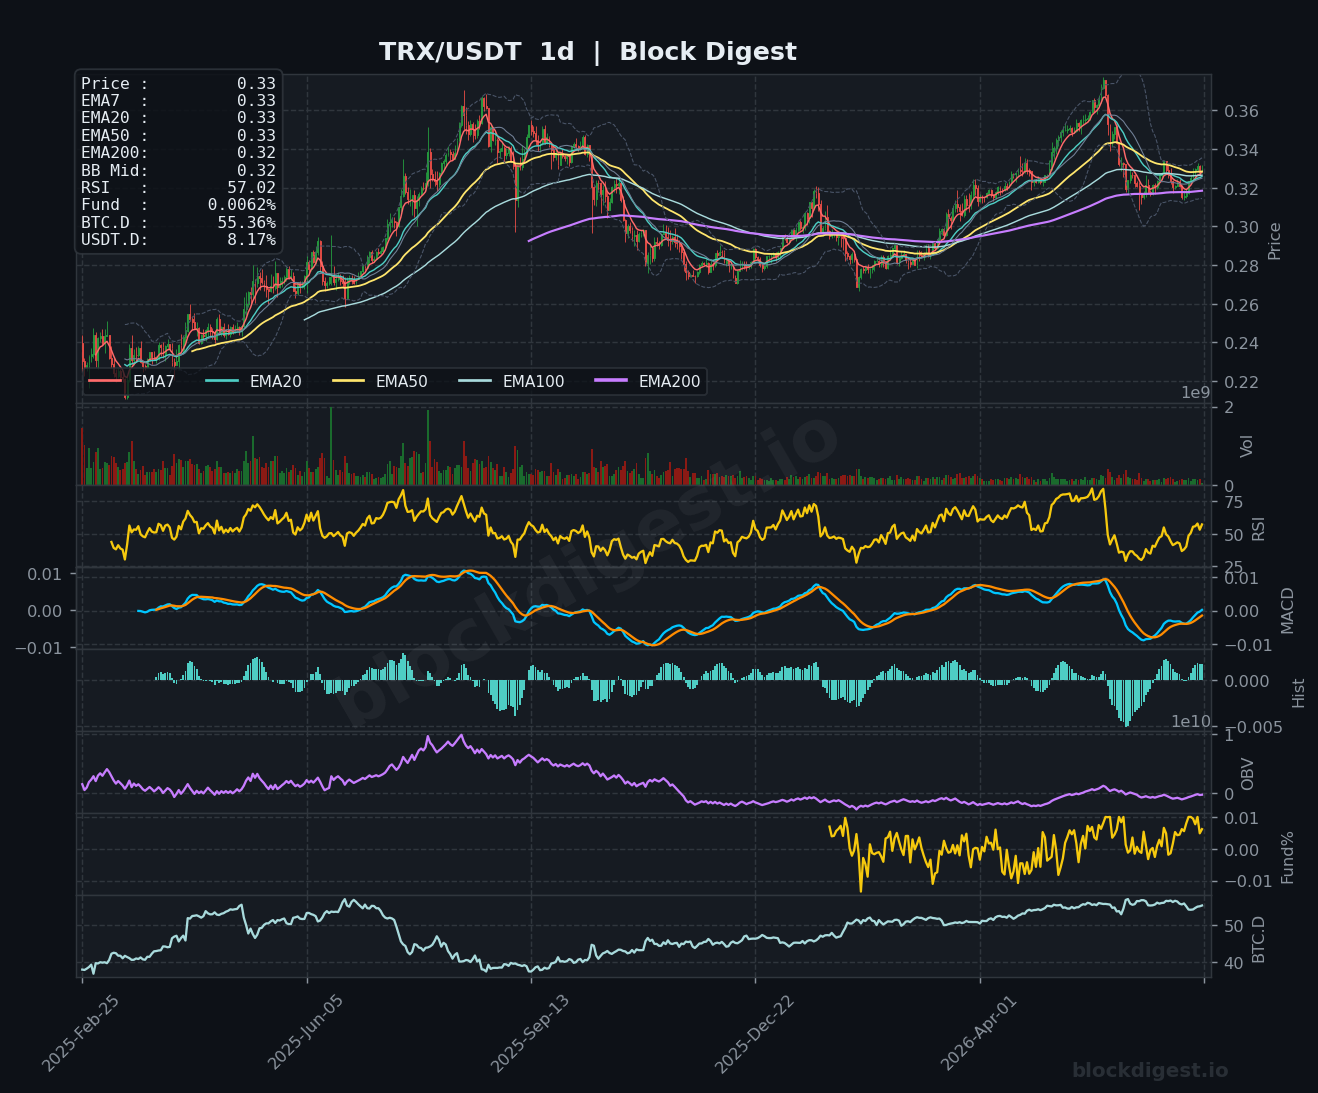
TRX stands out as the relative outperformer in today’s altcoin review, trading at $0.33 with the 1h RSI at 65.19 — the highest reading across all coins analyzed — and price holding above all key short-term EMAs on the hourly chart. The 4h RSI at 62.31 further validates the constructive momentum, with the MACD making a bullish move back toward and above the zero line, and OBV on the 4h recovering off its lows in a healthy manner. On the daily chart, RSI sits at 57.02 and price is consolidating just above the EMA200 ($0.32) — a notably bullish distinction compared to peers, most of which are trading well beneath their 200-day EMAs. Key resistance lies at the $0.335–$0.336 area (recent highs visible on the 1h chart), and a confirmed break above that level could target $0.340–$0.345; the short-term bias for TRX is the most constructive of the group, though broader market headwinds remain a constraint.
Altcoin Outlook
The overall altcoin setup for July 9, 2026, is cautious, with macro headwinds from Middle East geopolitical risk and elevated BTC dominance suppressing risk appetite across the board. TRX is the clear relative strength leader, holding above its daily EMA200 and posting the strongest RSI readings across timeframes, while DOGE presents the weakest technical configuration with deteriorating daily momentum and no credible support base in sight. BNB offers the most interesting medium-term narrative given its layer-1 development catalyst and improving short-term structure, but macro resistance remains a major obstacle for a sustained recovery. Traders should watch for a stabilization in Bitcoin above the $62,000 level and any meaningful decline in USDT.D below 8% as key conditions that could restore broader altcoin buying interest — until those conditions materialize, range-trading and capital preservation remain the prudent posture.
Disclaimer: This analysis is for informational purposes only and does not constitute financial advice. Cryptocurrency markets are highly volatile and unpredictable. All trading decisions should be made based on your own research and risk tolerance. Block Digest is not responsible for any financial losses incurred as a result of acting on this content.
Stay Ahead of the Market
Follow BlockDigest for crypto market intelligence, research and real-time updates.


