
Market Overview
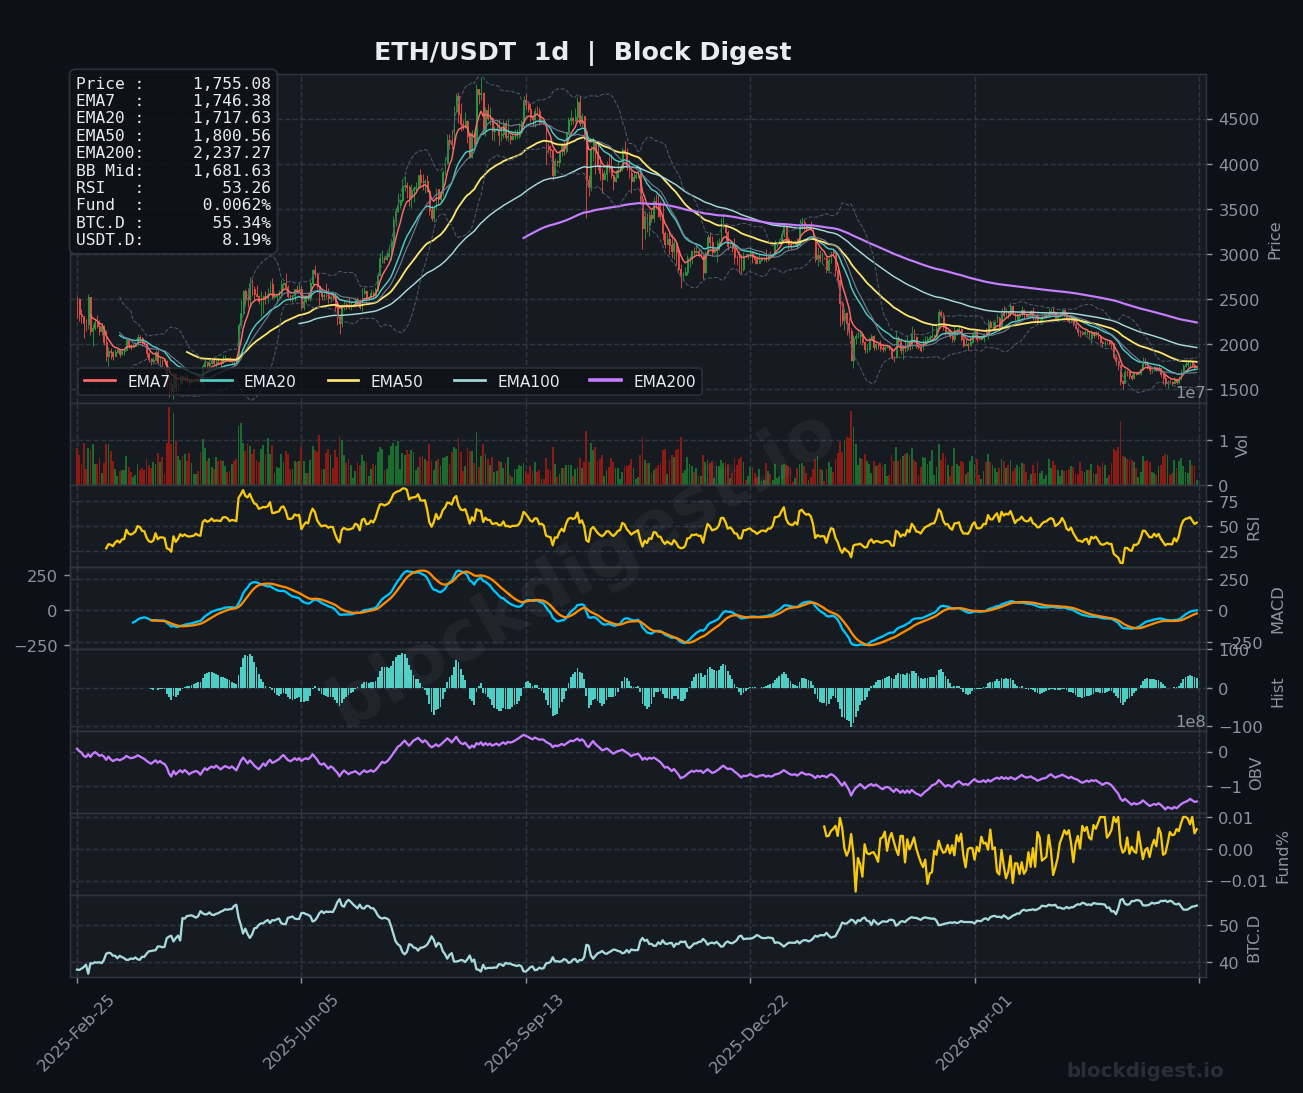
ETH/USDT is currently trading at approximately $1,755, situated in a technically ambiguous zone after a meaningful recovery from the mid-cycle lows near $1,550. On the daily timeframe, the dominant structure remains broadly bearish — price sits well below the EMA200 ($2,237) and EMA50 ($1,800), both of which are sloping downward and acting as dynamic overhead resistance. However, the shorter-term picture shows some constructive stabilization, with price trading above the daily BB midline ($1,681) and attempting to hold the EMA7 ($1,746) and EMA20 ($1,717) as near-term supports. The Bollinger Bands on the daily frame have begun to contract, suggesting a directional move may be approaching.
Multi-Timeframe Confluence
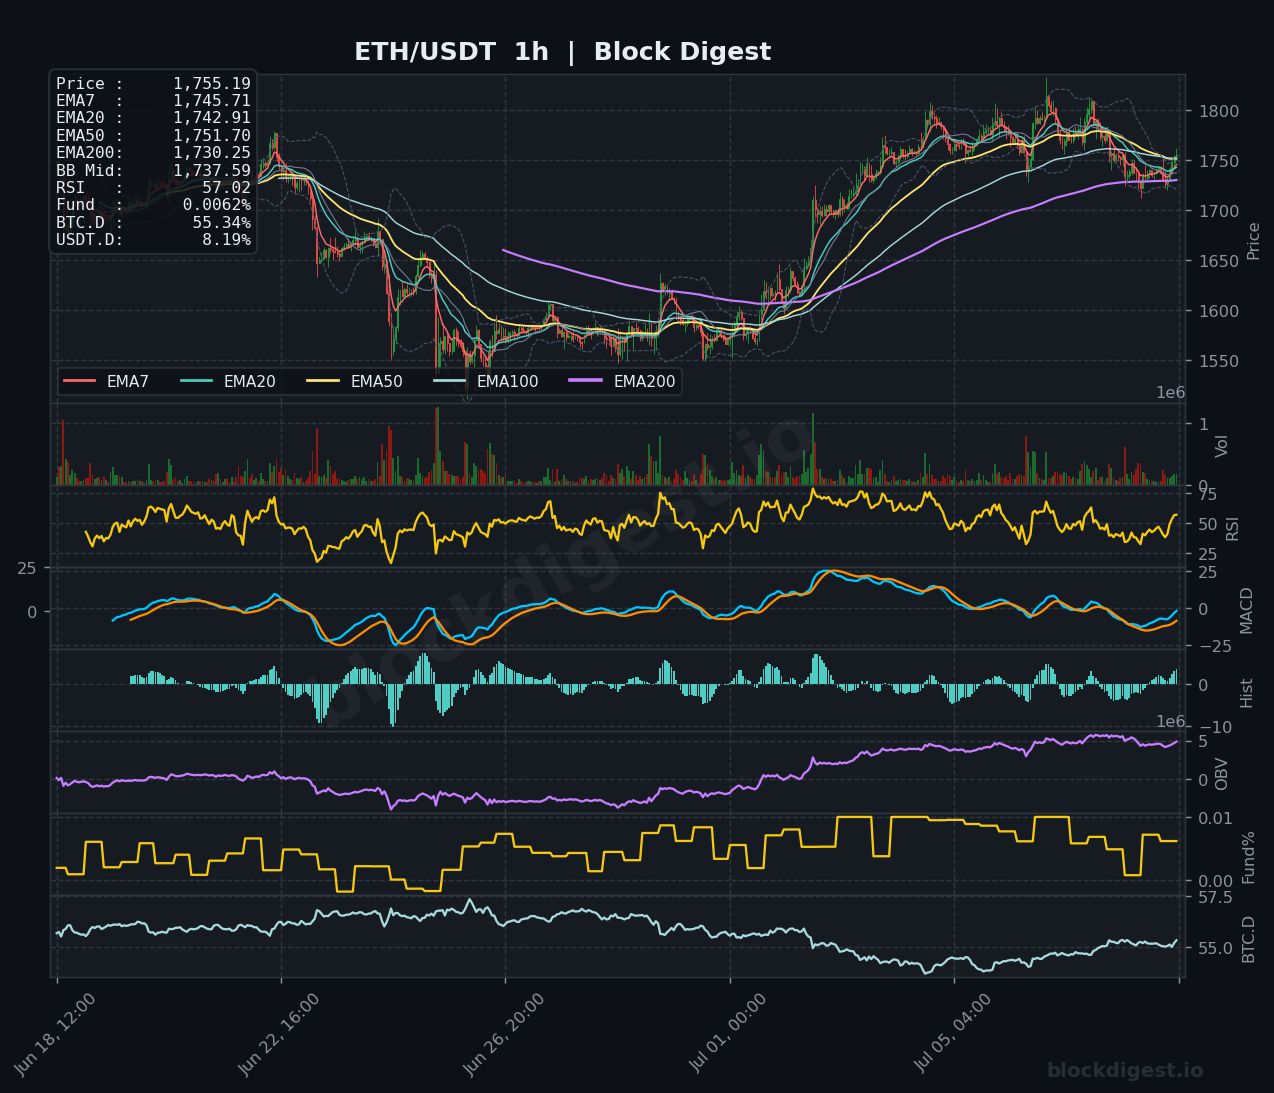
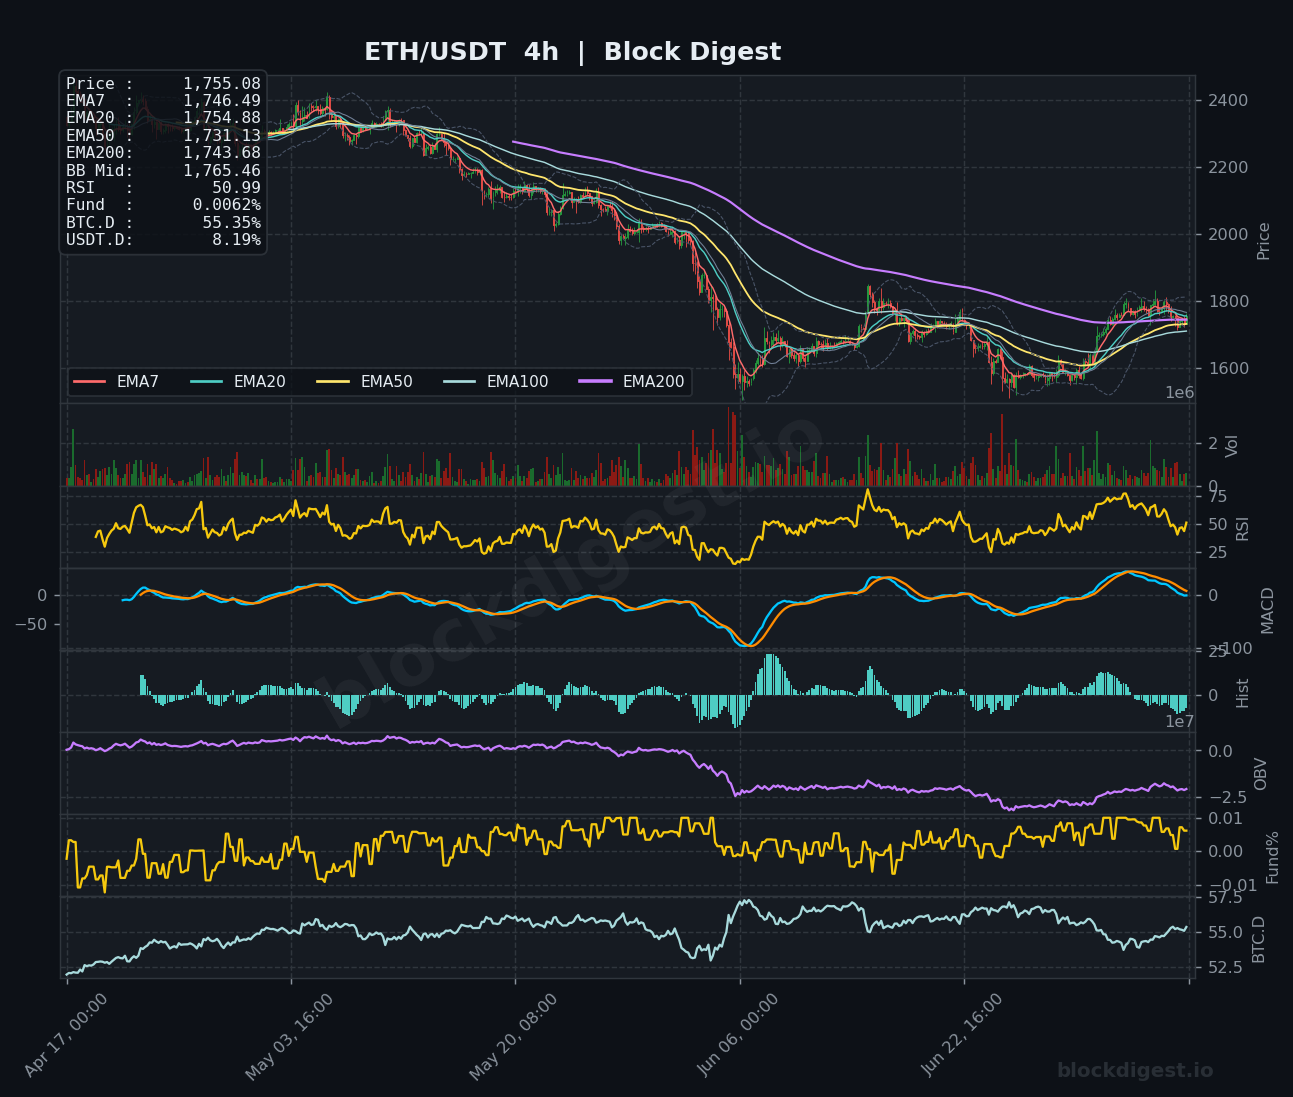
On the 1-hour chart, ETH is trading above all short-term EMAs (EMA7 at $1,745, EMA20 at $1,742, EMA50 at $1,751), with price at $1,755 showing tentative short-term strength. The 4-hour chart paints a more cautious picture — price is pressing against the EMA20 ($1,754) from below, with the BB midline at $1,765 acting as the next meaningful resistance, and the RSI sitting at a neutral 50.99, indicating genuine indecision. The daily chart confirms the overarching bearish macro structure, with all major EMAs above current price and still declining, making any near-term bounce a counter-trend move until proven otherwise. The $1,750–$1,765 zone is the most critical area of confluence across all three timeframes, where multiple EMAs converge.
Key Levels to Watch
- Resistance: $1,765 — 4h BB midline and short-term supply cluster; reclaiming this level on a 4h close would be an early bullish signal
- Resistance: $1,800 — Daily EMA50, a major structural resistance level that has capped multiple recovery attempts and would be a key hurdle for any sustained bullish trend
- Resistance: $1,850–$1,870 — Previous consolidation highs and the upper Bollinger Band region on the daily frame; full recovery target for bulls in the near term
- Support: $1,730 — 1h EMA200 and a key intraday pivot; losing this level on an hourly close would invalidate the short-term constructive setup
- Support: $1,680–$1,700 — Daily BB midline ($1,681) and a confluence of recent demand; a critical line in the sand for the medium-term recovery thesis
- Support: $1,550–$1,580 — Recent swing lows; a breakdown to this level would signal a significant deterioration in market structure
Momentum & On-Chain Signals
The 1-hour RSI at 57.02 leans modestly bullish but has not reached overbought territory, leaving room for upside. The 4-hour MACD is showing a tentative bullish crossover attempt, with the histogram compressing near zero — a cross above the signal line would add conviction to any 4h recovery move. On the daily chart, the RSI has recovered to 53.26 from deeply oversold levels, which is encouraging, but the daily MACD remains negative and the histogram bars, while shrinking, have not yet flipped positive. The OBV on the 1-hour chart has been trending upward in recent sessions, suggesting accumulation is occurring at current levels, though the 4-hour OBV remains at depressed levels consistent with the broader distribution phase seen over prior months — institutional appetite from entities like BitMine adding $74M in ETH may be reflected in this improving on-chain flow.
BTC Dominance & Market Sentiment
BTC dominance is currently at 55.34–55.35%, a level that remains elevated and historically unfavorable for altcoin outperformance, suggesting ETH continues to underperform relative to Bitcoin in the current risk environment. USDT dominance at 8.19% indicates a notable amount of capital remains sidelined in stablecoins, reflecting the risk-off posture that has intensified following the U.S. airstrikes on Iranian targets and renewed Middle East hostilities. Until BTC.D shows a clear and sustained rollover from current levels, ETH’s recovery attempts are likely to remain capped and choppy.
Risk Scenarios
- Bullish case: A confirmed 4-hour close above $1,765, followed by a reclaim of the $1,800 daily EMA50, would signal a meaningful shift in structure and open targets toward $1,850–$1,870. This scenario gains credibility if BTC.D begins to roll over from the 55.3% area and geopolitical tensions de-escalate, unlocking suppressed risk appetite.
- Bearish case: A 4-hour close below $1,730 (1h EMA200) and failure to hold the $1,700 level would confirm a resumption of the broader downtrend, with the next significant support cluster at $1,550–$1,580. Escalating Middle East conflict driving further risk-off flows would accelerate this scenario.
Outlook
The near-term directional bias is cautiously neutral-to-mildly bullish on the 1-hour timeframe, but the weight of evidence on higher timeframes continues to favor the bears until ETH reclaims the $1,800 daily EMA50 on a sustained basis. The $1,750–$1,765 confluence zone is the decisive battleground in the next 24–48 hours — bulls need to hold it as support while bears will look to defend it as resistance. The geopolitical escalation in the Middle East introduces a meaningful macro headwind that could override any technical setup, and traders should remain alert to headline risk compressing risk appetite across the board. The developing Clarity Act narrative and institutional accumulation from players like BitMine provide a medium-term fundamental tailwind, but in the immediate term, macro uncertainty and elevated BTC dominance are the dominant forces shaping ETH’s price action.
Disclaimer: This analysis is for informational purposes only and does not constitute financial advice. Cryptocurrency markets are highly volatile and unpredictable. All trading decisions should be made based on your own research and risk tolerance. Block Digest is not responsible for any financial losses incurred as a result of acting on this content.
Stay Ahead of the Market
Follow BlockDigest for crypto market intelligence, research and real-time updates.


