
trading
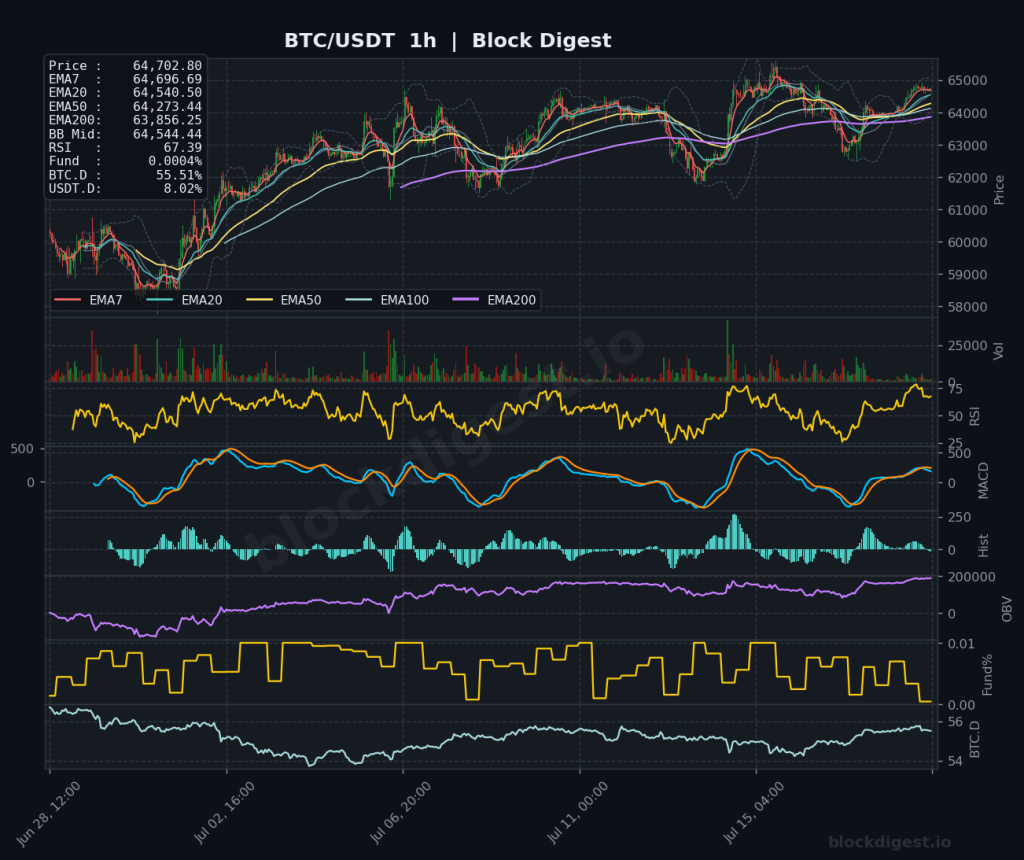
Bitcoin Daily Analysis: BTC Recovery Above EMA7 Faces EMA50 Resistance
Market Overview BTC/USDT is currently trading at $64,702.90, sitting in a recovery phase following a significant multi-month drawdown from prior all-time highs above $108,000. On the daily timeframe, price is trading above the EMA7 ($64,254) and EMA20 ($63,615), signaling short-term bullish structure, but remains firmly beneath the EMA50 ($65,003) and EMA200 ($74,112) — both of...

Ethereum Daily Analysis: ETH consolidates at $1,842 above key moving averages
Market Overview ETH/USDT is currently trading at $1,842.98, consolidating in a narrow range after a notable recovery from multi-month lows near $1,550 printed earlier in the cycle. On the daily timeframe, price has reclaimed both the EMA7 ($1,841.01) and EMA20 ($1,790.91), and is pushing above the EMA50 ($1,811.65) — a constructive development that suggests the...

Bitcoin Daily Analysis: BTC at $63.9K Below EMA50 Resistance
Market Overview BTC/USDT is currently trading at $63,982.40, sitting in a technically ambiguous zone following a pullback from the recent $65,500 high. On the daily timeframe, price remains in a broader recovery structure after a prolonged downtrend from all-time highs, but is notably trading below the daily EMA50 ($64,983.02) and well beneath the EMA200 ($74,220.33),...

Ethereum Daily Analysis: ETH consolidates at $1,828 after pullback from $1,950
Market Overview ETH/USDT is trading at approximately $1,828–$1,829 as of July 17, 2026, consolidating after a sharp pullback from a recent local high near $1,950. On the daily timeframe, price has recovered meaningfully from multi-month lows below $1,500 set in early 2026, and is now trading above the daily EMA7 ($1,837), EMA20 ($1,784), and EMA50...
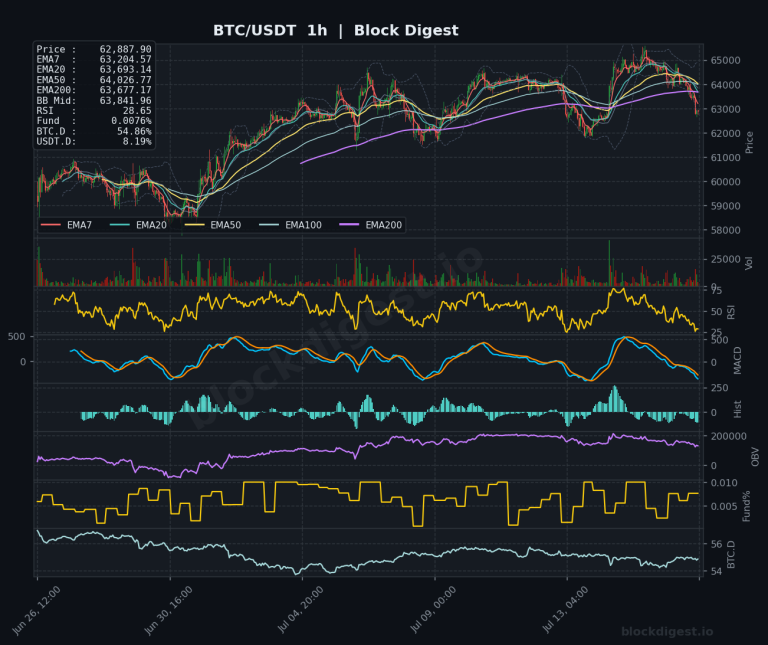
Bitcoin Daily Analysis: Bitcoin at $62.8K Faces EMA Overhead Resistance
Market Overview Bitcoin is currently trading at $62,887.90, sitting beneath a tightly clustered band of EMAs on the daily timeframe — EMA7 at $63,615, EMA20 at $63,266, and EMA50 at $64,983 — all of which are acting as immediate overhead resistance. Price is trading below the daily Bollinger Band midline at $62,621, though it has...

Ethereum Daily Analysis: Ethereum Reclaims EMA7 Above $1,906
Market Overview Ethereum is trading at approximately $1,906.89 as of July 16, 2026, having staged a notable recovery off multi-month lows that briefly tested the $1,550–$1,600 range. On the daily timeframe, price has reclaimed the EMA7 ($1,850.91), EMA20 ($1,783.68), and EMA50 ($1,810.81), signaling a meaningful shift in near-term structure. However, the daily EMA200 sitting at...
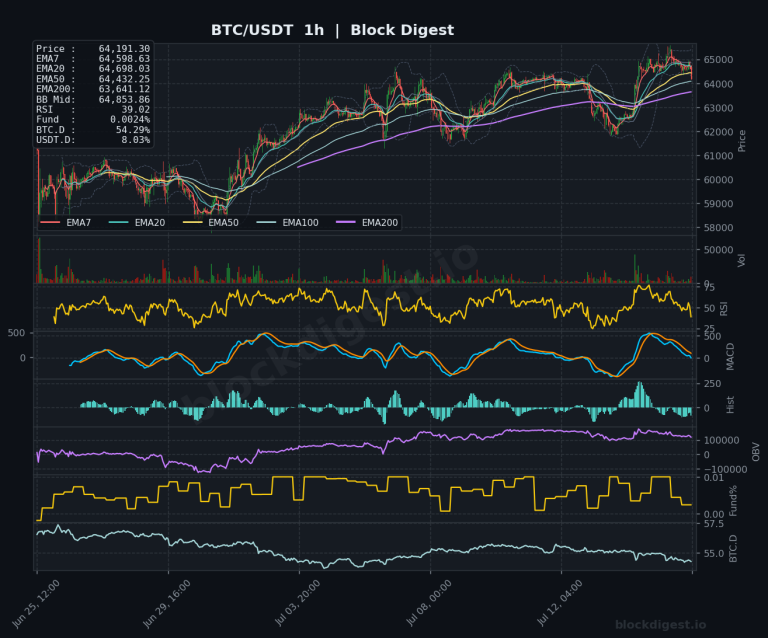
Bitcoin Daily Analysis: Bitcoin Consolidates at $64K, Reclaims Key Moving Averages
Market Overview Bitcoin is trading at approximately $64,193 as of July 16, 2026, consolidating after a recent push to the $65,500 three-week high. On the daily timeframe, price remains caught in a structural recovery attempt following a prolonged downtrend from the all-time high of $126,080, now sitting roughly 48.6% below that peak. Notably, BTC has...

Ethereum Daily Analysis: Ethereum Breaks Upper Bollinger Band at $1,868
Market Overview Ethereum is trading at $1,868.42, up 6.67% on the day, following a cooler-than-expected June CPI print that reinvigorated risk appetite across crypto markets. Price is pressing against the upper Bollinger Band on the 1-hour chart with the BB midline sitting at $1,874.63, suggesting short-term extension but not yet exhaustion. On the 1-hour timeframe,...

Bitcoin Daily Analysis: Bitcoin holds $64.6K above Bollinger midlines
Market Overview Bitcoin is trading around $64,594 on July 15, 2026, sitting above the Bollinger Band midline on the 1-hour chart ($64,593) and just above the 4-hour BB midline ($63,572), suggesting short-term bullish positioning. On the daily timeframe, price remains below the EMA50 ($65,116) — a critical resistance level that has capped multiple recovery attempts...

Ethereum Daily Analysis: Ethereum Consolidates Between EMA50 Resistance and EMA20 Support
Market Overview Ethereum is currently trading at $1,779.96, down approximately 1.31% over the past 24 hours, consolidating in a narrow band after a notable recovery from cycle lows. On the daily timeframe, price remains sandwiched between the EMA50 at $1,798.04 — acting as immediate overhead resistance — and the EMA20 at $1,744.73, which has been...

Bitcoin Daily Analysis: Bitcoin Below Key EMAs Amid 30% Decline
Market Overview Bitcoin is currently trading at $62,537, sitting in a precarious position below all major EMAs on the daily timeframe. The daily chart confirms a dominant downtrend that has been in place since early 2026, with price having shed roughly 30% from its highs above $93,000. Price is trading just above the daily Bollinger...
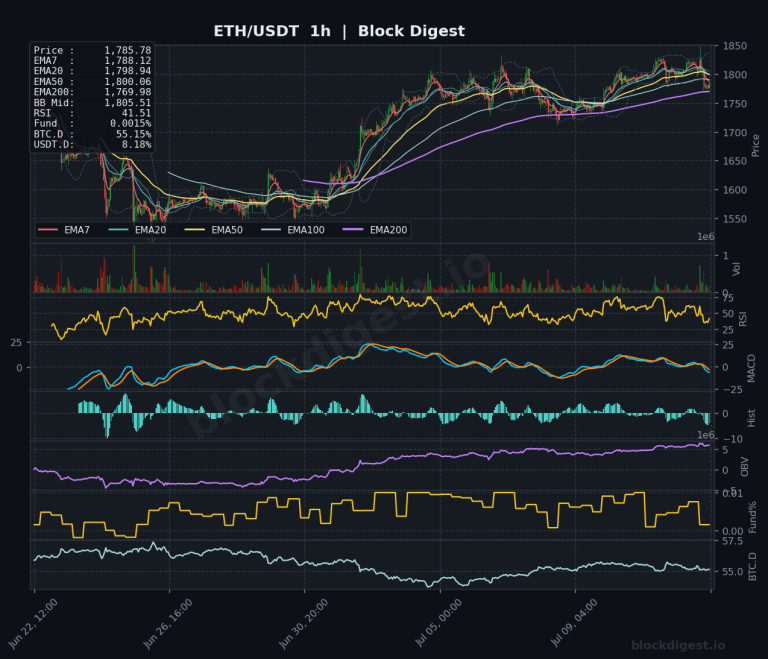
Ethereum Daily Analysis: ETH Below EMA50 as Bearish Structure Persists
Market Overview ETH/USDT is currently trading at $1,785.88, situated in a technically precarious position as it attempts to consolidate after a significant multi-month downtrend visible on the daily chart. Price is trading below the daily EMA200 ($2,217.93) and just beneath the EMA50 ($1,799.16), confirming that the broader macro structure remains bearish. On the daily Bollinger...