Bitcoin Daily Analysis: BTC at $63.9K Below EMA50 Resistance
Market Overview
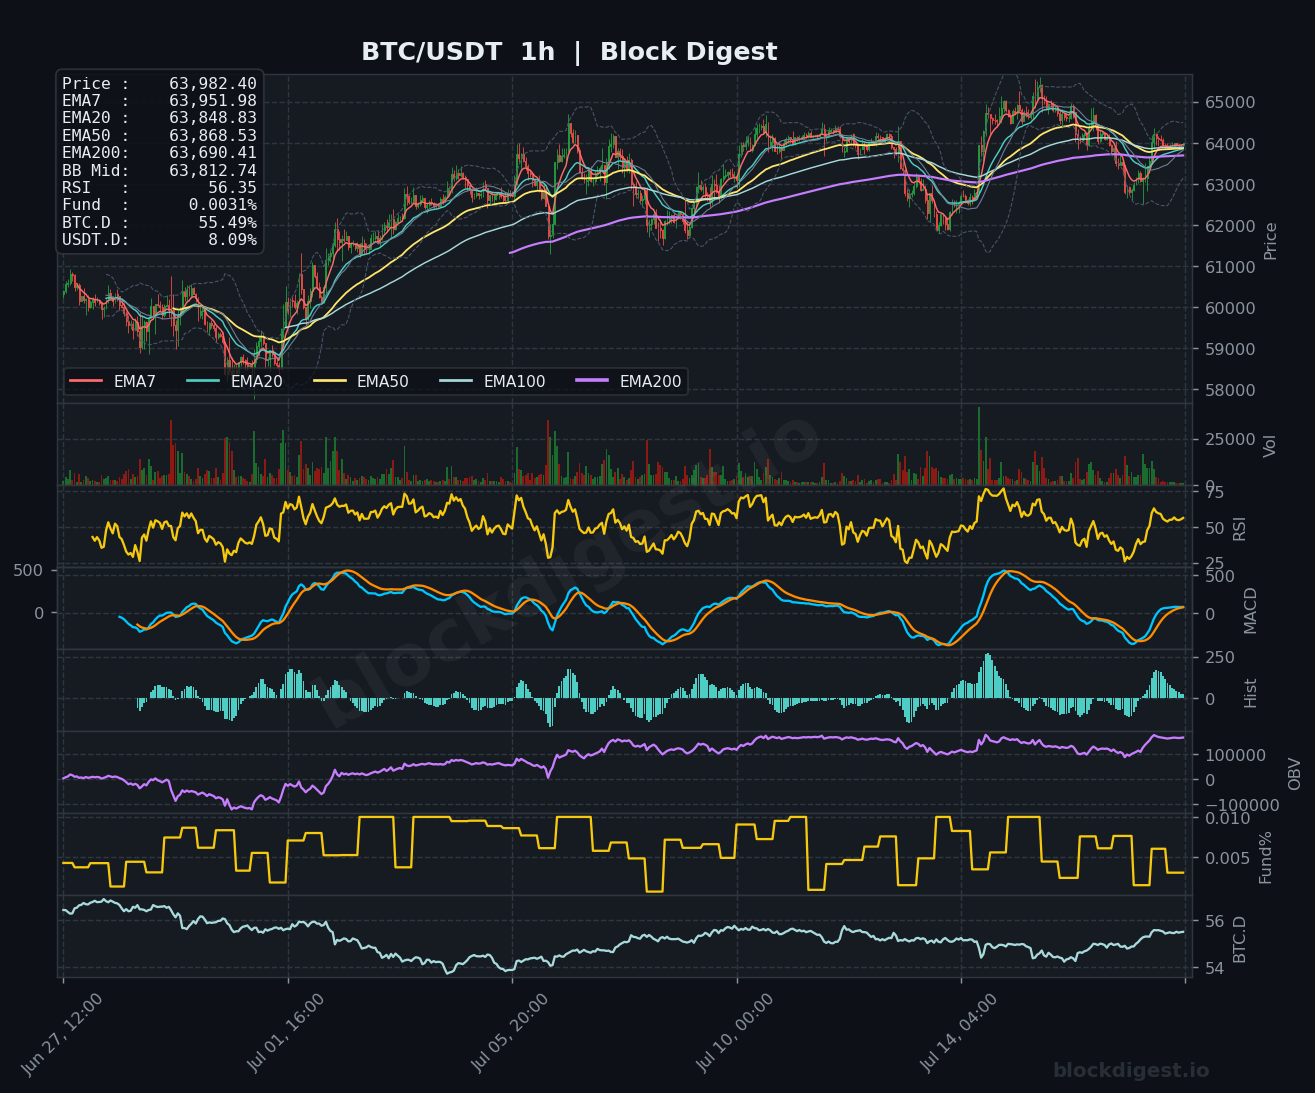
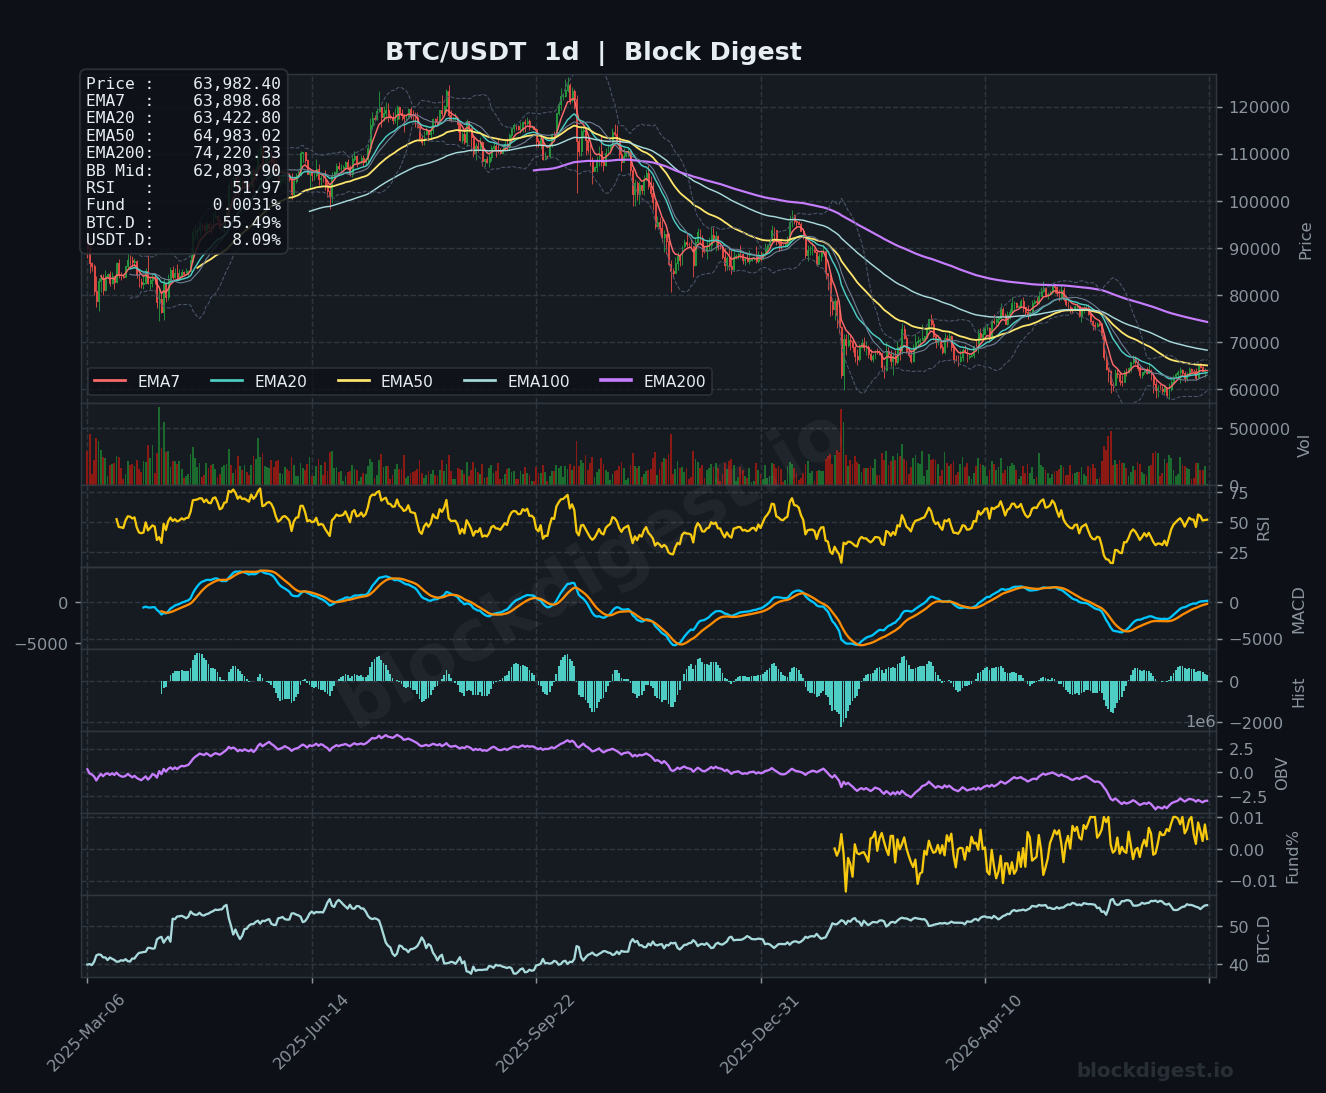
BTC/USDT is currently trading at $63,982.40, sitting in a technically ambiguous zone following a pullback from the recent $65,500 high. On the daily timeframe, price remains in a broader recovery structure after a prolonged downtrend from all-time highs, but is notably trading below the daily EMA50 ($64,983.02) and well beneath the EMA200 ($74,220.33), confirming that the macro trend remains bearish. Price is trading just above the Bollinger Band midline ($62,893.90) on the daily chart, suggesting a tentative hold of near-term support. The semiconductor-driven risk-off environment has capped upside momentum and is keeping BTC range-bound beneath key overhead EMAs.
Multi-Timeframe Confluence
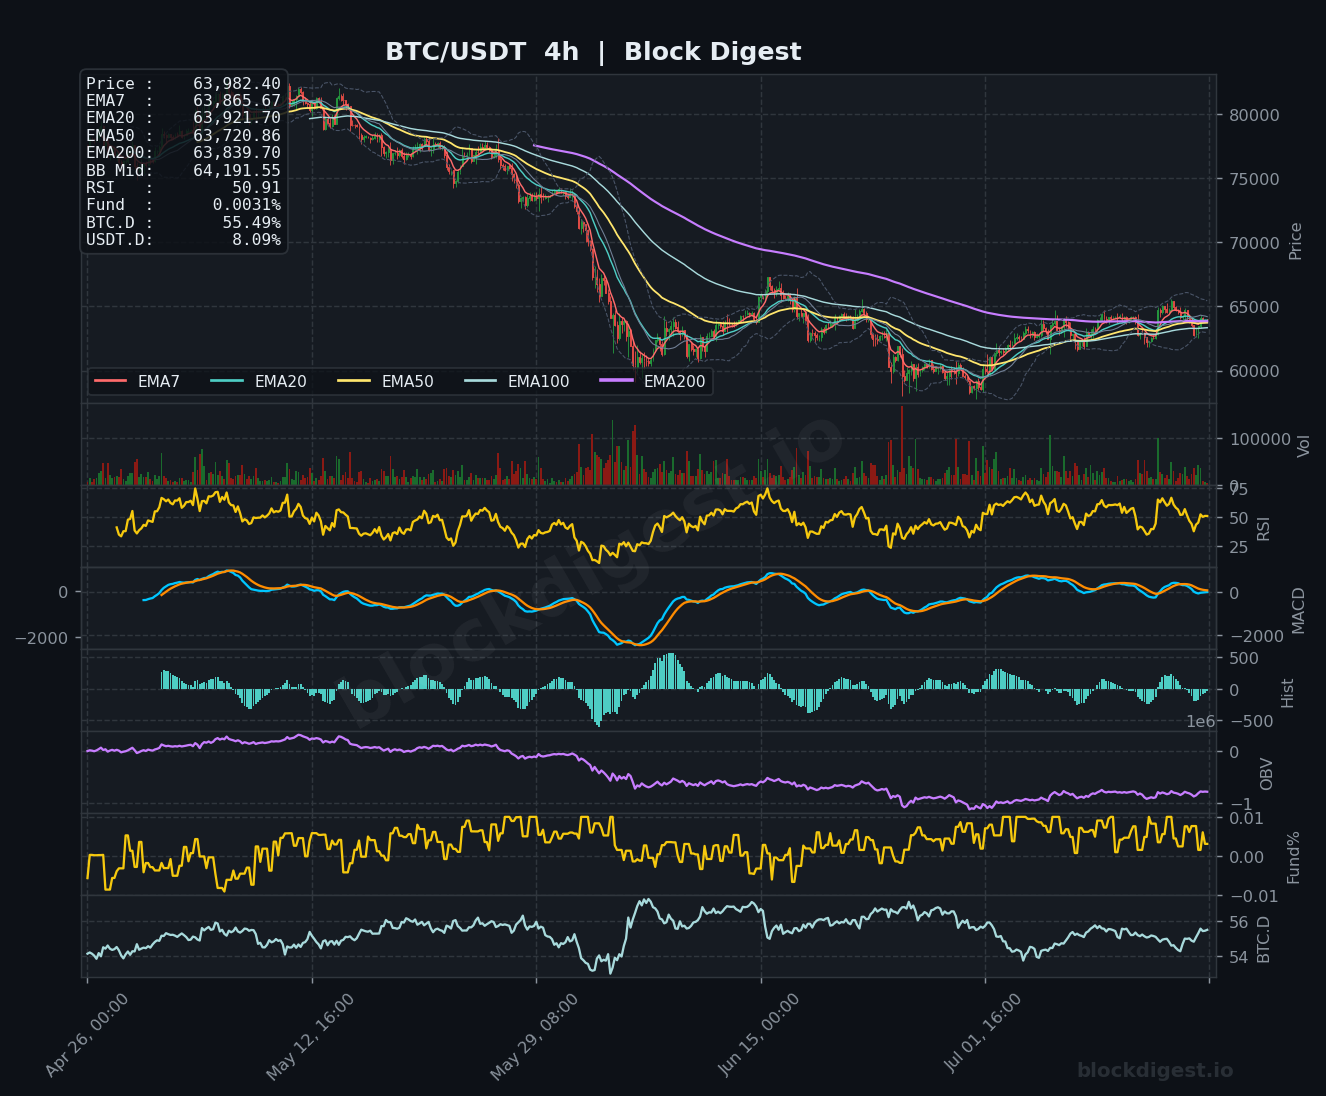
On the 1-hour chart, price is trading above all short-term EMAs (EMA7: $63,951 / EMA20: $63,848 / EMA50: $63,868), indicating intraday bullish structure, though the EMA cluster is tightly compressed — a sign of indecision rather than conviction. The 4-hour chart shows a more cautious picture: price is attempting to reclaim the EMA7 ($63,865) and EMA20 ($63,921) from below, while the EMA200 ($63,839) on the 4h frame is acting as near-term dynamic support. Critically, the daily EMA50 at $64,983 represents the most significant overhead confluence across timeframes, and failure to reclaim this level would keep the medium-term structure bearish. Short-term momentum mildly supports higher-timeframe recovery attempts, but has yet to confirm a breakout.
Key Levels to Watch
- Resistance: $64,983 — Daily EMA50; the single most important overhead level; reclaiming this on a daily close would shift medium-term bias bullish
- Resistance: $65,500 — Recent swing high and weekly rejection zone; this week’s failed breakout attempt above this level reinforces it as a near-term ceiling
- Resistance: $66,200–$67,000 — Prior consolidation structure and 4h EMA200 convergence zone; a decisive break here would target the $70,000 region
- Support: $63,400–$63,500 — 1h EMA200 ($63,690) and daily BB midline ($62,893) cluster zone; the first meaningful demand area on a pullback
- Support: $62,500–$62,800 — Recent swing lows and lower Bollinger Band boundary on the daily; breakdown below would accelerate selling pressure
- Support: $60,800–$61,000 — Prior structural lows visible on the 4h chart; a test here would constitute a significant technical deterioration
Momentum & On-Chain Signals
The RSI readings across timeframes tell a broadly neutral story: 1h RSI at 56.35, 4h at 50.91, and daily at 51.97 — all hovering near the midpoint with no clear directional edge. The 4h MACD is showing a tentative bullish crossover with the signal line, with the histogram just turning positive, though the magnitude remains shallow and unconvincing. The daily MACD is also attempting a bullish cross from deeply negative territory, which would be encouraging if sustained. OBV on the 4h chart has been gently recovering from its lows, suggesting modest accumulation, though the daily OBV trend remains in a mild downtrend — a divergence worth monitoring. Funding rates at 0.0031% are essentially neutral, indicating no excessive leverage in either direction.
BTC Dominance & Market Sentiment
BTC.D sits at 55.49%, holding near the upper end of its recent range, which reflects continued capital concentration in Bitcoin relative to altcoins amid macro uncertainty. USDT.D at 8.09% indicates a meaningful portion of market participants remain in stablecoins, signaling risk-off positioning and a potential dry-powder scenario should sentiment shift positively. The combination of elevated BTC dominance and high stablecoin dominance suggests the broader market is in a cautious, defensive posture — consistent with the geopolitical and macro headwinds from U.S.-China tensions and the chipmaker selloff.
Risk Scenarios
- Bullish case: A decisive daily close above the EMA50 at $64,983, supported by rising 4h MACD momentum and improving OBV, would open a path toward $65,500 and potentially the $67,000–$68,000 range. Easing macro risk — particularly a stabilization in the semiconductor sector — could act as the catalyst for this move.
- Bearish case: A breakdown below $62,800 on the daily chart, confirmed by RSI falling below 45 and renewed negative MACD divergence on the 4h, would expose the $60,800 support zone and invalidate the current recovery thesis.
Outlook
The immediate bias is cautiously neutral-to-bullish on the short term, with price holding above key short-term EMAs on the 1h chart and momentum indicators sitting near equilibrium. However, the daily EMA50 at $64,983 remains the defining line in the sand — until BTC reclaims and sustains above this level, any bounce should be treated as a relief rally within a broader bearish structure. The next 24–48 hours are critical: watch for either a consolidation above $63,800 that builds toward an EMA50 test, or a loss of the $63,400 zone that could trigger a deeper retest toward $62,500. Macro developments — particularly any further fallout from chipmaker equities or U.S.-China trade rhetoric — remain the primary external risk variable capable of overriding technical setups in either direction.
Disclaimer: This analysis is for informational purposes only and does not constitute financial advice. Cryptocurrency markets are highly volatile and unpredictable. All trading decisions should be made based on your own research and risk tolerance. Block Digest is not responsible for any financial losses incurred as a result of acting on this content.