Bitcoin Daily Analysis: BTC Recovery Above EMA7 Faces EMA50 Resistance
Market Overview
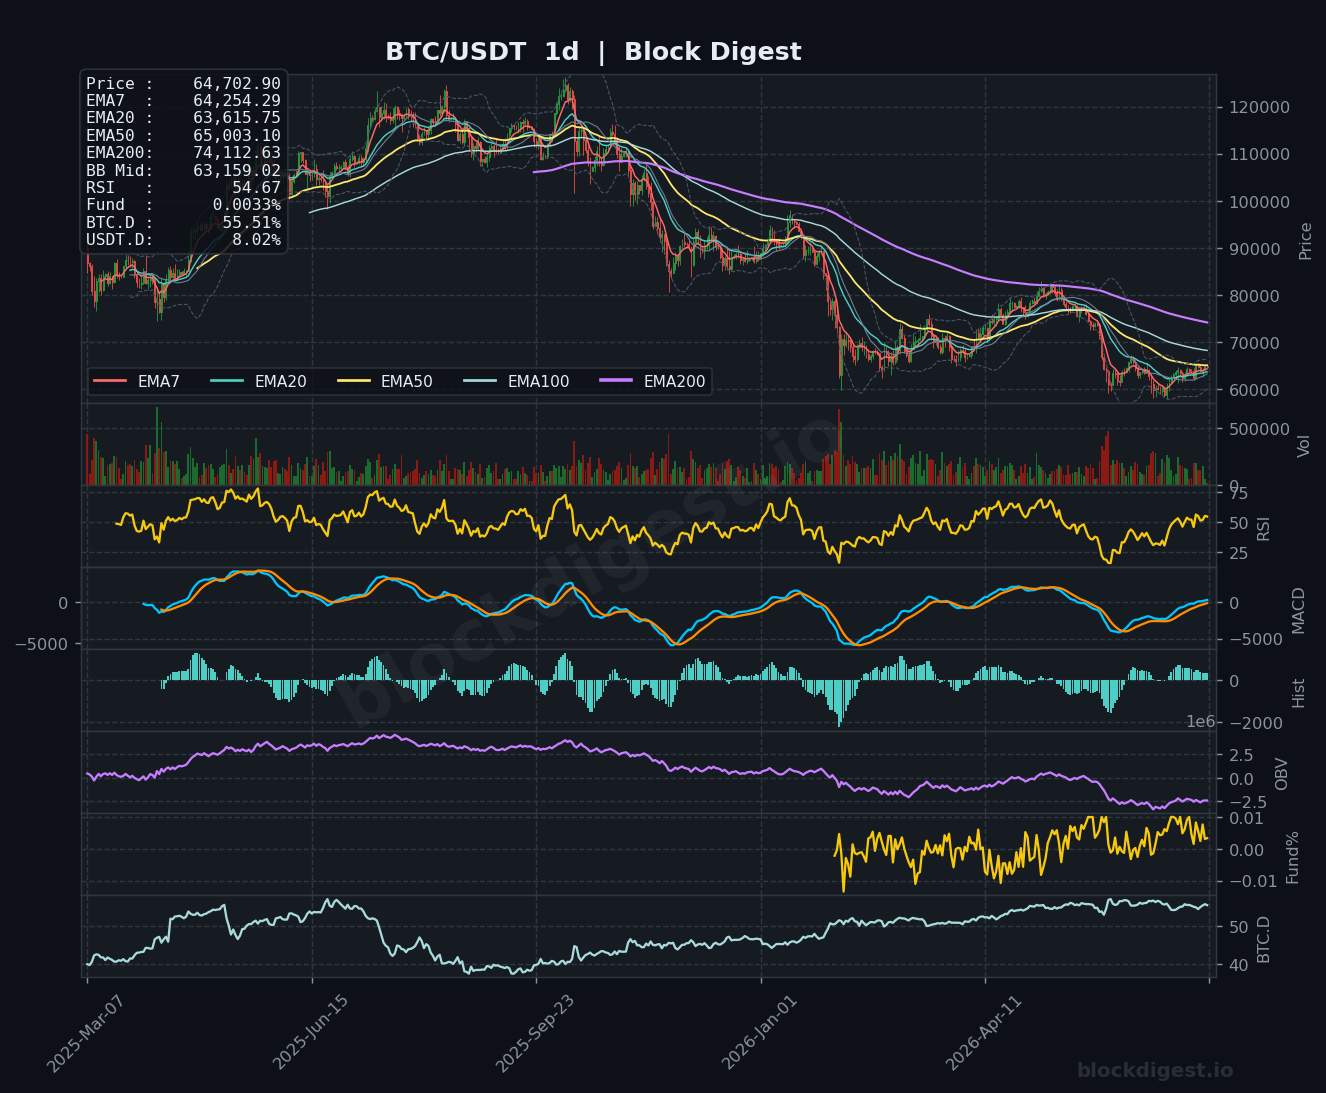
BTC/USDT is currently trading at $64,702.90, sitting in a recovery phase following a significant multi-month drawdown from prior all-time highs above $108,000. On the daily timeframe, price is trading above the EMA7 ($64,254) and EMA20 ($63,615), signaling short-term bullish structure, but remains firmly beneath the EMA50 ($65,003) and EMA200 ($74,112) — both of which continue to slope downward, reflecting the dominant intermediate bearish trend. Price is trading just above the Bollinger Band midline ($63,159) on the daily, which is an encouraging sign, though the upper band and the descending EMA50 are converging into a near-term resistance cluster around $65,000. The market structure suggests a base-building phase rather than a confirmed trend reversal.
Multi-Timeframe Confluence
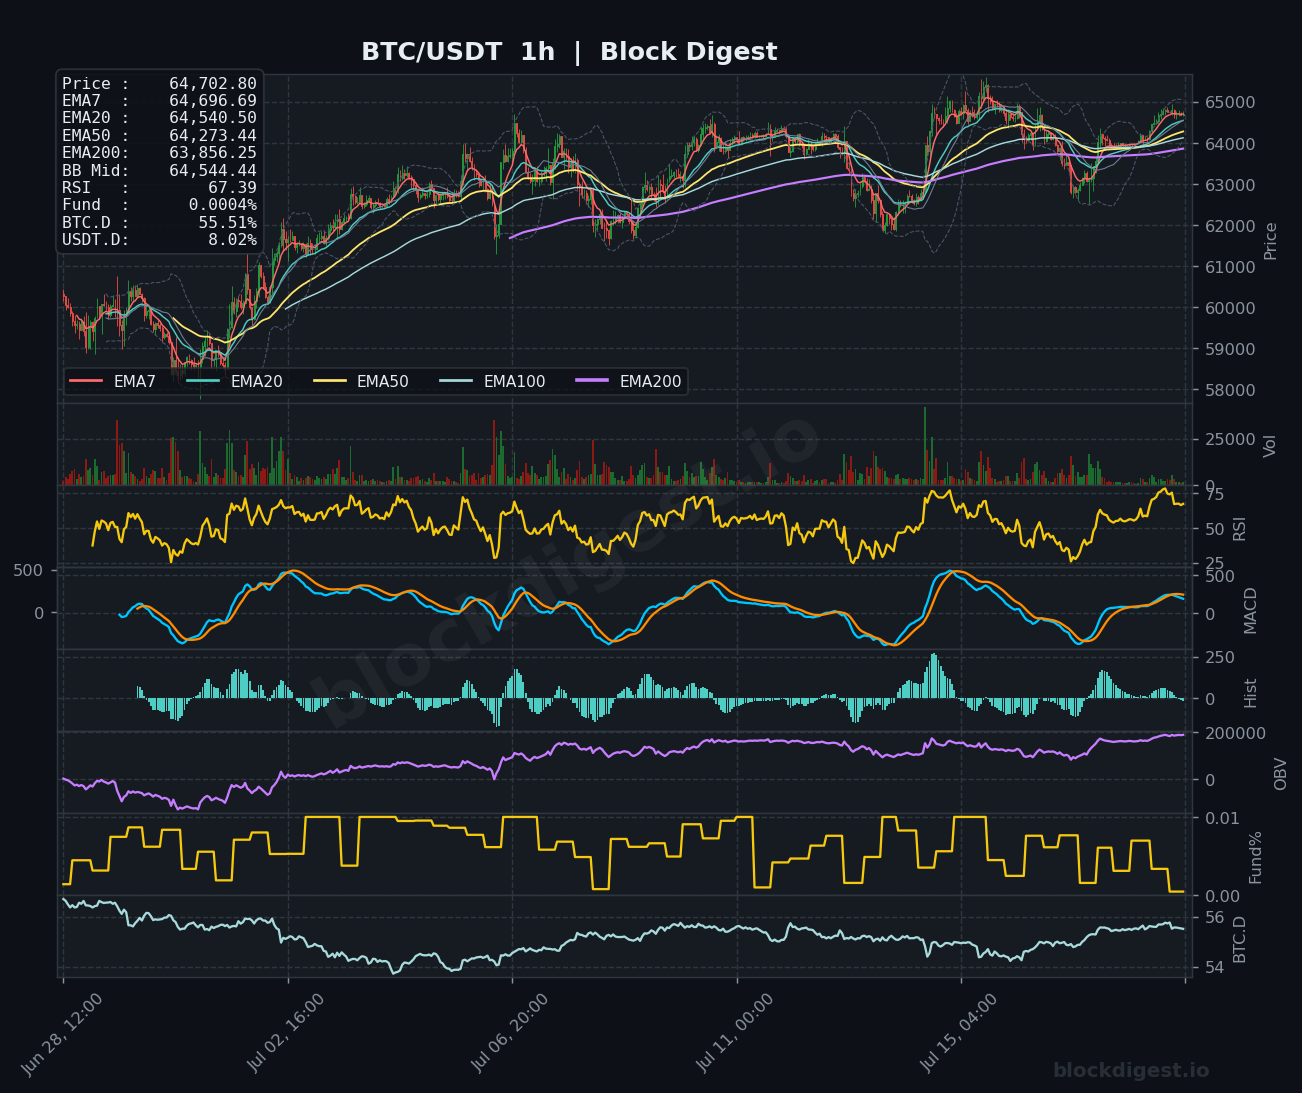
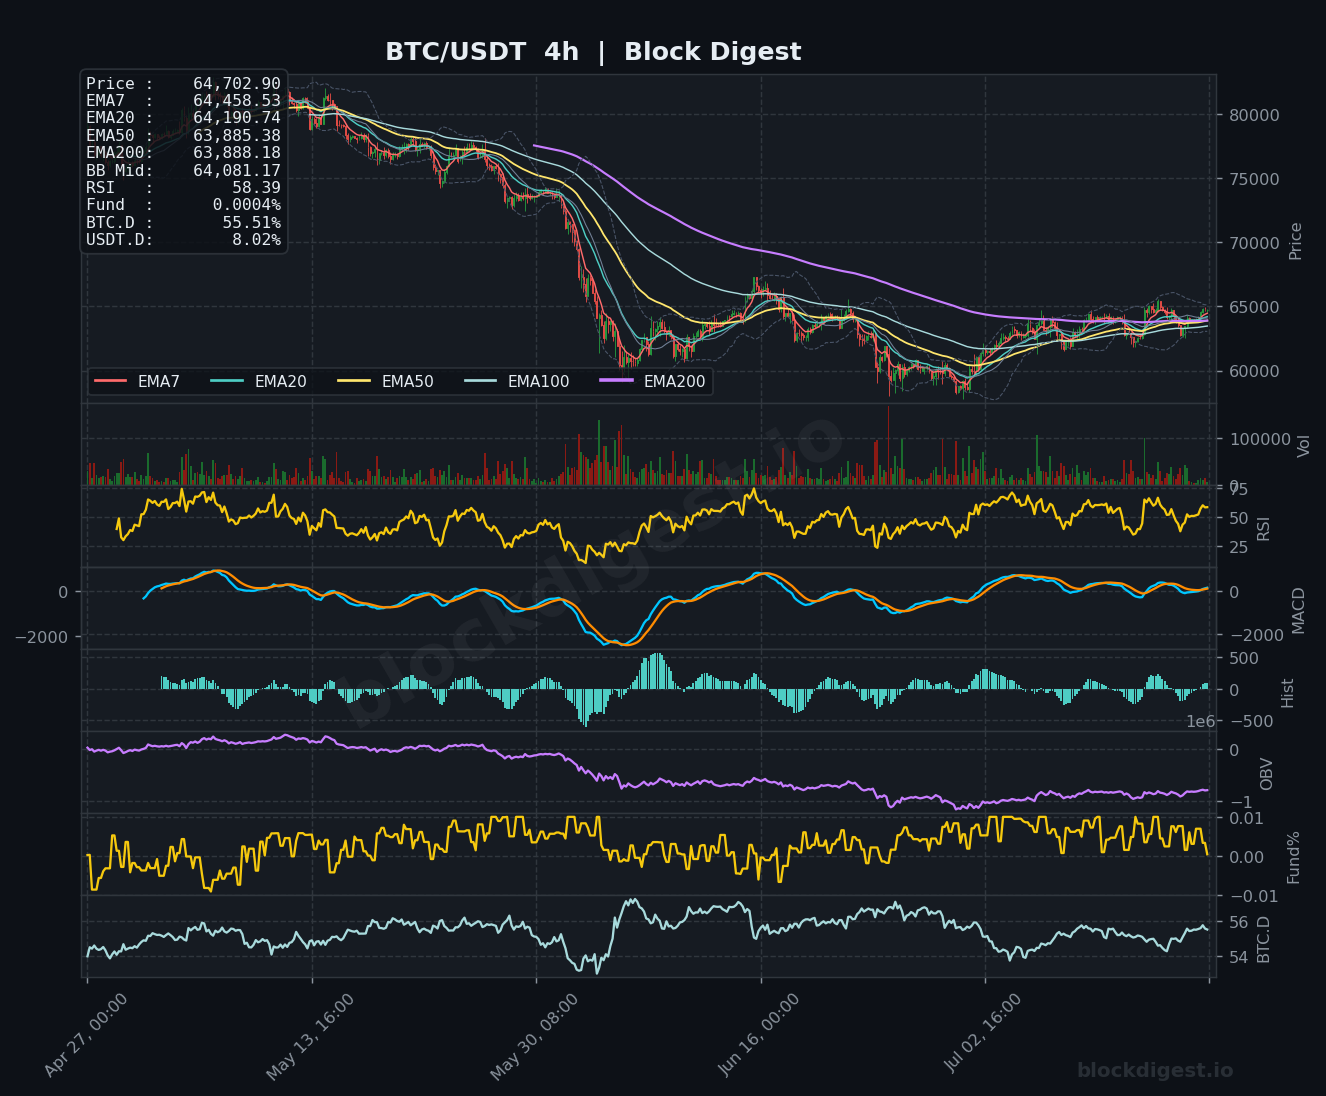
On the 1-hour chart, price at $64,702 is cleanly stacked above all short-term EMAs (EMA7: $64,696, EMA20: $64,540, EMA50: $64,273), indicating healthy intraday bullish momentum. The 4-hour chart presents a more cautious picture — price is trading above EMA7 ($64,458) and EMA20 ($64,190), but the EMA50 ($63,885) and EMA200 ($63,888) have nearly converged, suggesting the medium-term structure is still attempting to stabilize rather than trend directionally. Across all three timeframes, the $63,800–$64,100 zone emerges as a meaningful confluent support region where the 4h EMA50/200 cluster and the daily EMA20 all reside. The short-term momentum is constructive, but the 4h and daily timeframes warn that sustained upside requires clearing the $65,000 resistance decisively.
Key Levels to Watch
- Resistance: $65,000 — Daily EMA50 and recent price rejection zone; a critical ceiling that has capped multiple rally attempts and must be reclaimed to shift medium-term structure
- Resistance: $66,500–$67,000 — Upper Bollinger Band region on the 4h chart and prior consolidation ceiling; a breakout above $65,000 would likely test this area next
- Resistance: $74,000–$75,000 — Daily EMA200 ($74,112), the macro bearish trend defining level; reclaiming this would signal a genuine structural recovery
- Support: $63,800–$64,100 — Confluent 4h EMA50/200 cluster and 1h BB midline; primary near-term floor for any pullback
- Support: $63,159–$63,615 — Daily Bollinger Band midline and daily EMA20; loss of this zone would materially weaken the recovery thesis
- Support: $61,000–$62,000 — Recent swing low region visible on the 4h chart; a test here would indicate the corrective structure is resuming
Momentum & On-Chain Signals
The 1-hour RSI is elevated at 67.39, approaching overbought territory and suggesting limited immediate upside without consolidation. The 4-hour RSI at 58.39 is more neutrally positioned, leaving room for further upside without being stretched. On the daily timeframe, RSI at 54.67 is recovering from deeply oversold conditions, crossing above the midline — a constructive development, though still far from confirming a strong bullish trend. The MACD on the 4h chart shows the signal lines converging near zero with a positive but flattening histogram, indicating momentum is present but losing acceleration; the daily MACD is in a nascent bullish crossover attempt. OBV on the 4h chart remains in a downtrend from prior highs, and the daily OBV similarly has not confirmed accumulation, suggesting distribution pressure has not fully reversed despite the price recovery. Funding rates remain nearly neutral at 0.0004%–0.0033%, reflecting a balanced derivatives market without excessive leverage on either side.
BTC Dominance & Market Sentiment
BTC dominance sits at 55.51%, a relatively elevated level that suggests capital remains concentrated in Bitcoin rather than flowing into altcoins — a defensive posture consistent with a risk-cautious environment. USDT dominance at 8.02% is relatively high, indicating a meaningful portion of crypto market participants remain in stablecoins and have not yet rotated back into risk assets. Together, these readings point to a market that is cautiously watching BTC’s next move, with broader altcoin participation likely contingent on Bitcoin confirming a stronger directional break above $65,000.
Risk Scenarios
- Bullish case: A clean daily close above the EMA50 at $65,003, backed by expanding volume and a continued OBV uptick, would open the path toward $66,500–$67,000 in the near term, with the macro target remaining the EMA200 at $74,112 on a sustained recovery.
- Bearish case: Failure to hold the $63,800–$64,100 confluent EMA cluster on a 4-hour closing basis would likely trigger a retest of $62,000–$61,000 support, and a loss of the daily EMA20 at $63,615 would significantly reinforce the bearish intermediate trend.
Outlook
Bitcoin’s current setup reflects a cautious recovery attempt within an intermediate bearish trend, with the critical test at the $65,000 EMA50 resistance unresolved. The 1-hour structure is the strongest of the three timeframes, but without 4-hour and daily confirmation, the upside remains vulnerable to macro headwinds — notably the chip-sector selloff and ongoing U.S.-China geopolitical tensions weighing on risk appetite broadly. The neutral funding rate environment is a mild positive, removing the risk of a liquidation-driven flush, but the lack of OBV confirmation and still-declining daily EMA200 demand caution. Traders should monitor price behavior around $65,000 closely over the next 24–48 hours; a decisive close above this level would shift the tactical bias to mildly bullish, while a rollover below $63,600 would favor the bears resuming control.
Disclaimer: This analysis is for informational purposes only and does not constitute financial advice. Cryptocurrency markets are highly volatile and unpredictable. All trading decisions should be made based on your own research and risk tolerance. Block Digest is not responsible for any financial losses incurred as a result of acting on this content.