Bitcoin Daily Analysis: Bitcoin at $62.8K Faces EMA Overhead Resistance
Market Overview
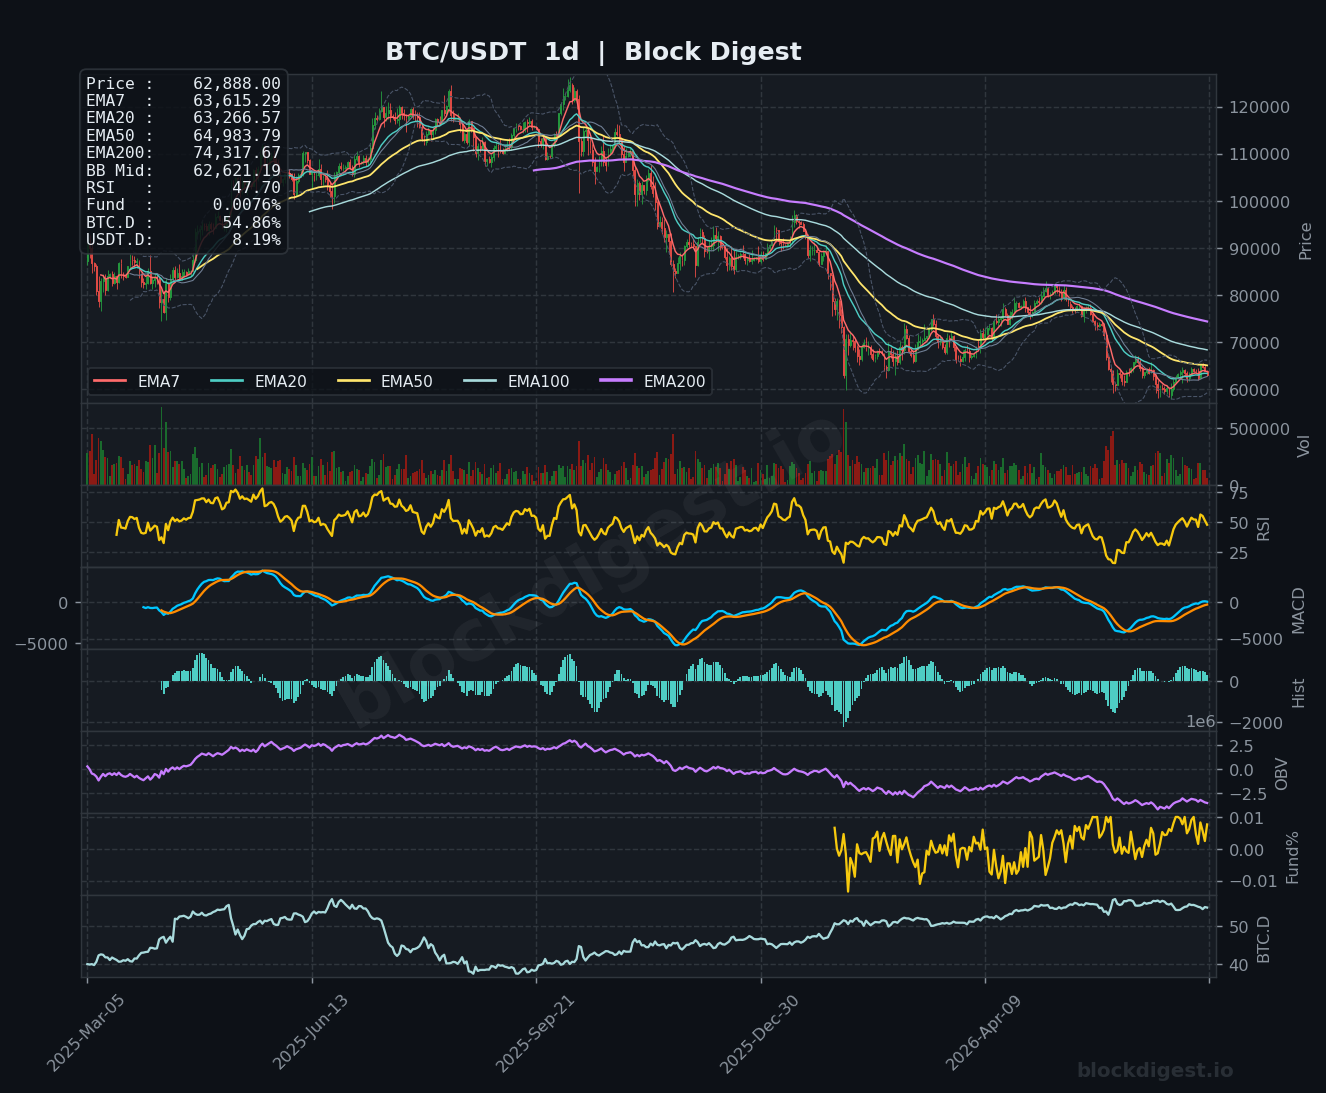
Bitcoin is currently trading at $62,887.90, sitting beneath a tightly clustered band of EMAs on the daily timeframe — EMA7 at $63,615, EMA20 at $63,266, and EMA50 at $64,983 — all of which are acting as immediate overhead resistance. Price is trading below the daily Bollinger Band midline at $62,621, though it has been oscillating around this level, suggesting a lack of decisive directional conviction. The dominant daily trend remains bearish from the macro perspective, with the EMA200 still declining at $74,317, well above current price. The recent push to $65,500 — a three-week high driven by a softer inflation print — has since reversed, with profit-taking and geopolitical risk (Iranian strikes on U.S. bases) accelerating the pullback toward the current $62,800–$63,000 range.
Multi-Timeframe Confluence
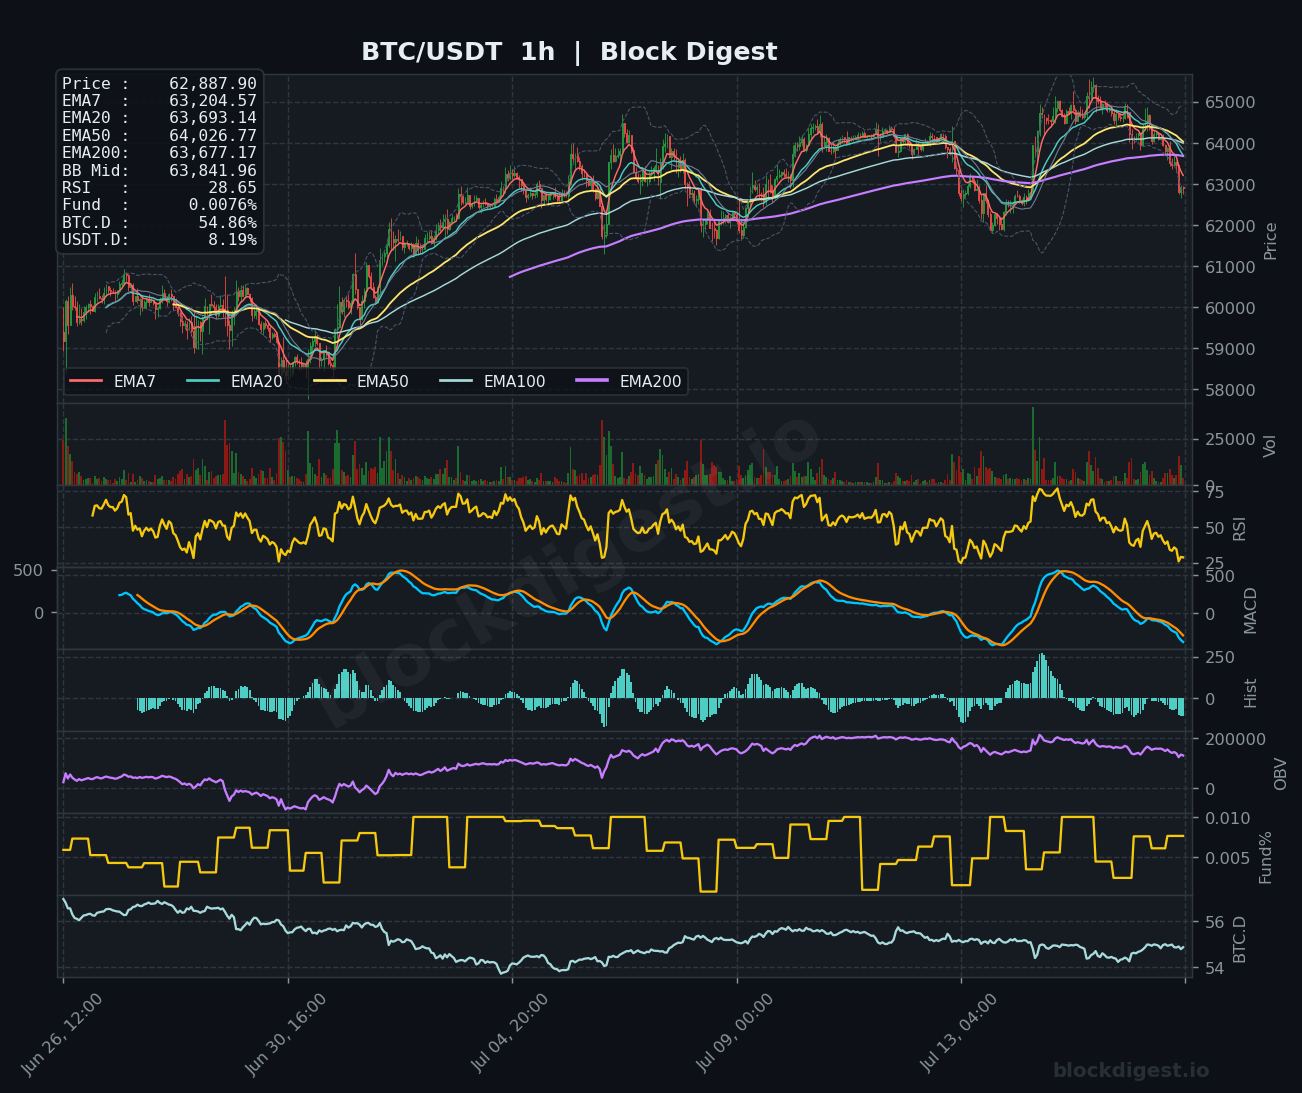
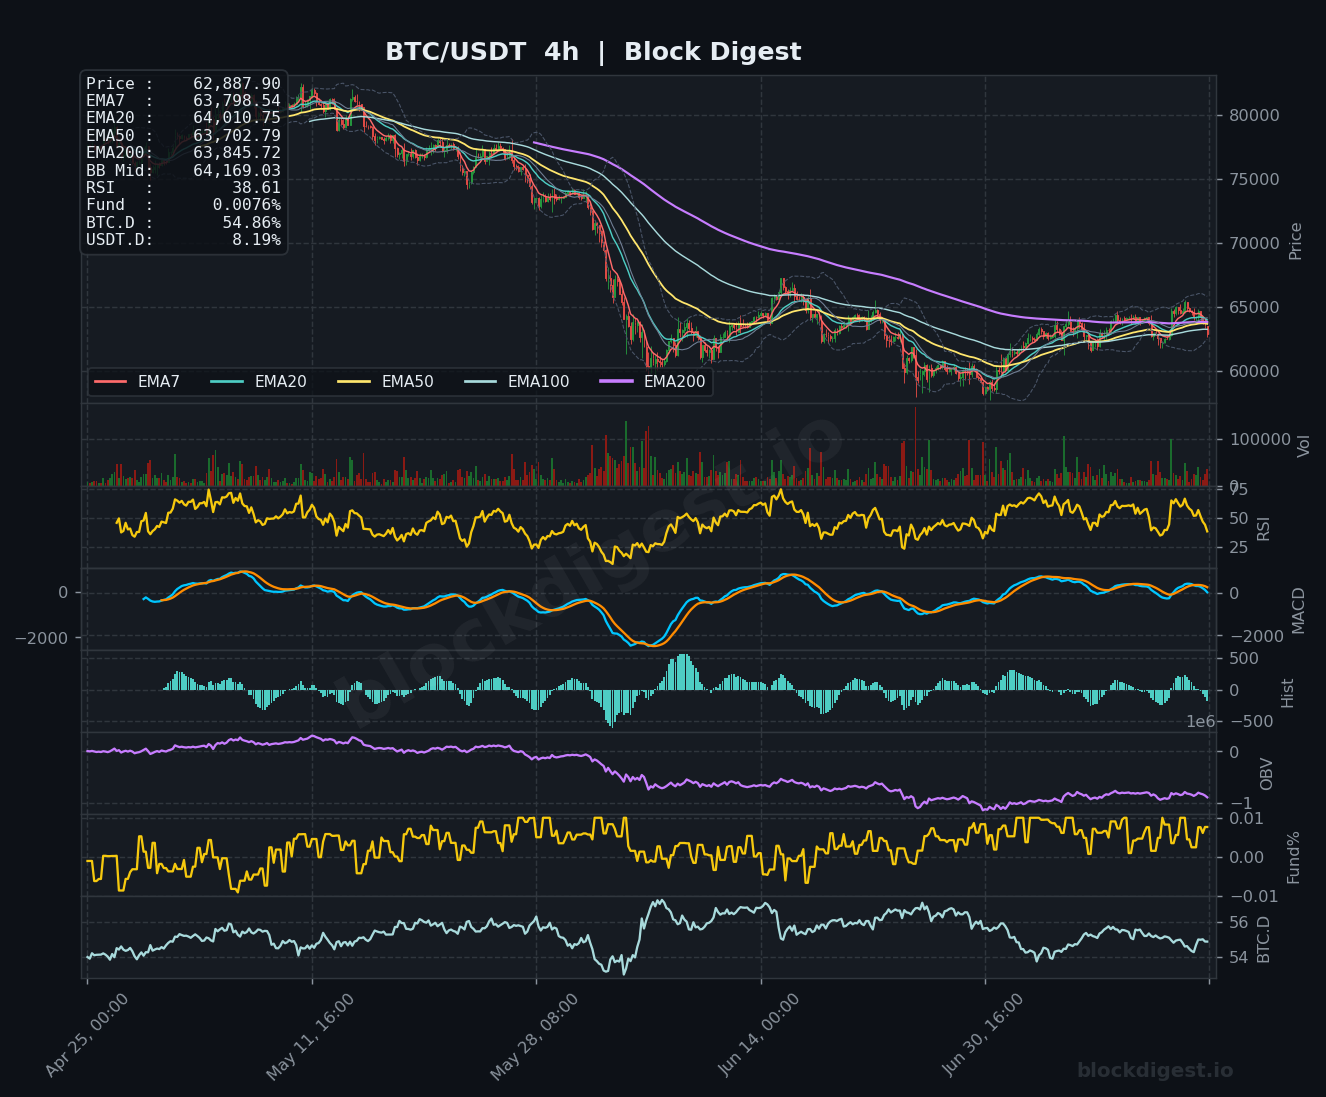
On the 1-hour chart, price has broken sharply below all key EMAs (EMA7: $63,204 / EMA20: $63,693 / EMA50: $64,026), with the 1h RSI collapsing to an oversold reading of 28.65, signaling short-term exhaustion in selling pressure. The 4-hour chart shows a similar bearish alignment, with price trading beneath the BB midline at $64,169 and all EMAs fanning downward — the EMA7 at $63,798 and EMA200 at $63,845 now forming a dense resistance cluster between $63,700–$64,200. On the daily timeframe, the RSI sits at 47.70, hovering just below the neutral 50 level, which aligns with the broader indecision and confirms that the higher timeframe has not yet turned constructively bullish. All three timeframes are in agreement: short-term momentum is decisively bearish, and the medium-term structure remains fragile until price can reclaim the $63,700–$64,200 EMA cluster.
Key Levels to Watch
- Resistance: $63,700–$63,845 — Confluence of 1h EMA200, 4h EMA7, and 4h EMA200; first meaningful barrier for any recovery attempt.
- Resistance: $64,169–$64,983 — The 4h BB midline and daily EMA50 form a critical ceiling; reclaiming this zone would shift the intermediate bias to neutral/bullish.
- Resistance: $65,500 — The recent three-week swing high; a clean break above this level would be required to confirm a trend reversal on the short-to-medium timeframe.
- Support: $62,600–$62,621 — Daily BB midline; current near-term floor and a level where price has previously found reactive buying.
- Support: $61,500–$61,800 — Prior consolidation zone and lower Bollinger Band support on the 4h chart; a breach here would accelerate downside momentum.
- Support: $60,000 — Psychological round number and structural low region from the broader recovery base; significant demand zone and line-in-the-sand for bulls.
Momentum & On-Chain Signals
The 1-hour RSI at 28.65 is deeply oversold and may trigger a technical bounce in the near term, but this alone is insufficient to call a reversal given the bearish EMA structure above. The 4-hour MACD lines are converging near zero with a slightly negative histogram, indicating fading but still present bearish momentum — no bullish crossover is in sight yet. On the daily chart, the MACD is attempting a slow grind back toward the zero line, but remains below it, consistent with a market in recovery mode rather than confirmed uptrend. OBV on both the 1h and daily charts has been in a gradual decline over recent weeks, pointing to mild distribution rather than strong accumulation; funding rates at a neutral 0.0076% suggest the market is not overextended in either direction, which slightly reduces the probability of a violent squeeze in either direction immediately.
BTC Dominance & Market Sentiment
BTC.D currently stands at 54.86%, near its recent range highs, indicating that capital continues to favor Bitcoin over altcoins in an environment of macro uncertainty. USDT.D at 8.19% remains elevated, reflecting a continued preference for sideline positioning among a segment of market participants — this persistent stablecoin dominance is a headwind for broad risk-on rotation. Together, these readings suggest a defensive, risk-averse market posture, with any meaningful recovery in BTC likely needed before capital rotates meaningfully into altcoins.
Risk Scenarios
- Bullish case: A bounce off the $62,600 BB midline support, followed by a reclaim of the $63,845 EMA cluster on the 4h and daily charts, would set the stage for a retest of the $65,500 swing high — institutional catalysts such as continued ETF inflows or easing geopolitical tensions could accelerate this move.
- Bearish case: Failure to hold $62,600 and a confirmed 4h close below $61,800 would open the door to a retest of the $60,000 psychological support, with deteriorating OBV and macro risk-off flows potentially compounding selling pressure.
Outlook
The near-term bias is cautiously bearish-to-neutral following the rejection from $65,500, with BTC currently trapped between oversold short-term conditions and a dense overhead EMA resistance cluster between $63,700–$64,200. The next 24–48 hours are critical: a stabilization and bounce from the $62,600 zone paired with a reclaim of the 1h EMA200 ($63,677) would be the minimum requirement to suggest the pullback is complete. Conversely, any continuation of geopolitical risk escalation or a daily close below $62,600 would shift the probability toward testing $61,500–$60,000. With institutional activity (T. Rowe Price’s multi-token ETF launch, Citadel’s $400M investment in Crypto.com) providing a constructive medium-term backdrop, dips toward key supports may attract buyers — but confirmation through price and volume action is required before adopting a directional conviction for the short-term trade.
Disclaimer: This analysis is for informational purposes only and does not constitute financial advice. Cryptocurrency markets are highly volatile and unpredictable. All trading decisions should be made based on your own research and risk tolerance. Block Digest is not responsible for any financial losses incurred as a result of acting on this content.