
ETH
ETH Weekly Analysis — Week of May 04, 2026
ETH Weekly Analysis – Week of May 04, 2026 Weekly Market Overview Ethereum has entered a critical inflection point this week, trading at $2,364 as it tests resistance at the weekly EMA7 ($2,271) after weeks of consolidation. The current weekly candle structure shows price attempting to break above the compressed EMA cluster between $2,271-$2,428, signaling...

ETH Daily Analysis — May 04, 2026
ETH Daily Analysis – May 04, 2026 Market Overview ETH is trading at $2,364.48, positioned in a consolidation phase near critical resistance levels. Price remains caught between the EMA50 ($2,326.89 on 1h, $2,308.92 on 4h, $2,255.02 on 1d) and EMA200 levels, indicating indecisive market structure. The daily timeframe shows price trading below all major EMAs...
ETH Daily Analysis — May 03, 2026
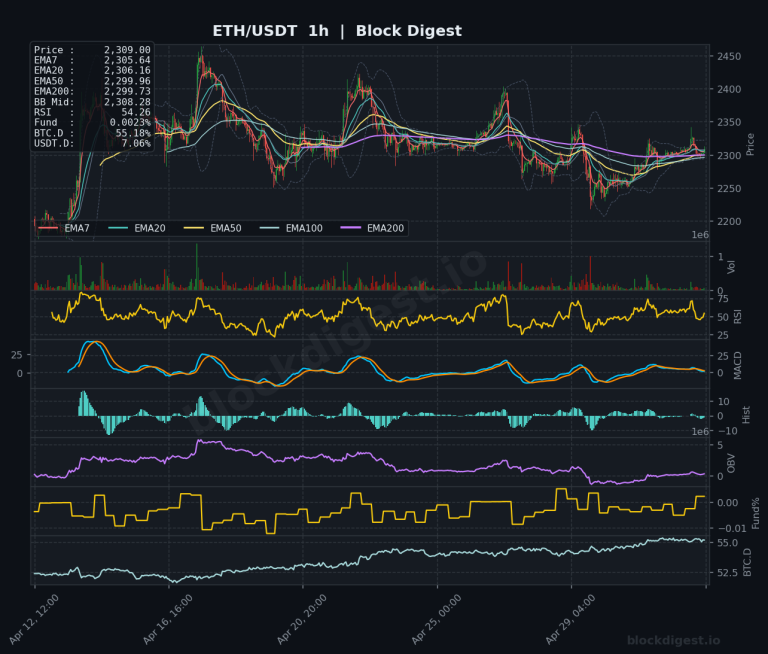
ETH Daily Analysis – May 03, 2026 Market Overview ETH is currently trading at $2,309.00, positioned in a compressed range just above the key EMA cluster on the 1-hour timeframe. Price sits marginally above the EMA7 ($2,305.64) and EMA20 ($2,306.16), suggesting short-term consolidation after recent volatility. On the daily chart, ETH remains below all major...
ETH Daily Analysis — May 02, 2026
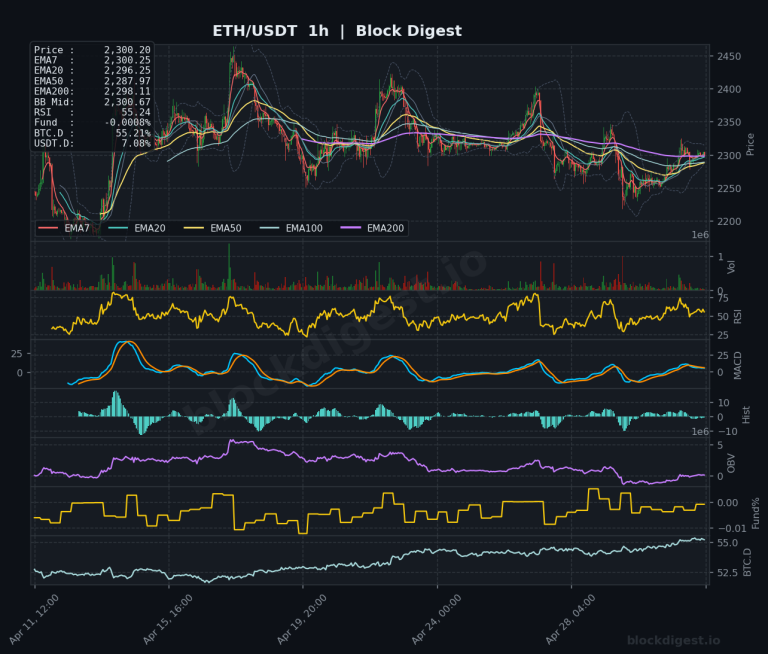
ETH Daily Analysis – May 02, 2026 Market Overview ETH/USDT is currently trading at $2,300.20, consolidating in a narrow range after recovering from the recent capitulation low near $1,700. Price is positioned above the short-term EMAs (7, 20, 50) on both the 1h and 4h timeframes, suggesting stabilization in lower timeframes, but remains constrained below...
ETH Monthly Analysis — May 01, 2026
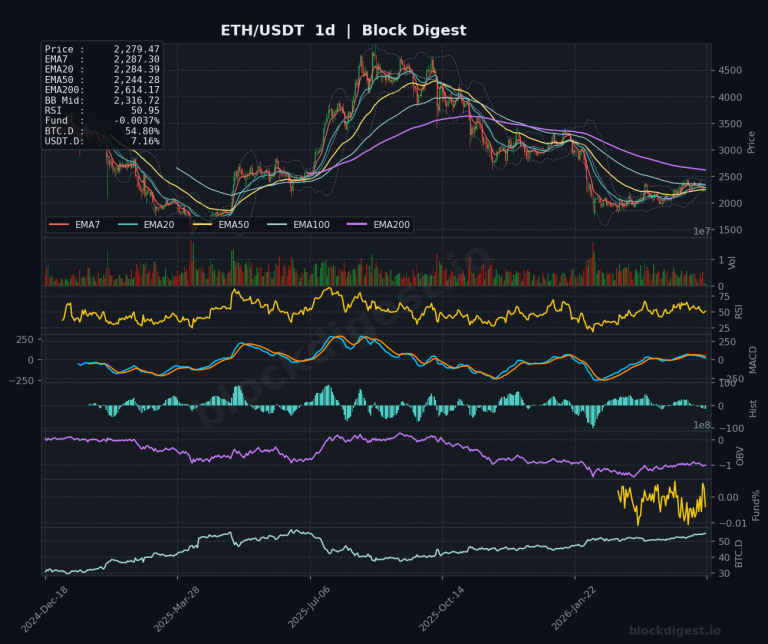
ETH Monthly Analysis – May 01, 2026 Macro Market Overview Ethereum currently trades at $2,279, positioned below both the monthly EMA7 ($2,470) and EMA20 ($2,709), indicating persistent macro bearish pressure following a significant cycle top rejection. The monthly candle structure reveals a clear distribution pattern that began following the 2025 peak near $5,200, with price...
ETH Daily Analysis — April 29, 2026
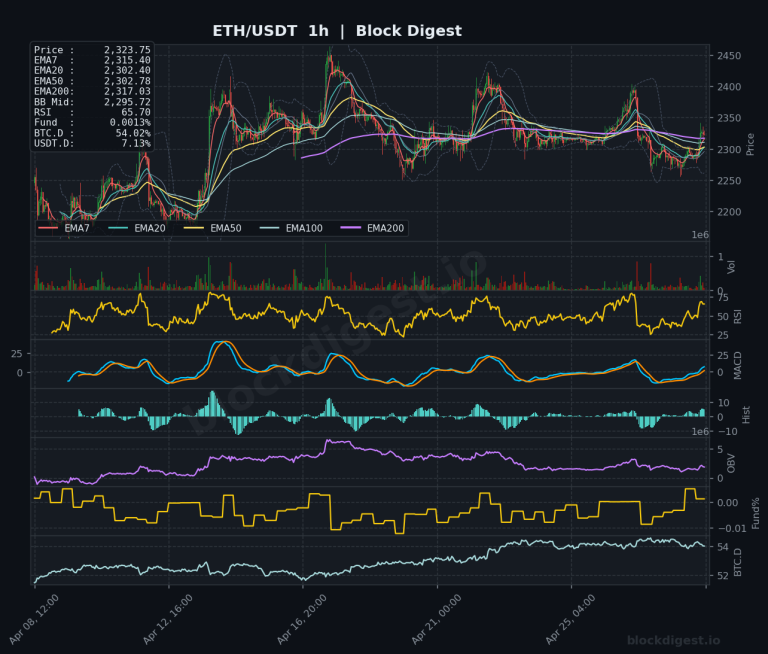
ETH Daily Analysis – April 29, 2026 Market Overview ETH is currently trading at $2,323.75, consolidating within a tight range just above the key $2,300 psychological level. Price action remains compressed between the EMA20 ($2,302.40) and EMA50 ($2,302.78) on the 1-hour timeframe, indicating short-term indecision. On the daily chart, ETH is positioned above the EMA7...
ETH Daily Analysis — April 28, 2026
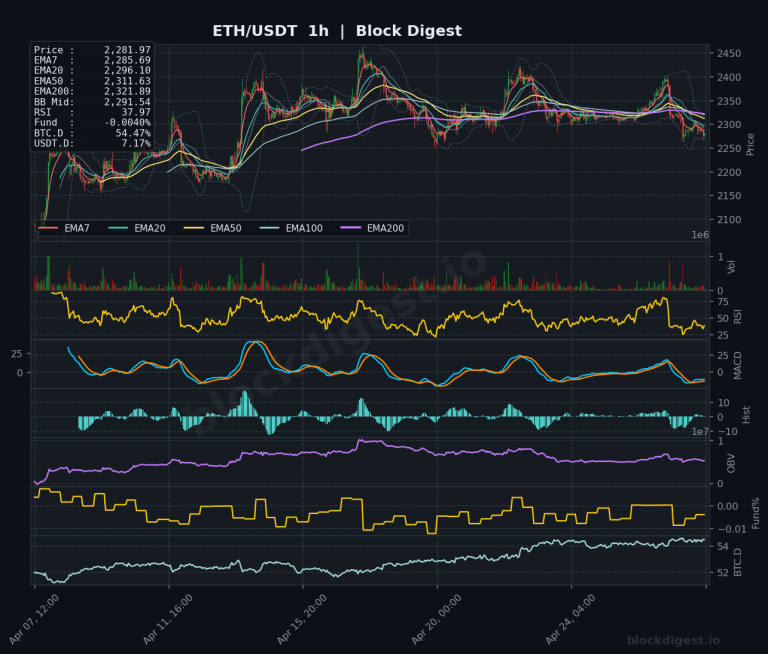
Market Overview Ethereum is trading at $2,281.97, positioned below all major exponential moving averages on the 1-hour timeframe, signaling short-term bearish pressure. The daily chart reveals price trading near the lower Bollinger Band with the EMA structure showing a bearish configuration as shorter-term EMAs (EMA7 at $2,316.01) remain below longer-term averages (EMA200 at $2,627.13). The...
ETH Weekly Analysis — Week of April 27, 2026
Weekly Market Overview Ethereum concluded the week at $2,319.81, demonstrating consolidative price action after several weeks of attempted recovery from previous lows. The weekly candle structure reveals a market in equilibrium, with price compressing between key moving averages as bulls and bears contest directional control. This week’s formation suggests indecision at current levels, with ETH...

ETH Daily Analysis — April 27, 2026
Market Overview Ethereum is trading at $2,319.81, consolidating just below the short-term moving averages in what appears to be a corrective phase within a broader neutral-to-bearish structure. The price is positioned below the EMA7 ($2,346.22) and EMA20 ($2,351.92) on the 1-hour chart, indicating near-term weakness, while on the daily timeframe ETH remains compressed between the...
ETH Daily Analysis — April 27, 2026
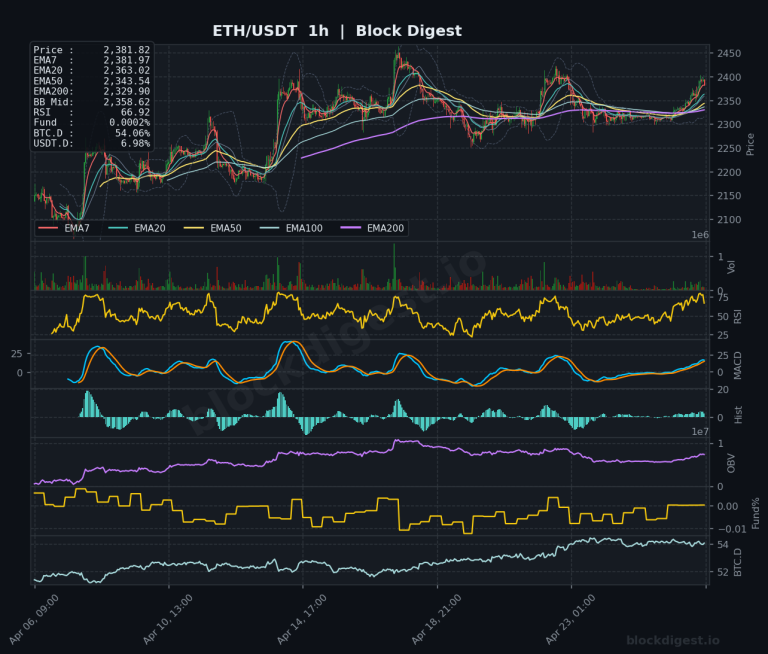
Market Overview Ethereum is trading at $2,381.82, positioned in a neutral consolidation zone as price action remains compressed between key moving averages. The daily chart shows ETH currently trading below the EMA20 ($2,299.67) and EMA50 ($2,243.14) but above the rising EMA200 ($2,630.77), indicating a medium-term bearish structure with recent recovery attempts. On the 1-hour timeframe,...