
ETH
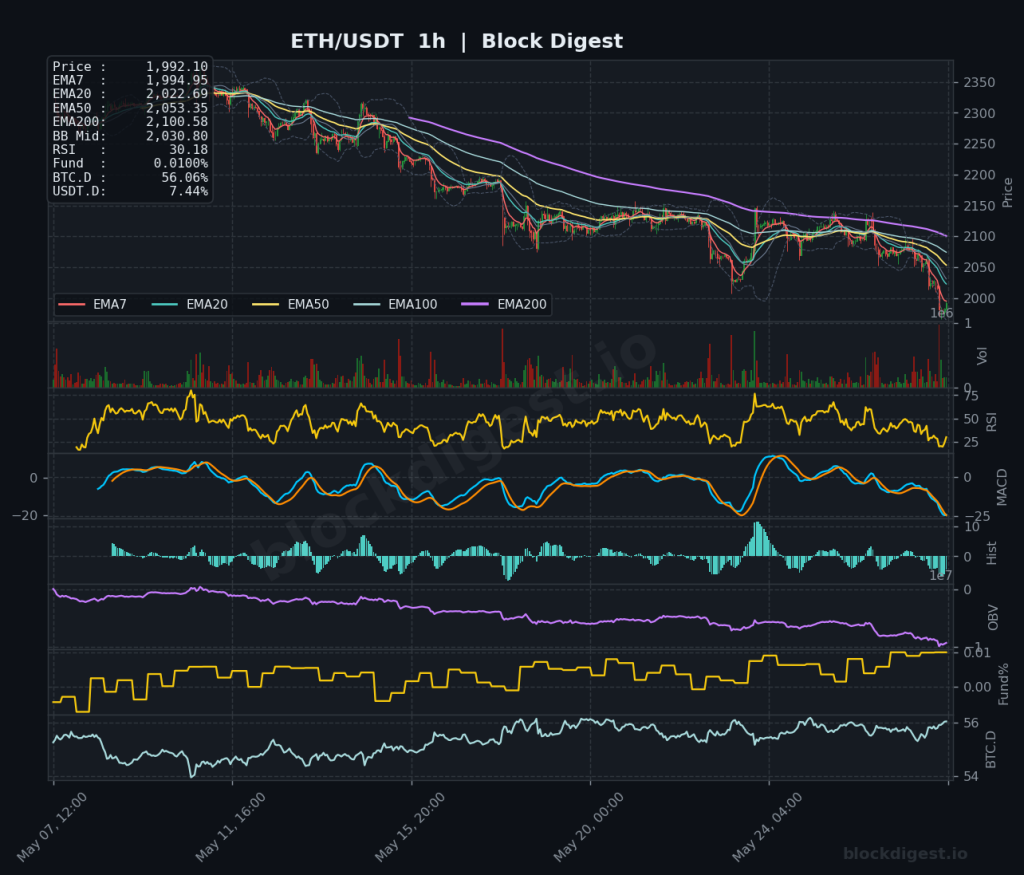
Ethereum Daily Analysis: ETH Breaks Below $2,000 With Stacked EMA Bearish Structure
Market Overview ETH/USDT is trading at $1,992.10 as of May 28, 2026, having slipped back below the psychologically significant $2,000 level — a development that reinforces the bearish macro structure visible across all timeframes. Price is trading well beneath every key EMA on the daily chart, with the EMA7 at $2,063.14, EMA20 at $2,141.94, EMA50...

Ethereum Daily Analysis: ETH Below All Daily EMAs at $2,080
Market Overview ETH/USDT is trading at $2,080.56 as of May 27, 2026, sitting in a structurally weakened position across all major timeframes. Price is trading below every significant daily EMA — the EMA7 at $2,101.04, EMA20 at $2,163.12, EMA50 at $2,209.97, and the EMA200 at $2,519.36 — confirming a well-established bearish trend on the daily...

Ethereum Daily Analysis: ETH at $2,098 Below Key EMAs, Bearish Trend
Market Overview ETH/USDT is trading at $2,098.38, sitting in a structurally weak position across all timeframes. On the daily chart, price remains firmly below all major EMAs — the EMA7 at $2,114.21, EMA20 at $2,174.23, EMA50 at $2,216.25, and the EMA200 at $2,524.91 — confirming a sustained bearish trend that has been in place since...
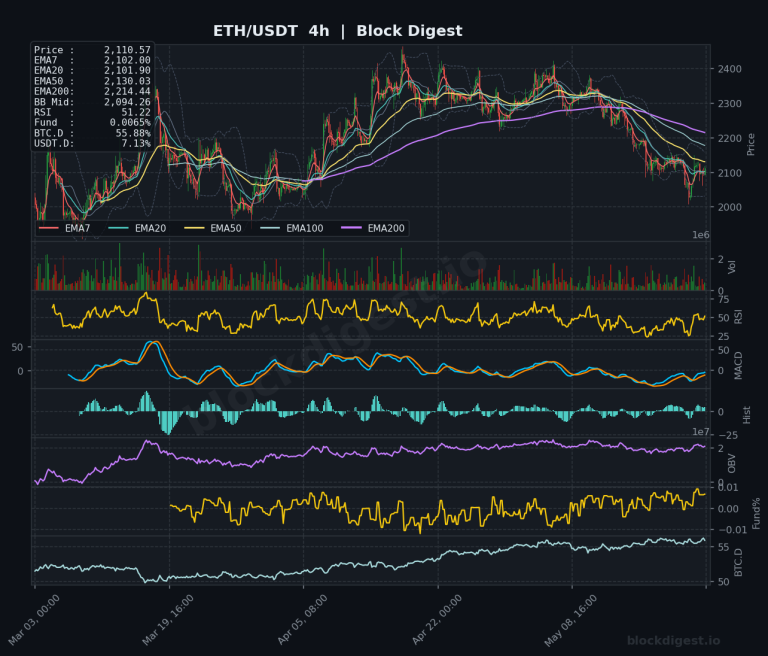
Ethereum Weekly Analysis: ETH Falls to $2,110 Amid 50% Decline From Highs
Weekly Market Overview ETH/USDT closed the week around $2,110, extending a prolonged downtrend that has seen price shed roughly 50% from its 2025 highs near $4,500. The current weekly candle is printing in deeply bearish territory, with price trading well below all major moving averages on both the weekly and daily timeframes. The recent macro...
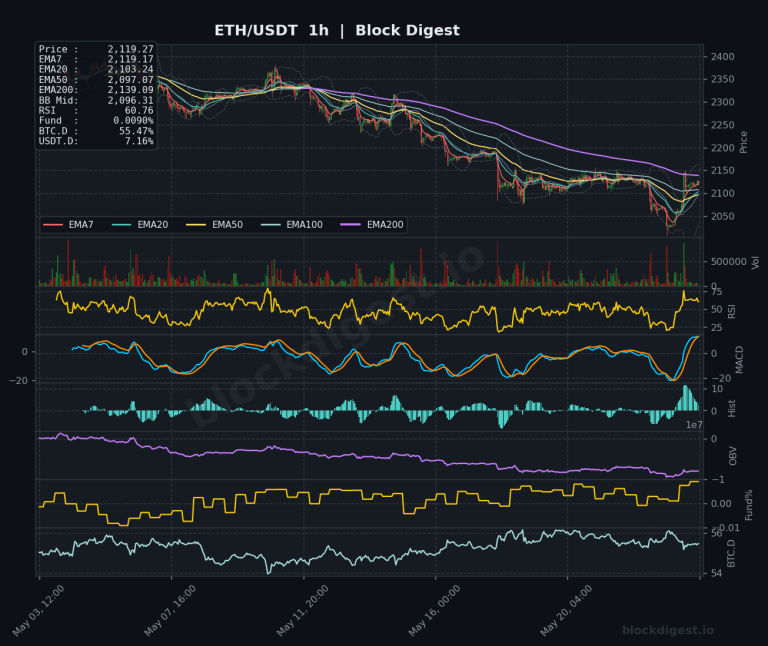
Ethereum Daily Analysis: ETH at $2,119 Below Key EMA Levels
Market Overview ETH/USDT is currently trading at $2,119.27, caught in a structurally weak position on the daily timeframe following a prolonged decline from highs above $4,000. Price sits below all major daily EMAs — the EMA20 at $2,191.55, EMA50 at $2,226.32, and the EMA200 at $2,533.59 — confirming a bearish macro structure. The daily Bollinger...

Ethereum Daily Analysis: ETH breaks below $2,100 as bearish structure deepens
Market Overview ETH/USDT is currently trading at approximately $2,022–2,023, having broken decisively below the psychologically significant $2,100 level. Price sits well beneath all key EMAs on the daily timeframe — EMA7 at $2,106, EMA20 at $2,190, EMA50 at $2,227, and the EMA200 at $2,536 — confirming a deeply bearish market structure. The Bollinger Band midline...

Ethereum Daily Analysis: ETH Trapped Below All Major Daily EMAs
Market Overview ETH/USDT is currently trading at $2,129.61, sitting in a technically precarious position beneath all major daily EMAs — EMA7 ($2,150.30), EMA20 ($2,214.02), EMA50 ($2,237.88), and EMA200 ($2,543.04). The daily Bollinger Band midline at $2,249.22 sits well above current price, reinforcing the bearish market structure that has dominated since the mid-2025 highs above $4,000....
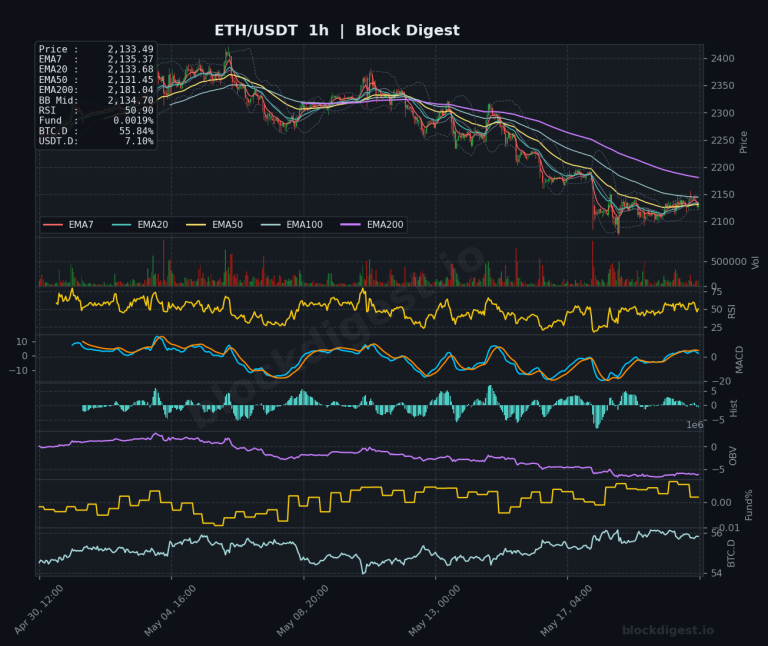
Ethereum Daily Analysis: ETH Below All EMAs, Eyes $2,133
Market Overview ETH/USDT is currently trading at $2,133.49, sitting in a structurally weak position on the daily timeframe after a sustained decline from highs above $4,000 recorded mid-2025. Price is trading well below all major daily EMAs — EMA7 at $2,157.37, EMA20 at $2,222.97, EMA50 at $2,242.32, and the EMA200 at $2,547.57 — confirming that...

ETH Daily Analysis — May 20, 2026
Market Overview Ethereum is trading at $2,128.15, positioned well below all major exponential moving averages across timeframes, signaling continued bearish pressure. The daily chart shows price trading beneath the EMA7 ($2,165), EMA20 ($2,232), EMA50 ($2,246), and significantly below the EMA200 ($2,553), confirming a firmly established downtrend. The Bollinger Bands on the 1-hour chart show price...

ETH Daily Analysis — May 19, 2026
Market Overview Ethereum is currently trading at $2,141.29, positioned below all major exponential moving averages across timeframes, signaling persistent bearish pressure. On the 1-hour chart, price sits beneath the EMA7 ($2,133.78), EMA20 ($2,129.50), EMA50 ($2,143.55), and EMA200 ($2,215.13), while the Bollinger Band midline at $2,123.91 provides immediate support. The daily timeframe confirms a broader downtrend...
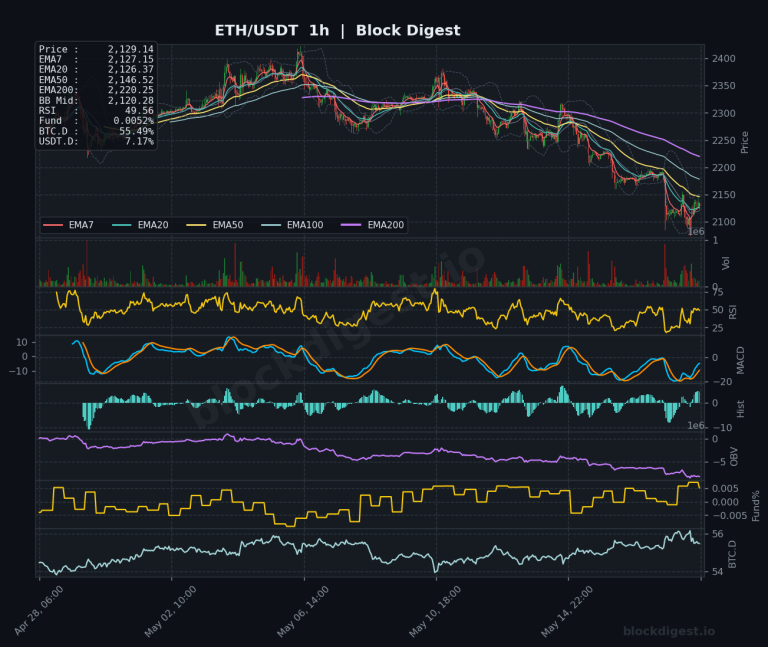
ETH Weekly Analysis — Week of May 19, 2026
Ethereum closed the week at $2,129, marking another session of sustained weakness as the asset trades deeply below all key moving averages. The weekly candle formed a bearish continuation pattern with price rejecting the EMA7 ($2,210) and closing near session lows, extending the downtrend that began from the February peak near $5,100. This marks the...

ETH Daily Analysis — May 18, 2026
ETH Daily Analysis – May 18, 2026 Market Overview Ethereum is trading at $2,118.97, currently positioned below all major EMAs across timeframes, signaling sustained bearish pressure. On the daily chart, price remains beneath the descending EMA200 at $2,562.27, with the entire EMA structure bearishly stacked (shorter EMAs below longer ones). The Bollinger Band middle line...