ETH Daily Analysis — May 02, 2026
ETH Daily Analysis – May 02, 2026
Market Overview
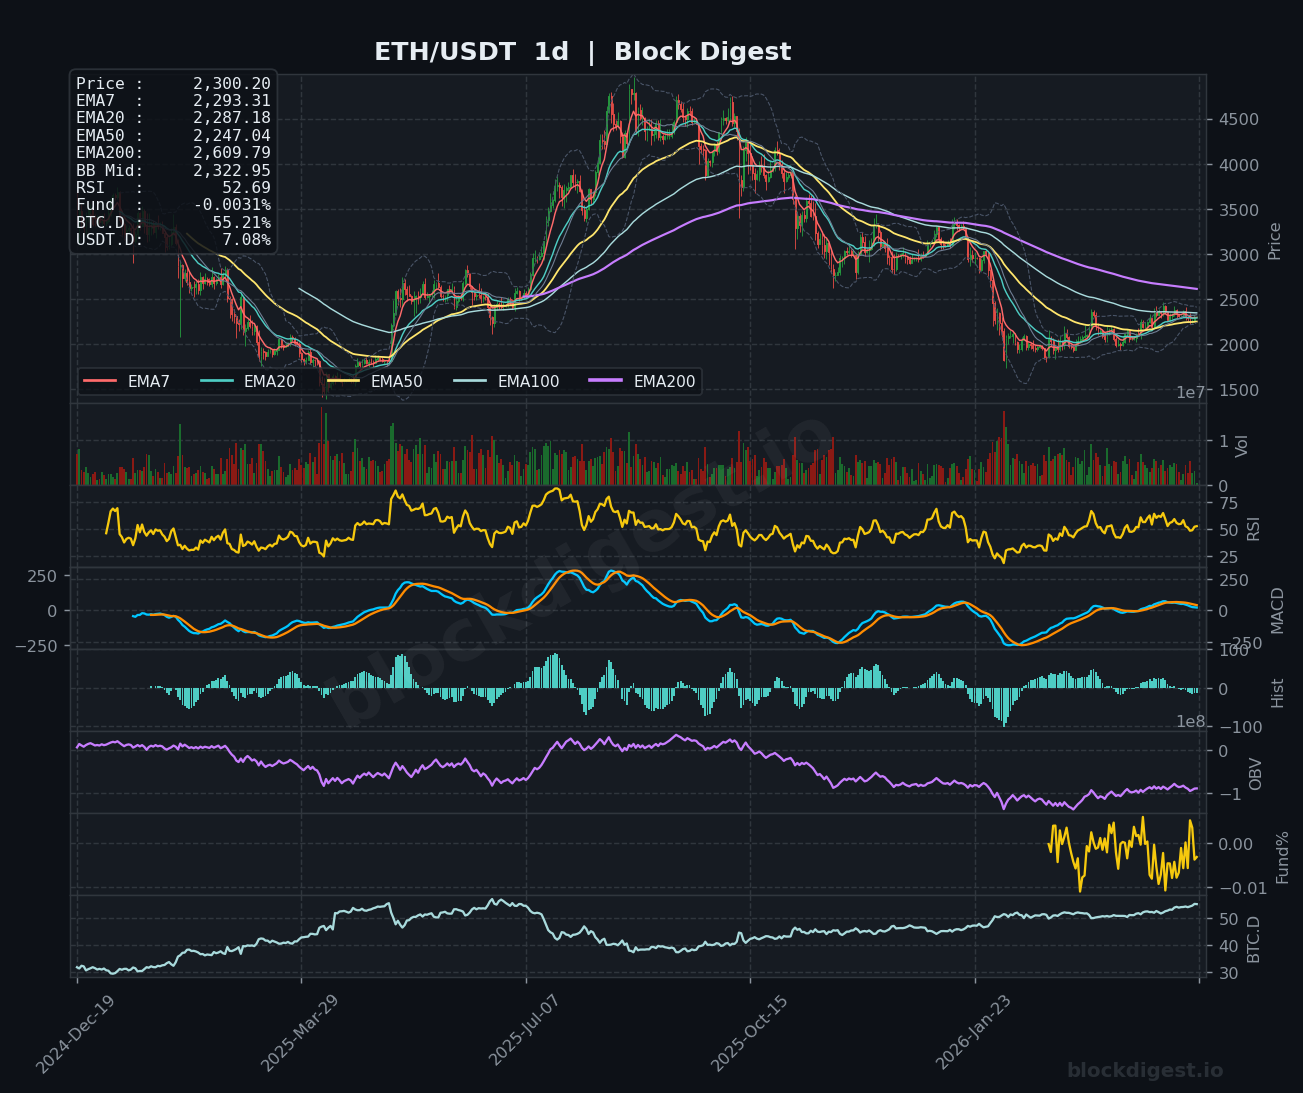
ETH/USDT is currently trading at $2,300.20, consolidating in a narrow range after recovering from the recent capitulation low near $1,700. Price is positioned above the short-term EMAs (7, 20, 50) on both the 1h and 4h timeframes, suggesting stabilization in lower timeframes, but remains constrained below the critical EMA200 at $2,609.79 on the daily chart. The daily structure shows price trading near the Bollinger Band midline at $2,322.95, indicating a neutral-to-bearish broader trend as all major EMAs remain in bearish alignment (EMA50 at $2,247.04 below EMA200). The overall market structure reflects a corrective bounce within a longer-term downtrend, with price testing overhead resistance zones that could determine the next directional move.
Multi-Timeframe Confluence
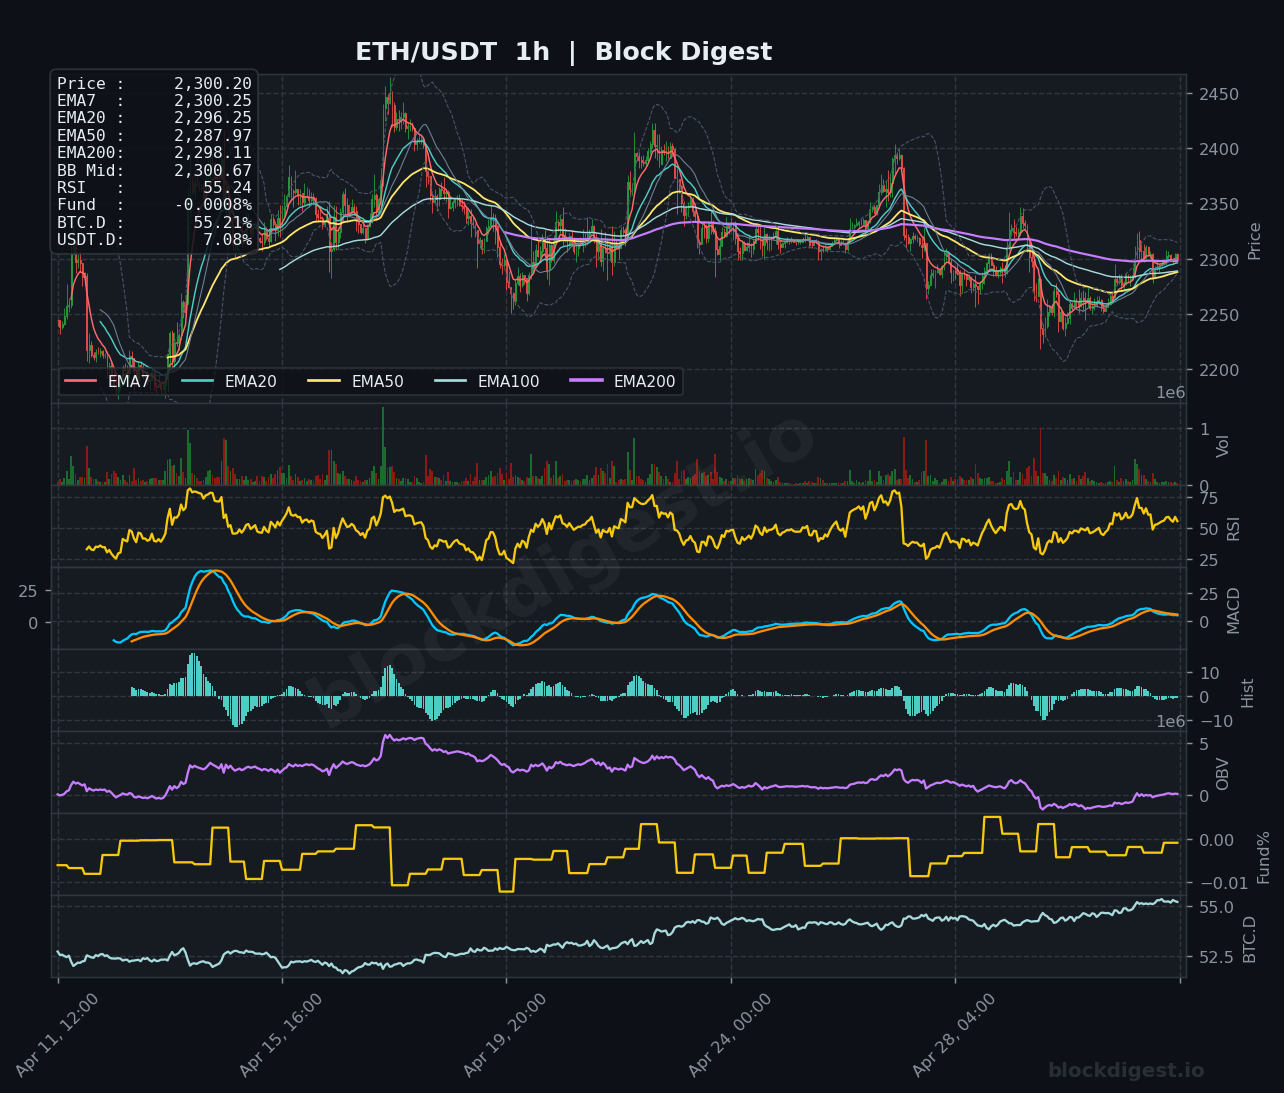
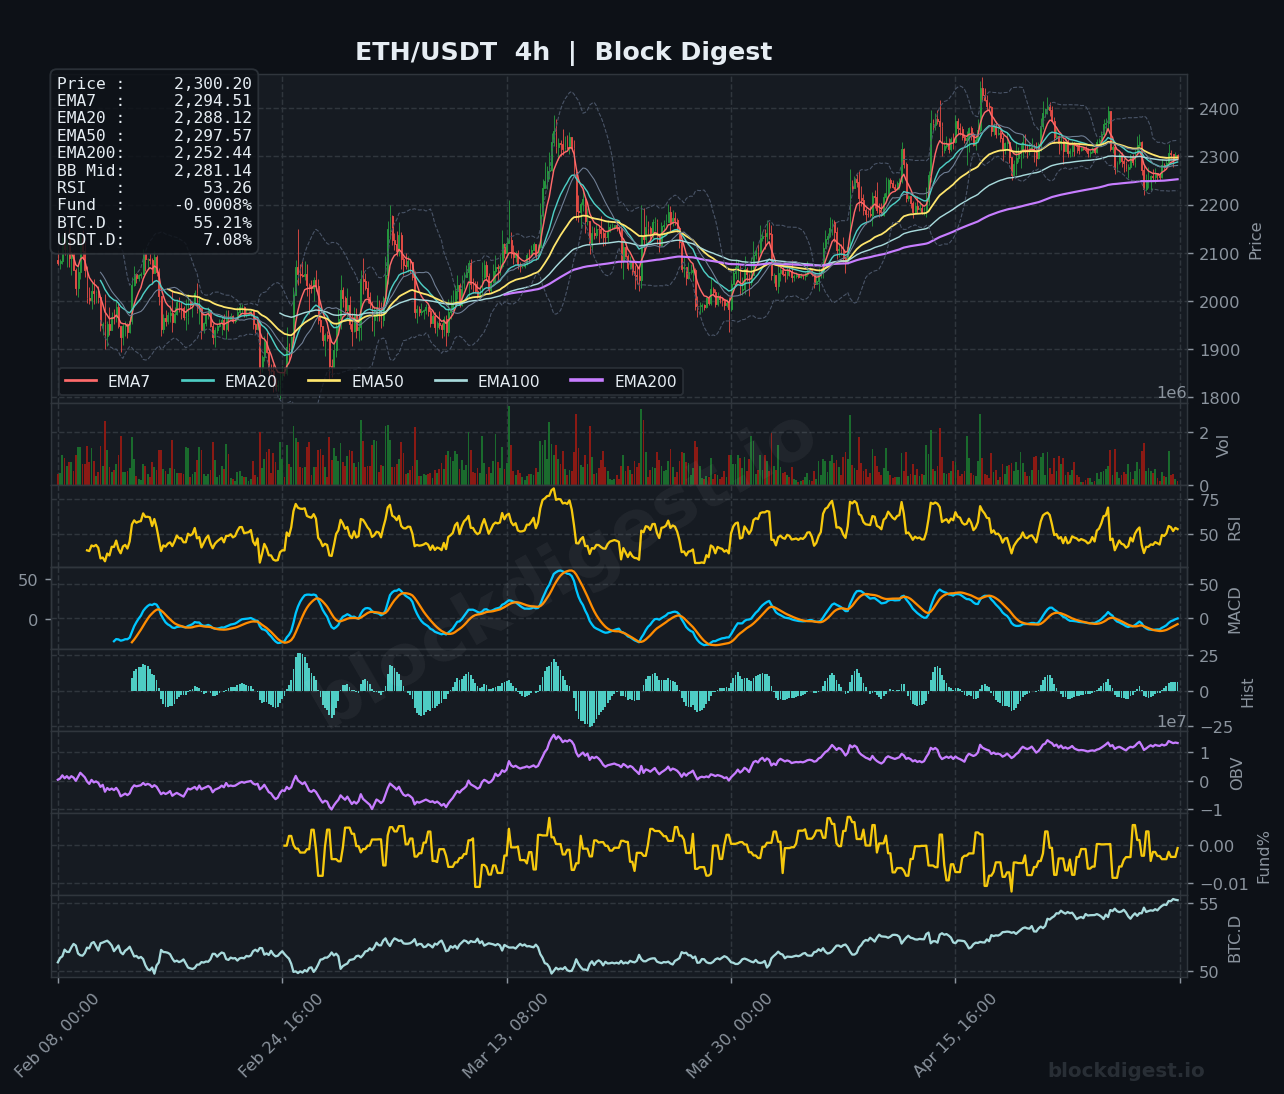
The 1h timeframe shows price slightly above the EMA7 ($2,300.25) and EMA20 ($2,296.25), with fast EMAs beginning to flatten, indicating short-term momentum stalling. On the 4h chart, price sits just above the EMA20 ($2,288.12) and EMA50 ($2,297.57), with these moving averages converging—a sign of indecision and potential coiling for the next move. The daily timeframe reveals the critical context: price remains well below the EMA200 at $2,609.79 and is attempting to reclaim the EMA50 at $2,247.04, which has now been regained as support. Confluence exists around the $2,287-$2,298 zone where multiple EMAs across timeframes cluster, serving as immediate support, while resistance aligns near $2,400 where prior swing highs and the daily EMA100 area converge.
Key Levels to Watch
Resistance:
- $2,350-$2,365: Recent local highs on the 4h chart and psychological resistance zone that has capped rallies multiple times
- $2,400-$2,425: Major resistance confluence with prior breakdown area and the beginning of the supply zone that rejected price in late March
- $2,609.79: Daily EMA200 serving as the primary long-term resistance; a reclaim would signal meaningful trend reversal
Support:
- $2,287-$2,298: Critical support cluster where EMA50 (1h), EMA20 (4h), and EMA50 (4h) converge, representing the immediate defense line
- $2,252-$2,265: Secondary support zone aligning with the daily EMA50 at $2,247.04 and prior consolidation lows
- $2,150-$2,180: Major support representing the recent range low before the latest bounce; loss of this zone would indicate resumption of the broader downtrend
Momentum & On-Chain Signals
RSI readings show divergent momentum across timeframes: the 1h RSI at 55.24 is neutral with slight bullish lean, the 4h RSI at 53.26 is similarly neutral, while the daily RSI at 52.69 suggests recovering momentum but still below 60, indicating bulls haven’t established conviction. MACD on the 1h shows flattening histogram bars with lines approaching equilibrium, suggesting waning short-term momentum, while the 4h MACD displays a positive crossover but with minimal histogram expansion—reflecting tentative bullish attempts without strong follow-through. The daily MACD remains in bearish territory with the MACD line still below the signal line, though the gap is narrowing. OBV shows stabilization on the 4h and daily charts after significant distribution, indicating accumulation has paused rather than accelerated. Funding Rate at -0.0008% (near neutral) reflects balanced sentiment without excessive leverage positioning, while the declining OBV on recent price advances suggests smart money hasn’t fully committed to this bounce.
BTC Dominance & Market Sentiment
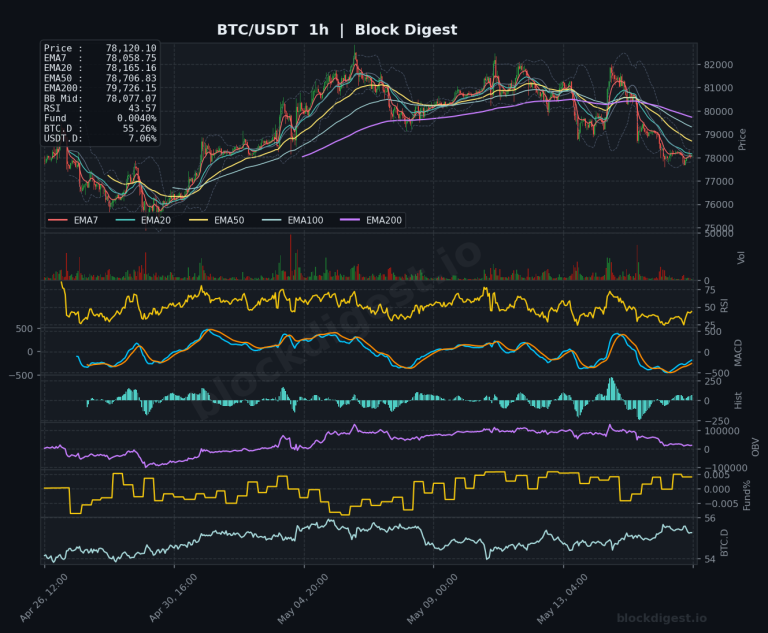
BTC.D stands at 55.21%, having risen from recent lows, indicating capital rotation back toward Bitcoin and away from altcoins including ETH—a typically risk-off signal within crypto markets. USDT.D at 7.08% remains elevated, suggesting investors are maintaining stablecoin positions and haven’t fully deployed capital into risk assets. This combination of rising BTC dominance and elevated stablecoin dominance creates headwinds for ETH price appreciation, as it indicates broader market caution and preference for safety over aggressive altcoin exposure.
Risk Scenarios
Bullish case: A decisive break and 4h close above $2,365 with expanding volume and RSI breaking above 60 on the 4h timeframe would confirm continuation toward the $2,400-$2,425 resistance zone. Sustained reclaim of $2,425 with the daily EMA50 holding as support could target $2,500-$2,550 and eventually challenge the daily EMA200 at $2,609.79, marking a potential intermediate-term trend shift.
Bearish case: Failure to hold the $2,287-$2,298 support cluster with a 4h close below this zone would signal breakdown resumption, targeting $2,150-$2,180 initially. Loss of $2,150 on increasing volume with daily RSI breaking below 50 would confirm bearish continuation toward $2,000 and potentially retest of the $1,700-$1,800 capitulation zone.
Outlook
ETH is exhibiting a consolidation pattern characteristic of a corrective bounce within a broader downtrend, with neutral momentum across multiple timeframes suggesting indecision at current levels. The critical catalyst to watch in the next 24-48 hours is whether bulls can generate a sustained break above $2,350-$2,365 with conviction, or if bears reassert control by breaking the $2,287 support confluence. The $2,300 level represents a pivotal inflection point—holding above keeps the corrective bounce intact with potential for testing $2,400, while a breakdown below the EMA cluster would likely accelerate selling pressure toward $2,150. Given elevated BTC.D, neutral funding, and lack of strong momentum confirmation, the bias remains cautiously neutral with a slight defensive tilt until price demonstrates commitment beyond the current range boundaries.
Disclaimer: This analysis is for informational purposes only and does not constitute financial advice. Cryptocurrency markets are highly volatile and unpredictable. All trading decisions should be made based on your own research and risk tolerance. Block Digest is not responsible for any financial losses incurred as a result of acting on this content.