ETH Daily Analysis — April 27, 2026
Market Overview
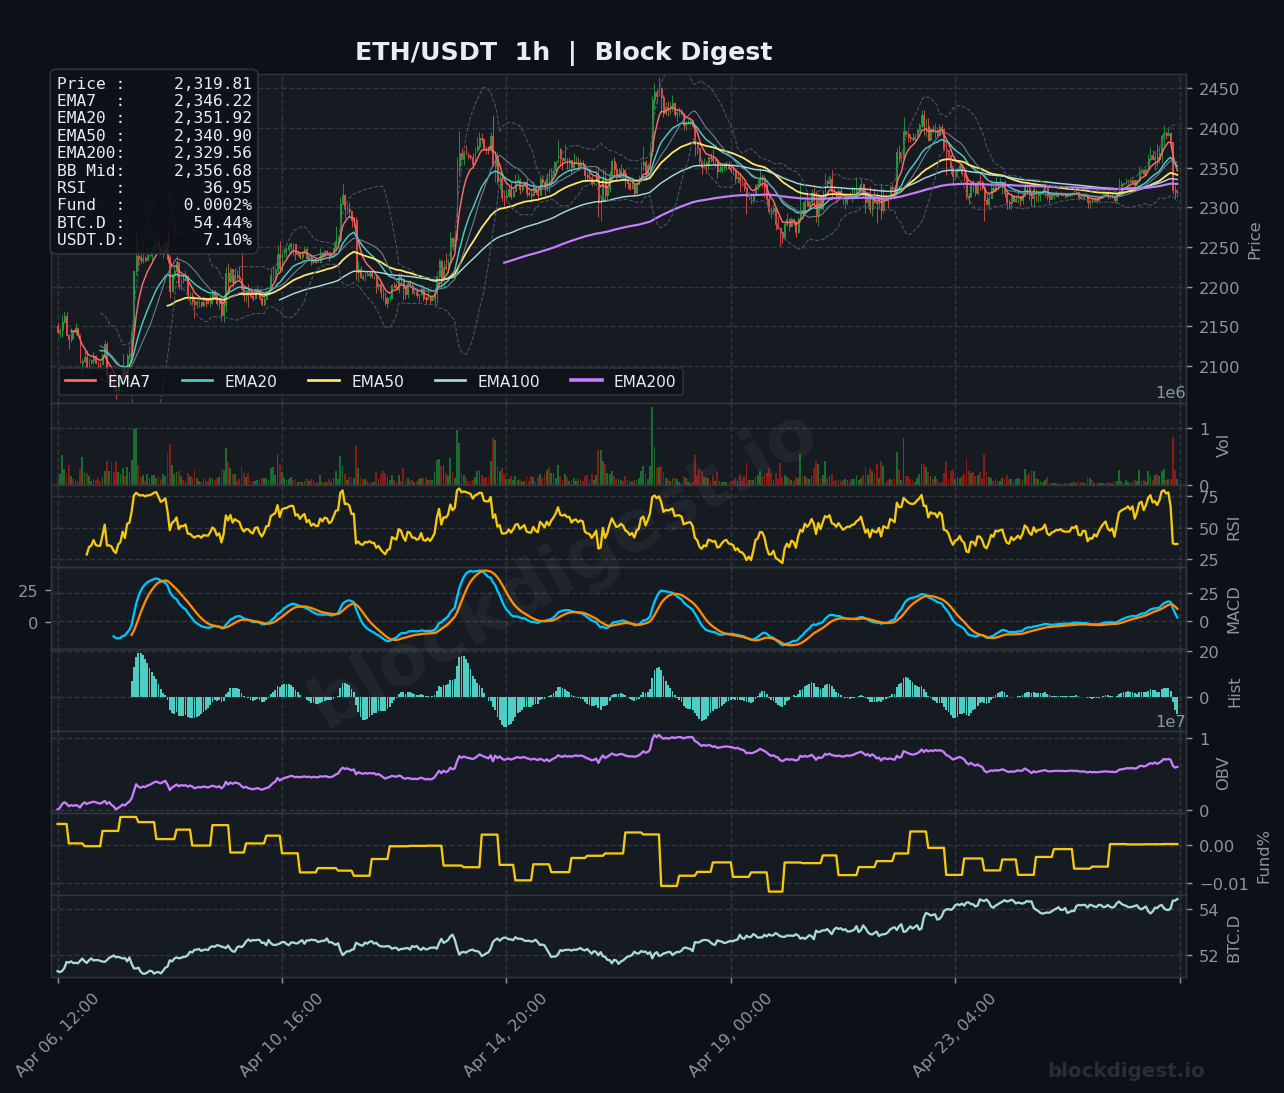
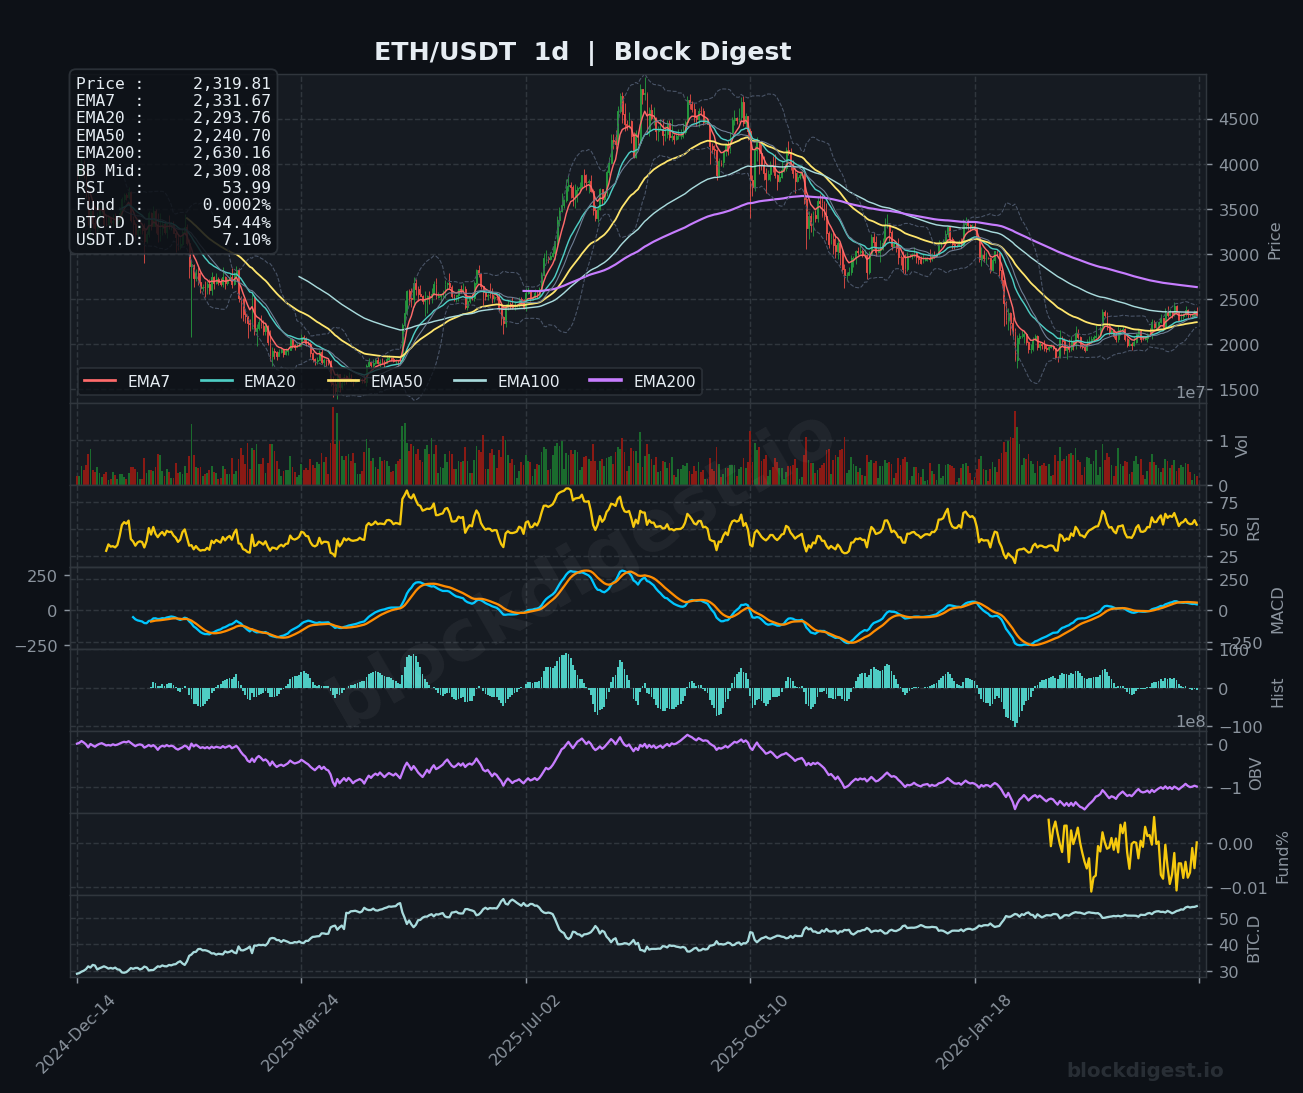
Ethereum is trading at $2,319.81, consolidating just below the short-term moving averages in what appears to be a corrective phase within a broader neutral-to-bearish structure. The price is positioned below the EMA7 ($2,346.22) and EMA20 ($2,351.92) on the 1-hour chart, indicating near-term weakness, while on the daily timeframe ETH remains compressed between the EMA50 ($2,240.70) and declining EMA200 ($2,630.16). Bollinger Bands on the 1-hour chart show a mid-range position around $2,356.68, with price action testing the lower boundary, suggesting either a potential bounce zone or the beginning of renewed downside momentum. The daily chart reveals a sustained downtrend from the late 2025 highs, with recent attempts to establish higher lows meeting resistance at the 50-day moving average.
Multi-Timeframe Confluence
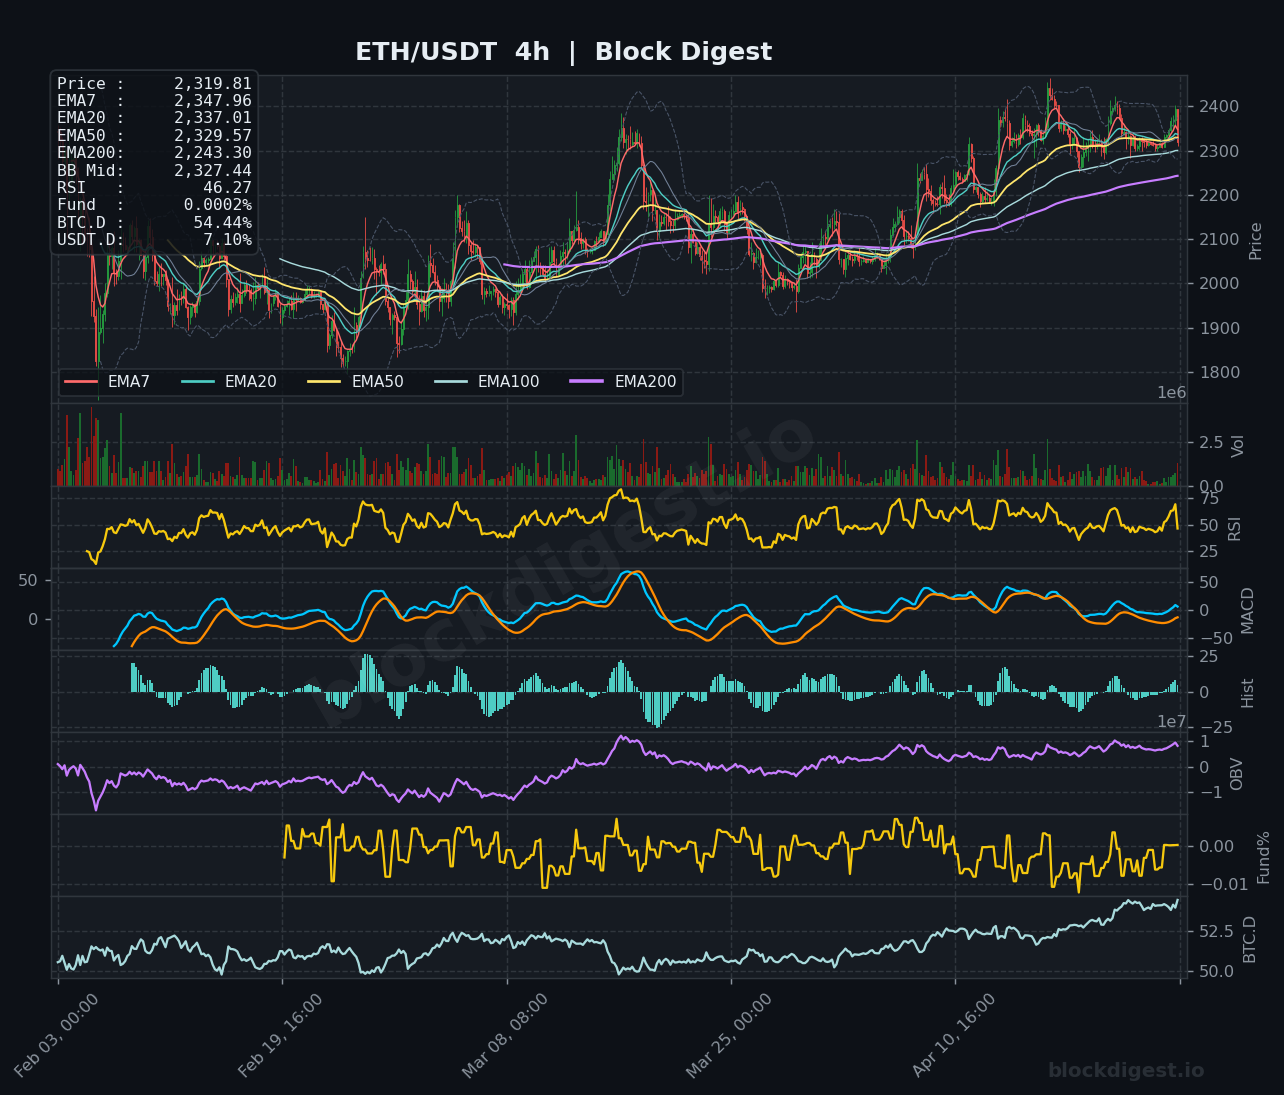
The timeframe analysis reveals divergent signals with the 1-hour chart showing immediate bearish pressure as price trades below key short-term EMAs, while the 4-hour chart displays a more consolidative pattern with price hovering near the EMA20 ($2,337.01) and EMA50 ($2,329.57). The daily timeframe confirms the broader context of a recovery attempt from the January 2026 lows around $1,800, but the failure to reclaim the 200-day EMA has kept bulls in check. Notably, the $2,320-$2,340 zone represents confluence across all three timeframes as a pivot area, with the EMA clusters on the 4-hour and daily charts converging around these levels. Short-term momentum on the 1-hour timeframe does not currently support the higher timeframe recovery narrative, suggesting caution before assuming continuation of the multi-week bounce from the lows.
Key Levels to Watch
- Resistance:
- $2,356-$2,360: Bollinger Band middle on the 1h chart and EMA cluster convergence, representing immediate overhead supply
- $2,400-$2,430: 4-hour chart resistance zone and recent swing high area where prior rallies have stalled
- $2,630: Daily EMA200 and major structural resistance; breaking above would signal a significant trend change
- Support:
- $2,300-$2,310: Current price action zone and psychological level, with Bollinger Band lower boundary nearby on the 1h chart
- $2,240-$2,260: Daily EMA50 and 4-hour support confluence, representing a critical defensive line for bulls
- $2,100-$2,150: Major support zone from prior consolidation visible on the daily chart; breakdown below risks testing deeper lows
Momentum & On-Chain Signals
The RSI readings present a mixed picture with the 1-hour RSI at 36.95 indicating oversold conditions that could spark a short-term bounce, while the 4-hour RSI at 46.27 and daily RSI at 53.99 suggest neutral-to-slightly-bullish momentum on higher timeframes. MACD on the 1-hour chart shows bearish crossover with the histogram declining, confirming immediate downside pressure, whereas the 4-hour and daily MACD displays remain relatively flat with no decisive directional signal. The OBV trend across timeframes appears relatively stable without pronounced accumulation or distribution spikes, suggesting a lack of strong conviction from either bulls or bears at current levels. Funding rates at 0.0002% indicate minimal leverage positioning and neutral sentiment, which typically precedes either a breakout or breakdown as market participants await clearer directional catalysts.
BTC Dominance & Market Sentiment
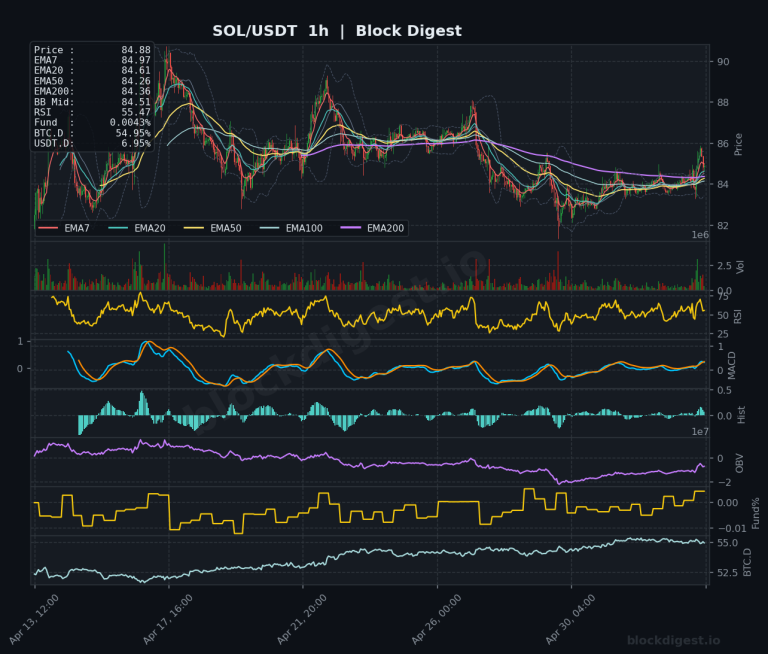
Bitcoin dominance stands at 54.44%, reflecting a risk-off environment where capital remains concentrated in BTC rather than flowing into altcoins like ETH. USDT dominance at 7.10% suggests moderate stablecoin positioning, neither indicating extreme fear (high USDT.D) nor excessive greed (very low USDT.D). For Ethereum specifically, this dominance configuration presents headwinds, as capital rotation into ETH typically requires declining BTC.D, and the current elevated levels suggest traders are not yet confident in an altcoin season scenario.
Risk Scenarios
- Bullish case: A reclaim of $2,360 with sustained trading above the EMA7/EMA20 cluster would suggest short-term control has shifted back to buyers, targeting the $2,400-$2,430 resistance zone and potentially $2,500 if momentum accelerates. Confirmation would require RSI breaking above 60 on the 4-hour chart and MACD positive crossover on the daily timeframe.
- Bearish case: Failure to hold $2,300 and a breakdown below the $2,240-$2,260 support confluence would signal resumption of the broader downtrend, exposing $2,100-$2,150 and potentially retesting the January lows near $1,800. This scenario gains credibility if accompanied by BTC.D rising further and daily RSI breaking below 50.
Outlook
Ethereum is at a critical juncture with the immediate bias slightly negative based on 1-hour weakness, but higher timeframe structure remains salvageable if bulls can defend the $2,240-$2,300 zone. The next 24-48 hours will likely be defined by whether price can reclaim the $2,360 level and hold it as support, which would invalidate the immediate bearish setup. Key triggers include any significant move in Bitcoin (given the high BTC.D), potential macro catalysts affecting risk sentiment, and whether the oversold RSI on the 1-hour chart translates to a genuine bounce or merely a bear flag formation. Until price establishes a clear position above $2,400 or below $2,240, expect continued range-bound volatility with slight downside bias, and traders should monitor volume and on-chain metrics for early signs of directional commitment.
Charts