ETH Daily Analysis — April 29, 2026
ETH Daily Analysis – April 29, 2026
Market Overview
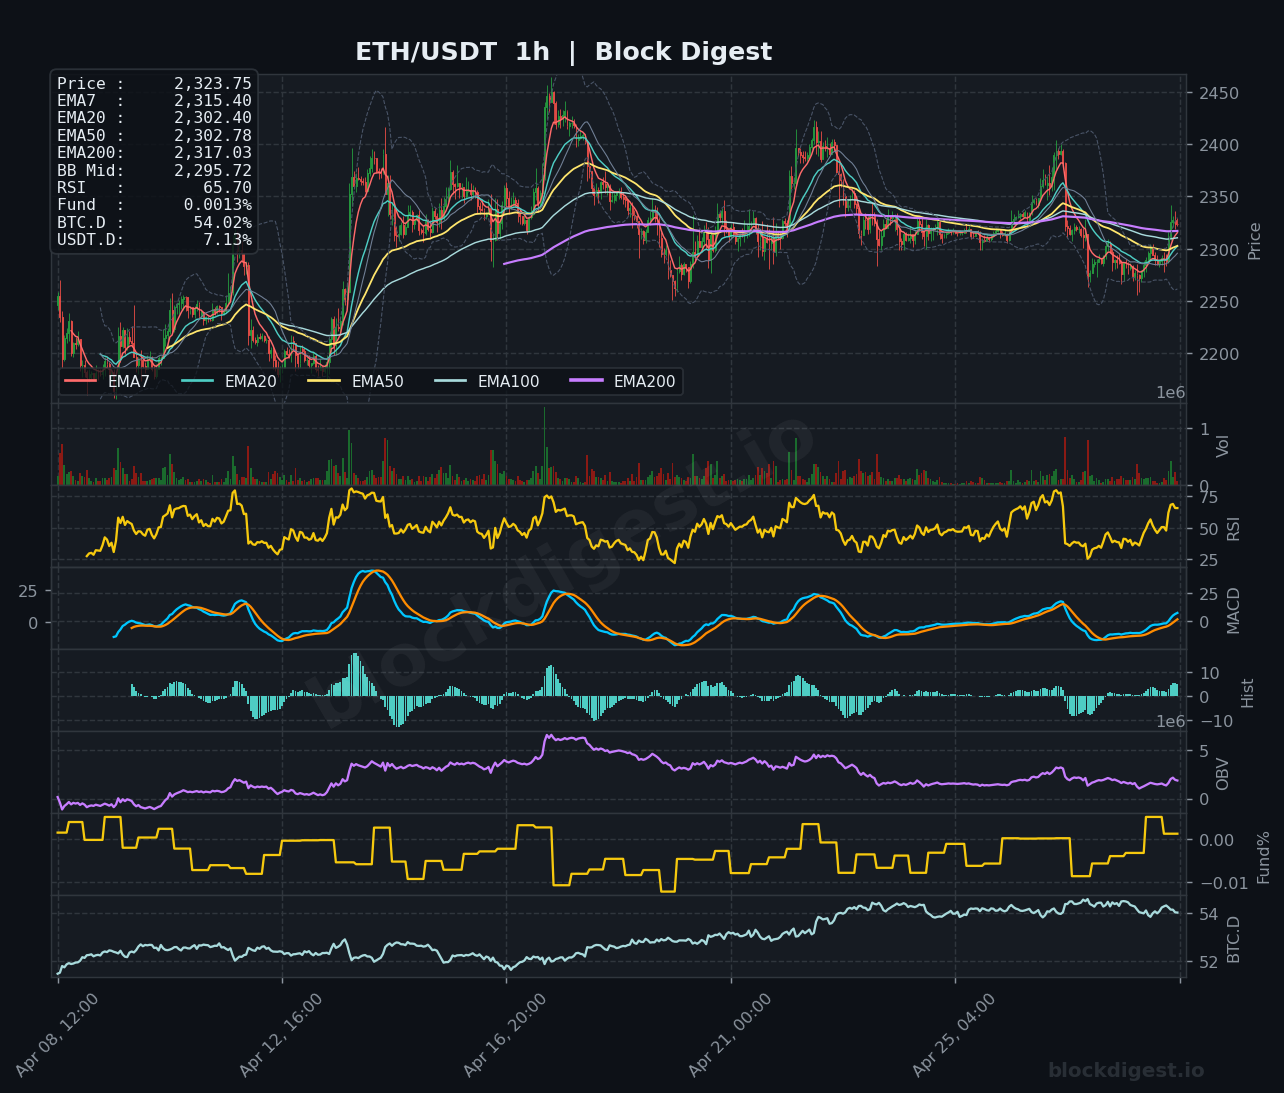
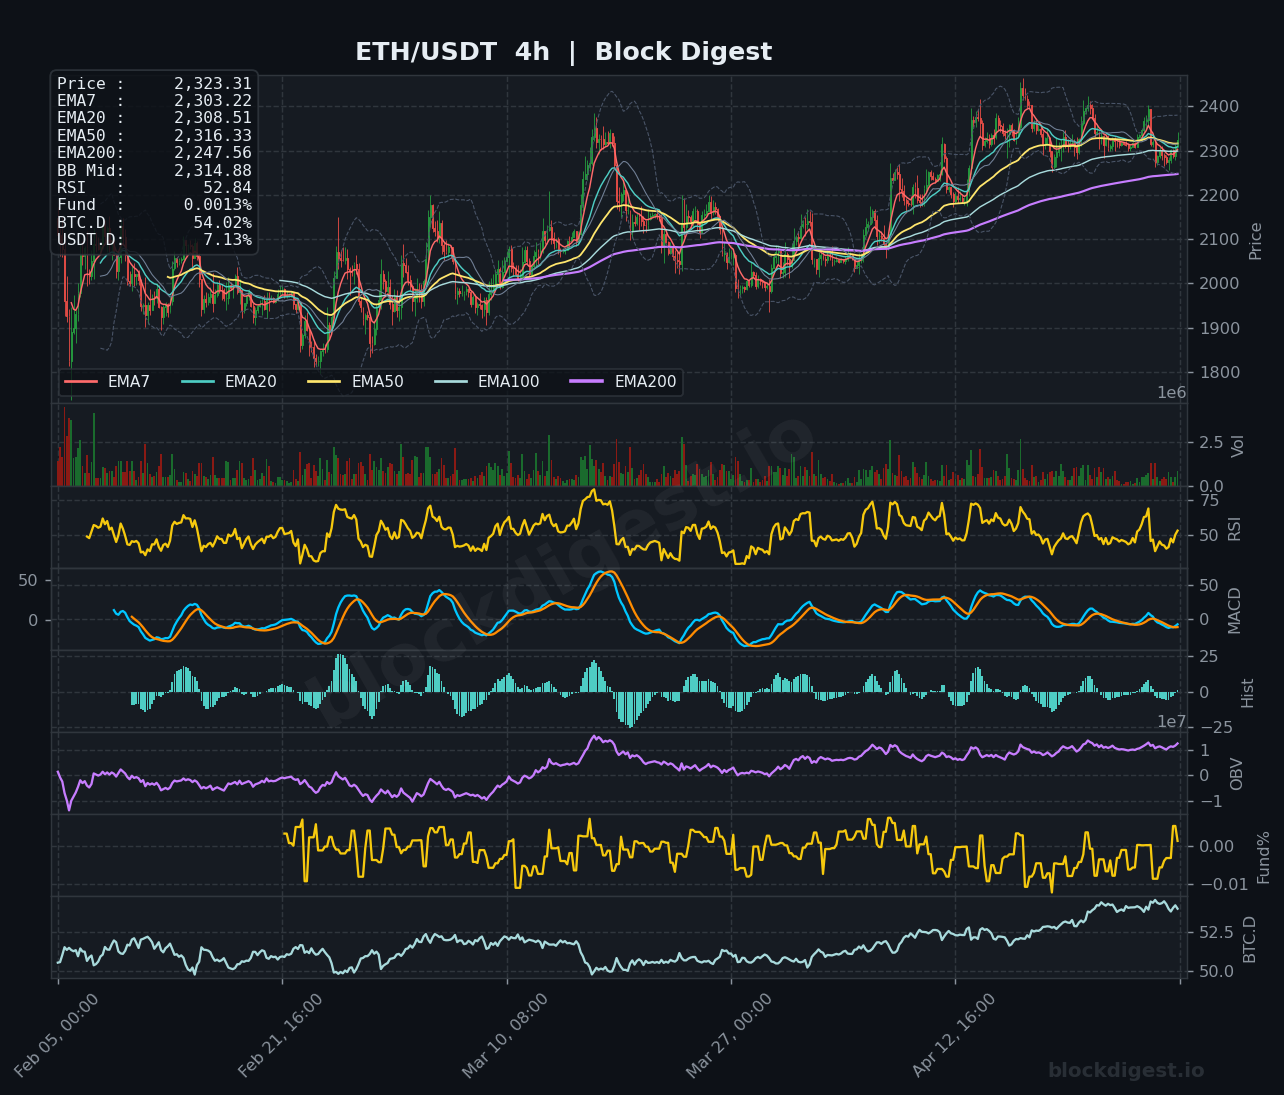
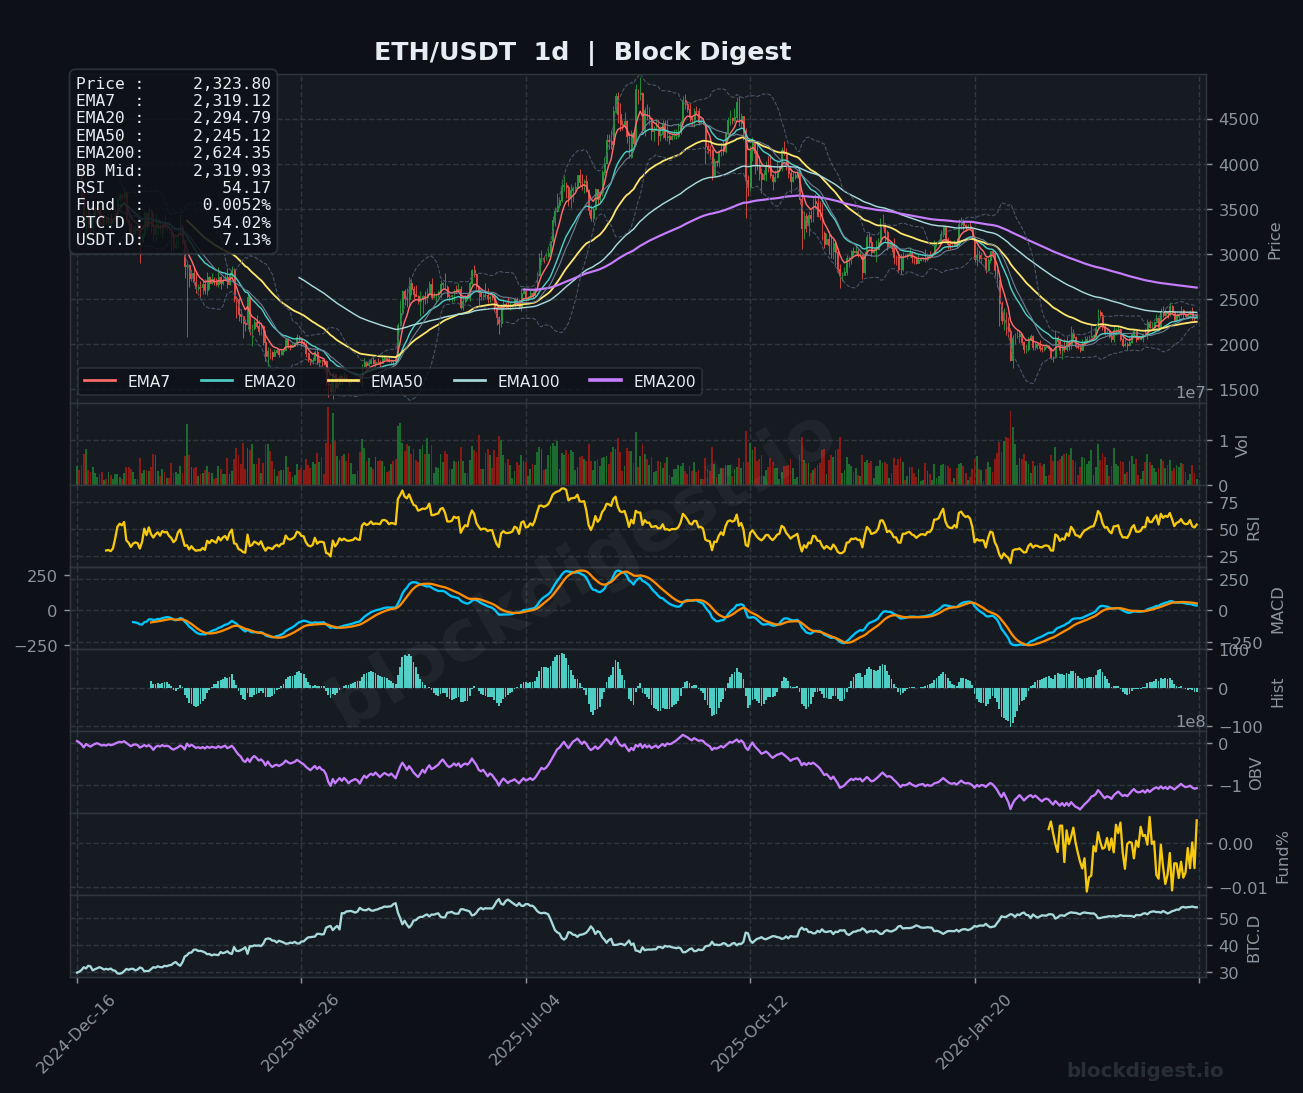
ETH is currently trading at $2,323.75, consolidating within a tight range just above the key $2,300 psychological level. Price action remains compressed between the EMA20 ($2,302.40) and EMA50 ($2,302.78) on the 1-hour timeframe, indicating short-term indecision. On the daily chart, ETH is positioned above the EMA7 ($2,319.12) and EMA20 ($2,294.79) but remains capped below the EMA50 ($2,245.12), reflecting a nascent recovery attempt within a broader downtrend structure. The Bollinger Bands are contracting across all timeframes, suggesting an imminent volatility expansion that could define the next directional move.
Multi-Timeframe Confluence
The multi-timeframe analysis reveals mixed signals with increasing bullish alignment emerging on lower timeframes. The 1-hour chart shows price successfully bouncing from the $2,270 support zone with EMAs beginning to flatten and converge, typical of range-bound consolidation. The 4-hour timeframe demonstrates price stabilizing above the EMA20 ($2,308.51) after testing it multiple times, with the EMA7 ($2,303.22) providing dynamic support. However, the daily timeframe reveals the critical challenge: price remains below the downward-sloping EMA200 ($2,624.35) and struggles beneath EMA50 resistance. The convergence of the $2,300-$2,320 zone across all three timeframes establishes this as the pivotal battleground for the next directional break.
Key Levels to Watch
Resistance:
- $2,380-$2,400: Major resistance cluster coinciding with recent rejection zones and the upper Bollinger Band on the 4-hour chart; a decisive break would signal renewed bullish momentum
- $2,450-$2,470: Secondary resistance aligning with the daily EMA50 and previous consolidation area; reclaiming this level would confirm trend reversal potential
- $2,550-$2,600: Major structural resistance zone where the daily EMA200 intersects with multiple rejection wicks from the broader downtrend
Support:
- $2,270-$2,290: Immediate support cluster representing the recent swing low and 4-hour EMA50 convergence; holding this level is critical for maintaining bullish structure
- $2,200-$2,220: Secondary support zone marked by previous consolidation and Bollinger Band lower boundary on the daily chart; loss of this area would expose deeper retracements
- $2,100-$2,150: Major support representing a significant accumulation zone and psychological level; breakdown below this would invalidate the recovery narrative
Momentum & On-Chain Signals
Momentum indicators present a cautiously optimistic picture with notable divergences developing. The RSI across all timeframes shows recovery from oversold conditions: 65.70 on the 1-hour (approaching overbought territory), 52.84 on the 4-hour (neutral zone), and 54.17 on the daily (slight bullish bias). The MACD on lower timeframes has printed a bullish crossover with the histogram expanding positively, though the daily MACD remains flat near the zero line, indicating early-stage momentum rather than confirmed trend reversal. OBV has stabilized after recent selling pressure, showing subtle accumulation on the 1-hour and 4-hour charts, though the daily OBV remains relatively flat. The funding rate at 0.0013% suggests neutral perpetual futures sentiment with no extreme positioning, while the slightly elevated rate indicates mild bullish bias in leveraged markets without excessive exuberance.
BTC Dominance & Market Sentiment
Bitcoin dominance currently stands at 54.02%, reflecting continued capital concentration in BTC amid broader market uncertainty. This elevated dominance typically correlates with reduced altcoin performance, including ETH, as traders seek relative safety during consolidation phases. USDT dominance at 7.13% indicates moderate stablecoin positioning—not extreme flight-to-safety levels, but suggesting market participants remain cautious rather than aggressively deploying capital. For ETH to mount a sustained rally, either BTC needs to lead with strong directional movement that pulls altcoins higher, or BTC dominance needs to decline as capital rotates into large-cap alternatives like ETH.
Risk Scenarios
Bullish case: A decisive 4-hour close above $2,380 with increasing volume would trigger breakout continuation toward the $2,450-$2,470 resistance zone, potentially reaching $2,550 if momentum sustains. Confirmation would come from the daily EMA20 crossover above EMA50 (golden cross formation) combined with RSI maintaining above 55 and OBV showing clear accumulation. The bullish scenario gains validity if BTC dominance begins declining alongside rising USDT.D outflows.
Bearish case: Failure to hold $2,290 support with a 4-hour close below this level would likely trigger cascading sell pressure toward $2,220 and potentially $2,150. A breakdown would be confirmed by bearish MACD crossover on the 4-hour chart, RSI dropping below 45, and declining OBV indicating distribution. Rising BTC dominance above 55% combined with USDT.D climbing above 7.5% would reinforce the bearish scenario as capital exits risk assets.
Outlook
ETH is positioned at a critical inflection point with compression patterns suggesting an imminent directional move within the next 24-48 hours. The slight bullish bias stems from improving momentum on lower timeframes, successful defense of $2,290 support, and nascent accumulation signals. However, traders should remain cautious given the daily timeframe’s bearish structure and resistance from the EMA50. The key trigger to watch is a sustained break above $2,350 with volume confirmation, which would likely accelerate toward $2,400. Conversely, a breakdown below $2,280 would invalidate the bullish setup and suggest continuation of the broader corrective phase. Given current tight range conditions, position sizing should reflect elevated breakout/breakdown risk, with stop-losses placed clearly beyond $2,270 for longs or above $2,400 for shorts.
Disclaimer: This analysis is for informational purposes only and does not constitute financial advice. Cryptocurrency markets are highly volatile and unpredictable. All trading decisions should be made based on your own research and risk tolerance. Block Digest is not responsible for any financial losses incurred as a result of acting on this content.
Charts