ETH Daily Analysis — May 04, 2026
ETH Daily Analysis – May 04, 2026
Market Overview
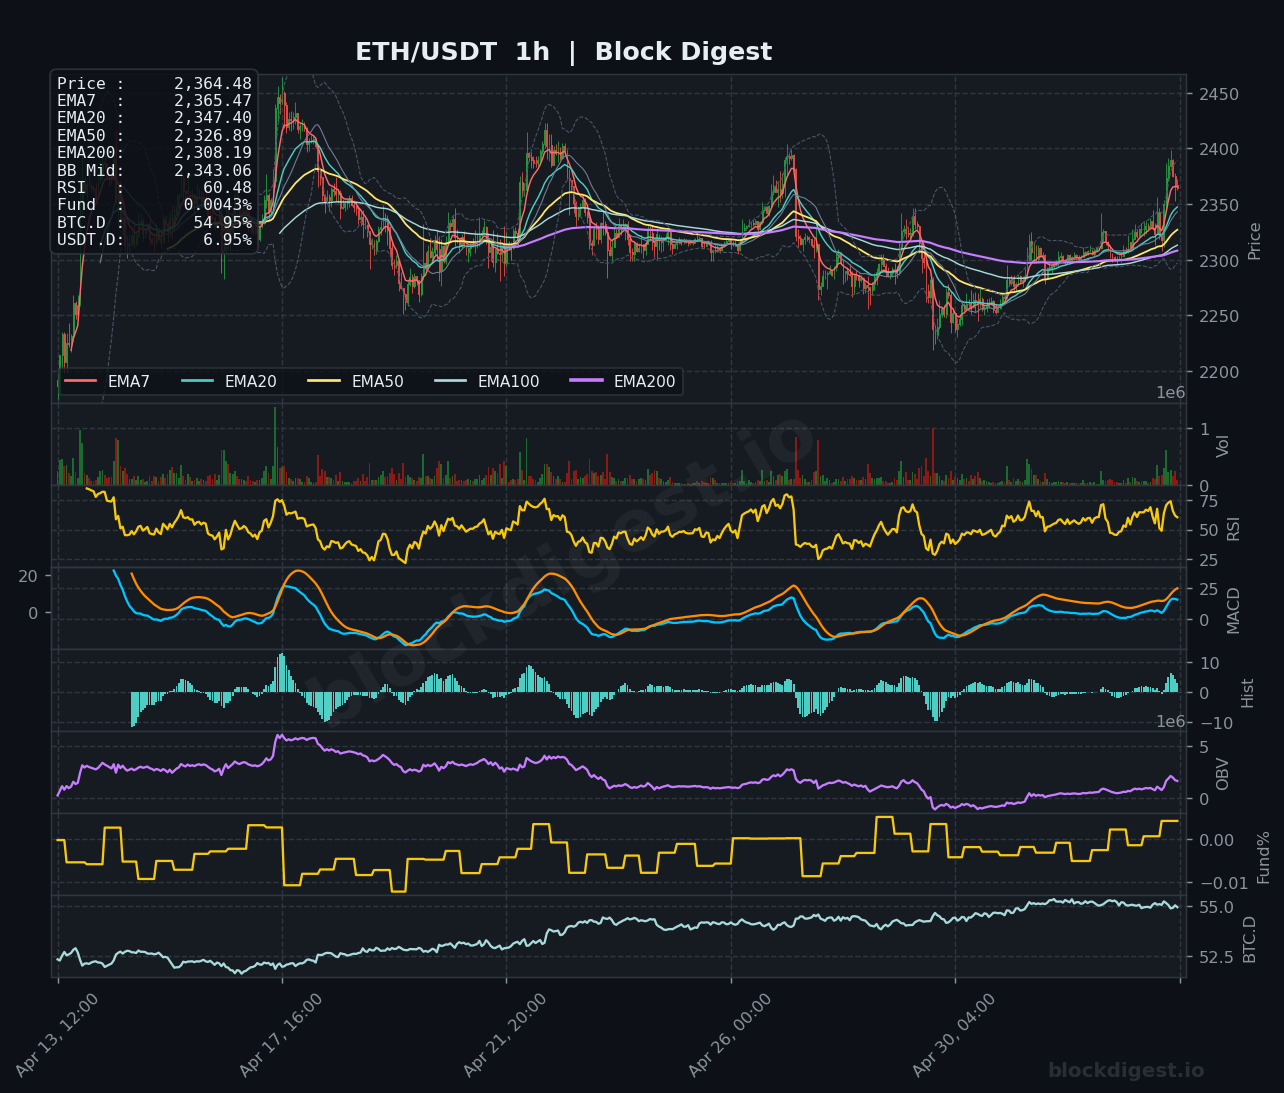
ETH is trading at $2,364.48, positioned in a consolidation phase near critical resistance levels. Price remains caught between the EMA50 ($2,326.89 on 1h, $2,308.92 on 4h, $2,255.02 on 1d) and EMA200 levels, indicating indecisive market structure. The daily timeframe shows price trading below all major EMAs except the shorter-term averages, while the hourly chart displays compression near the Bollinger Band midline at $2,343.06. This positioning suggests ETH is at an inflection point, with the immediate price action likely to determine whether we see continuation higher or a return to recent lows.
Multi-Timeframe Confluence
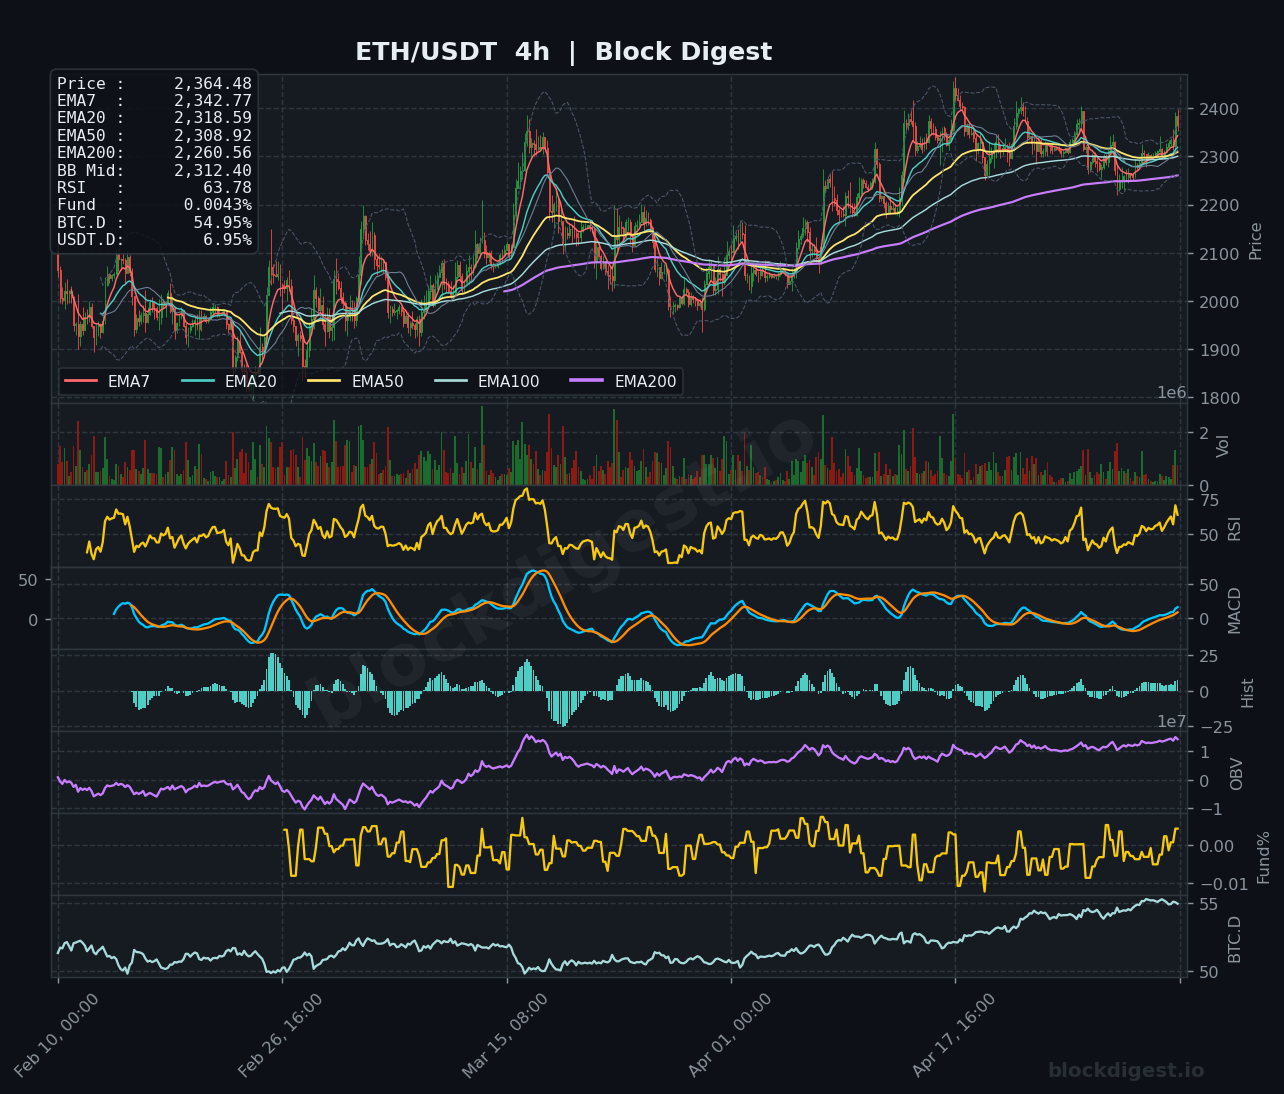
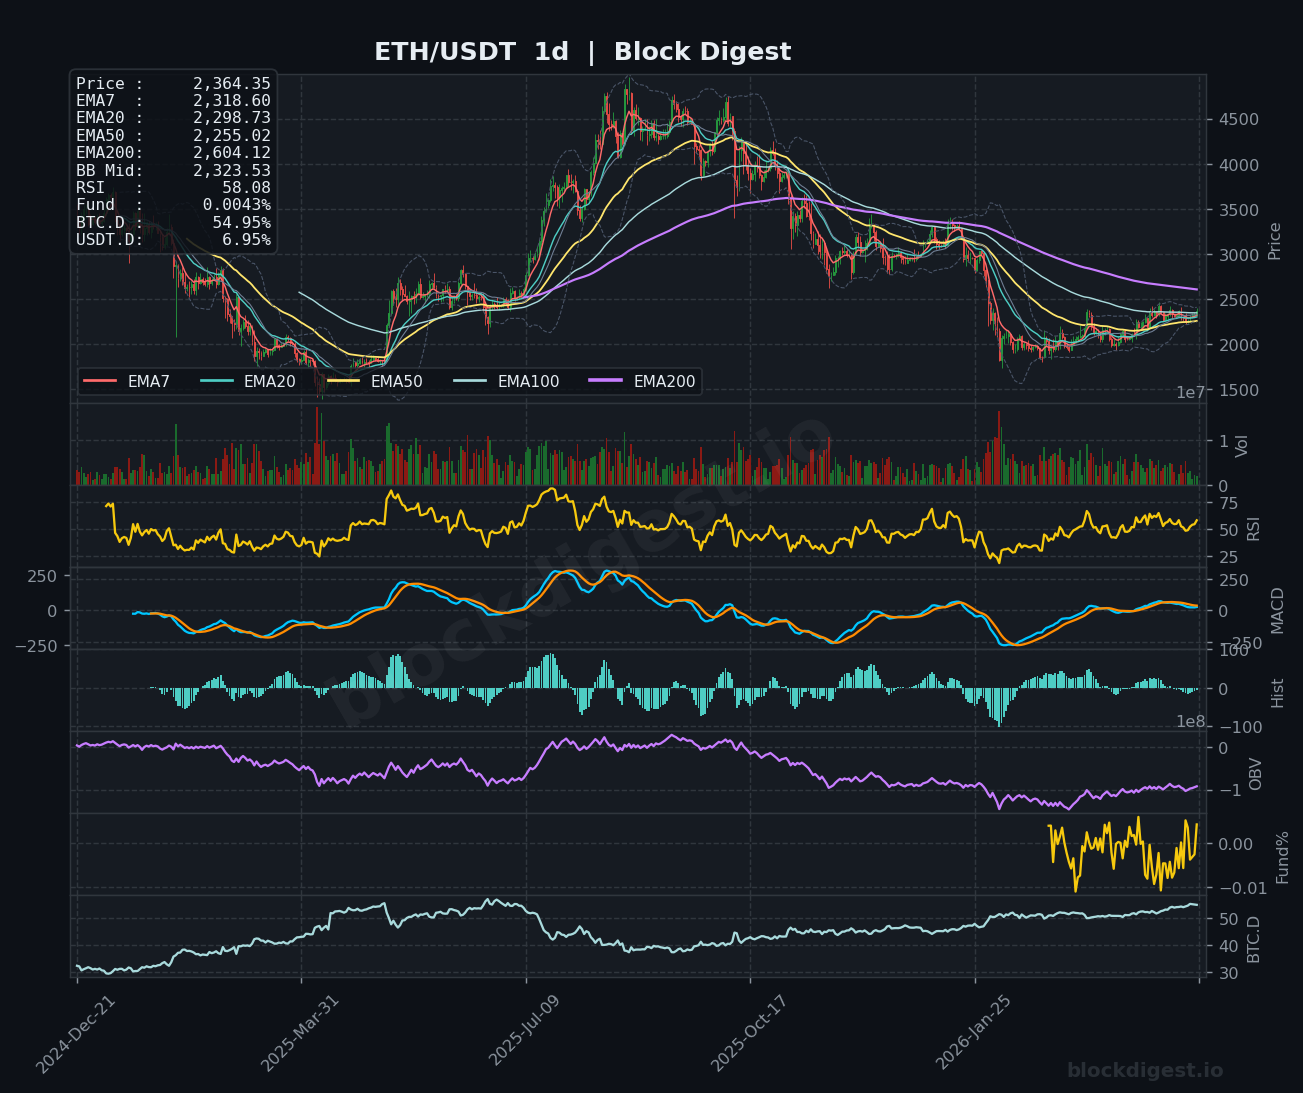
The three timeframes present mixed signals with limited bullish alignment. The 1-hour chart shows price attempting to stabilize above $2,300 with EMAs beginning to flatten, while the 4-hour timeframe displays price trading above the EMA50 ($2,308.92) but struggling to reclaim the EMA20 ($2,318.59) convincingly. The daily timeframe remains structurally bearish with price below the critical EMA200 at $2,604.12, though recent candles show attempts to establish support above $2,255. Key confluence exists around $2,300-2,310, where multiple timeframe EMAs cluster—this zone will be critical for determining near-term direction.
Key Levels to Watch
Resistance:
- $2,400-2,420: Previous consolidation zone visible on the 4h chart; EMA7 on the 4h at $2,342.77 acts as immediate resistance, with this level representing the next meaningful barrier
- $2,450-2,470: Significant historical resistance area where multiple rejections occurred; corresponds to upper Bollinger Band regions on lower timeframes
- $2,604.12: Daily EMA200—the most critical resistance level that would signal a structural trend change if reclaimed with conviction
Support:
- $2,300-2,310: Immediate support zone aligning with 4h EMA50 and acting as the bull/bear line for short-term sentiment
- $2,255-2,260: Daily EMA50 and prior consolidation base; critical level that has provided support on recent tests
- $2,180-2,200: Major support zone visible on the daily chart representing the recent swing low area; loss of this level would signal deeper correction
Momentum & On-Chain Signals
RSI readings show neutral to slightly bullish momentum: 60.48 on the 1h, 63.78 on the 4h, and 58.08 on the daily—all positioned above the 50 midpoint but below overbought territory, indicating room for upside if buyers emerge. The MACD across timeframes shows recent bullish crossovers with the histogram turning positive, though momentum remains modest without strong conviction. OBV displays a gradual uptrend on the daily chart, suggesting steady accumulation despite price consolidation, which is constructive for a potential bullish resolution. Funding rates remain neutral at 0.0043%, indicating balanced perpetual market positioning without excessive leverage on either side—this suggests any directional move won’t be immediately amplified by cascading liquidations.
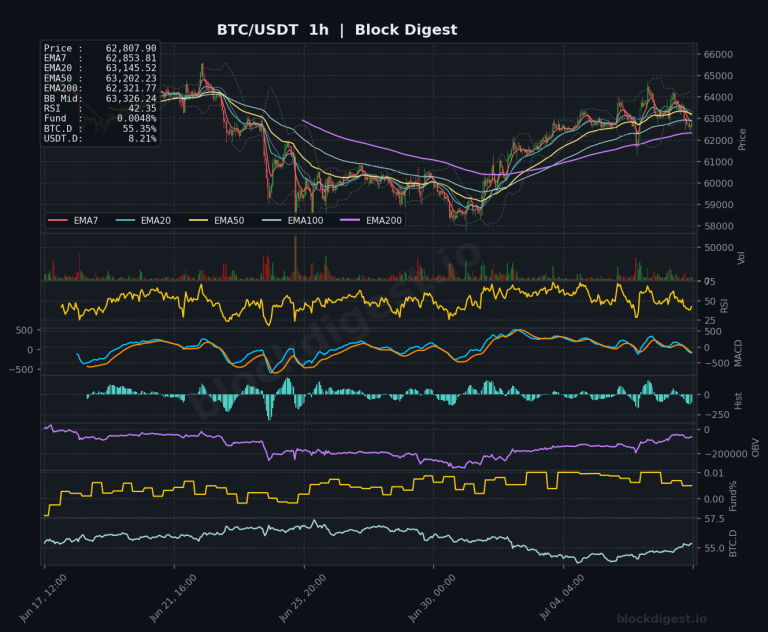
BTC Dominance & Market Sentiment
BTC dominance stands at 54.95% with an upward trajectory visible across recent timeframes, suggesting capital rotation favoring Bitcoin over alts including ETH. USDT dominance at 6.95% shows relative stability without significant movement, indicating neither extreme risk-on nor risk-off conditions in the broader market. This dynamic presents a headwind for ETH, as rising BTC.D typically correlates with underperformance in major altcoins, requiring BTC to either stabilize or for ETH-specific catalysts to drive independent strength.
Risk Scenarios
Bullish case: A decisive break and 4-hour close above $2,400 with sustained volume would confirm short-term bullish continuation, targeting the $2,450-2,470 resistance zone initially, with extended targets toward $2,600 if momentum accelerates. This scenario requires OBV to maintain its accumulation trend and RSI on the 4h to push into the 70+ zone with price reclaiming position above all shorter-term EMAs.
Bearish case: Failure to hold the $2,300-2,310 support cluster would likely trigger a retest of $2,255, with breakdown below this level on increasing volume opening the door toward $2,180-2,200. This scenario would be confirmed by bearish MACD crossovers on the 4h chart and declining OBV, suggesting distribution and potential capitulation from recent buyers.
Outlook
ETH remains range-bound at a critical juncture with near-term direction dependent on whether bulls can reclaim $2,400 or bears push price below $2,300. The slight edge tilts neutral-to-bullish based on accumulative OBV patterns and positive MACD momentum, but conviction is lacking without a clear breakout. Traders should monitor the $2,310 level as the immediate line in the sand—holding this support with a move above $2,365 would favor testing $2,400+, while losing $2,300 would likely accelerate toward $2,255. The next 24-48 hours will be critical for establishing directional bias, with volume expansion on any breakout serving as the key confirmation signal.
Disclaimer: This analysis is for informational purposes only and does not constitute financial advice. Cryptocurrency markets are highly volatile and unpredictable. All trading decisions should be made based on your own research and risk tolerance. Block Digest is not responsible for any financial losses incurred as a result of acting on this content.