ETH Daily Analysis — April 28, 2026
Market Overview
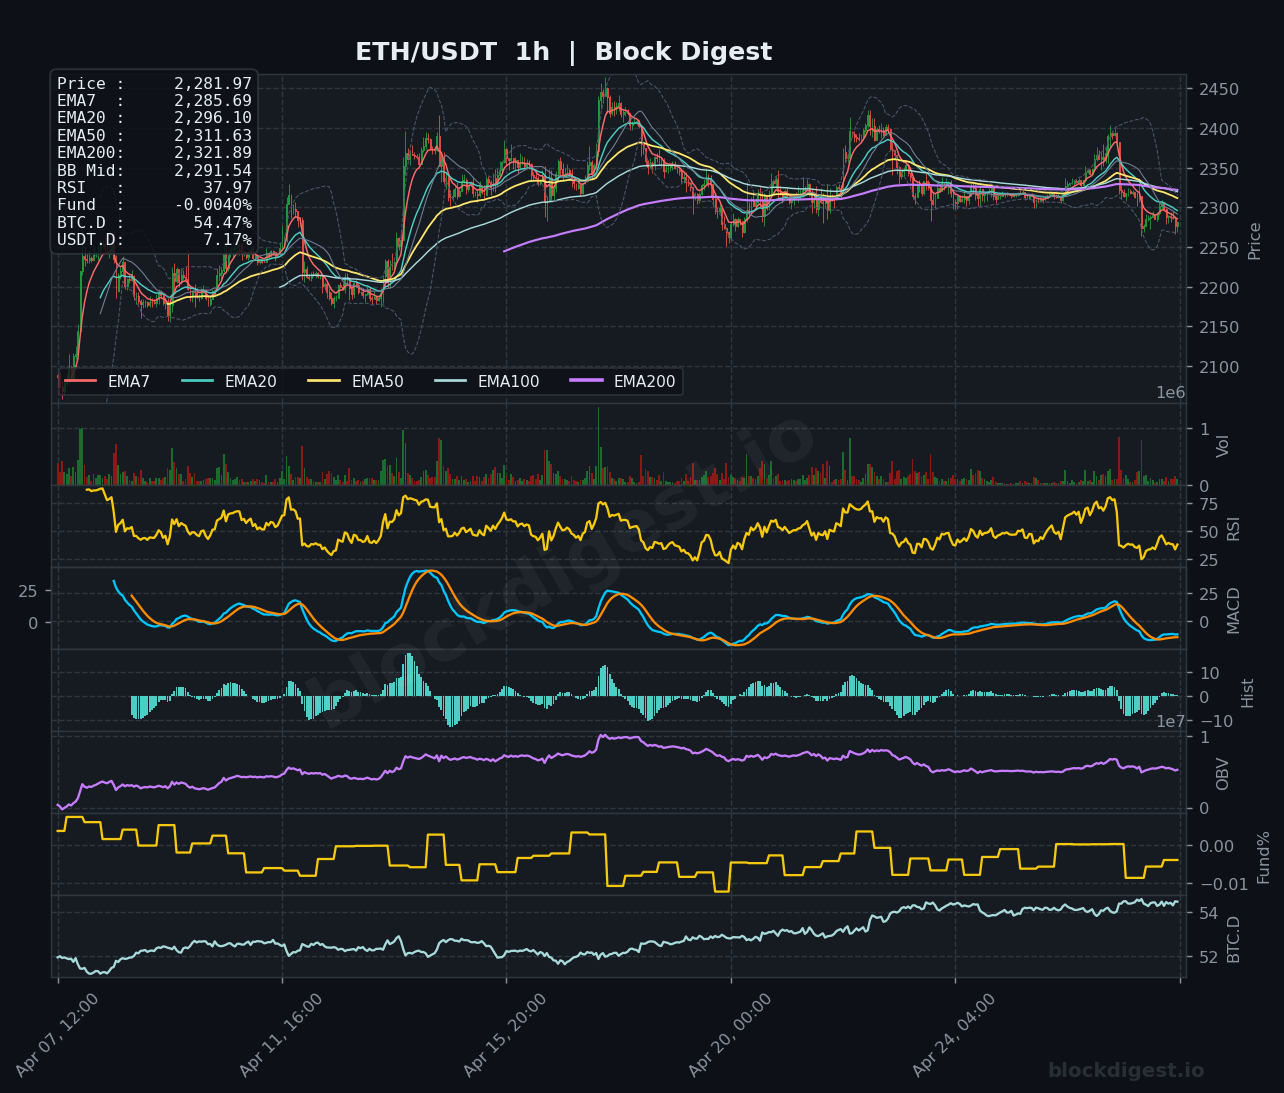
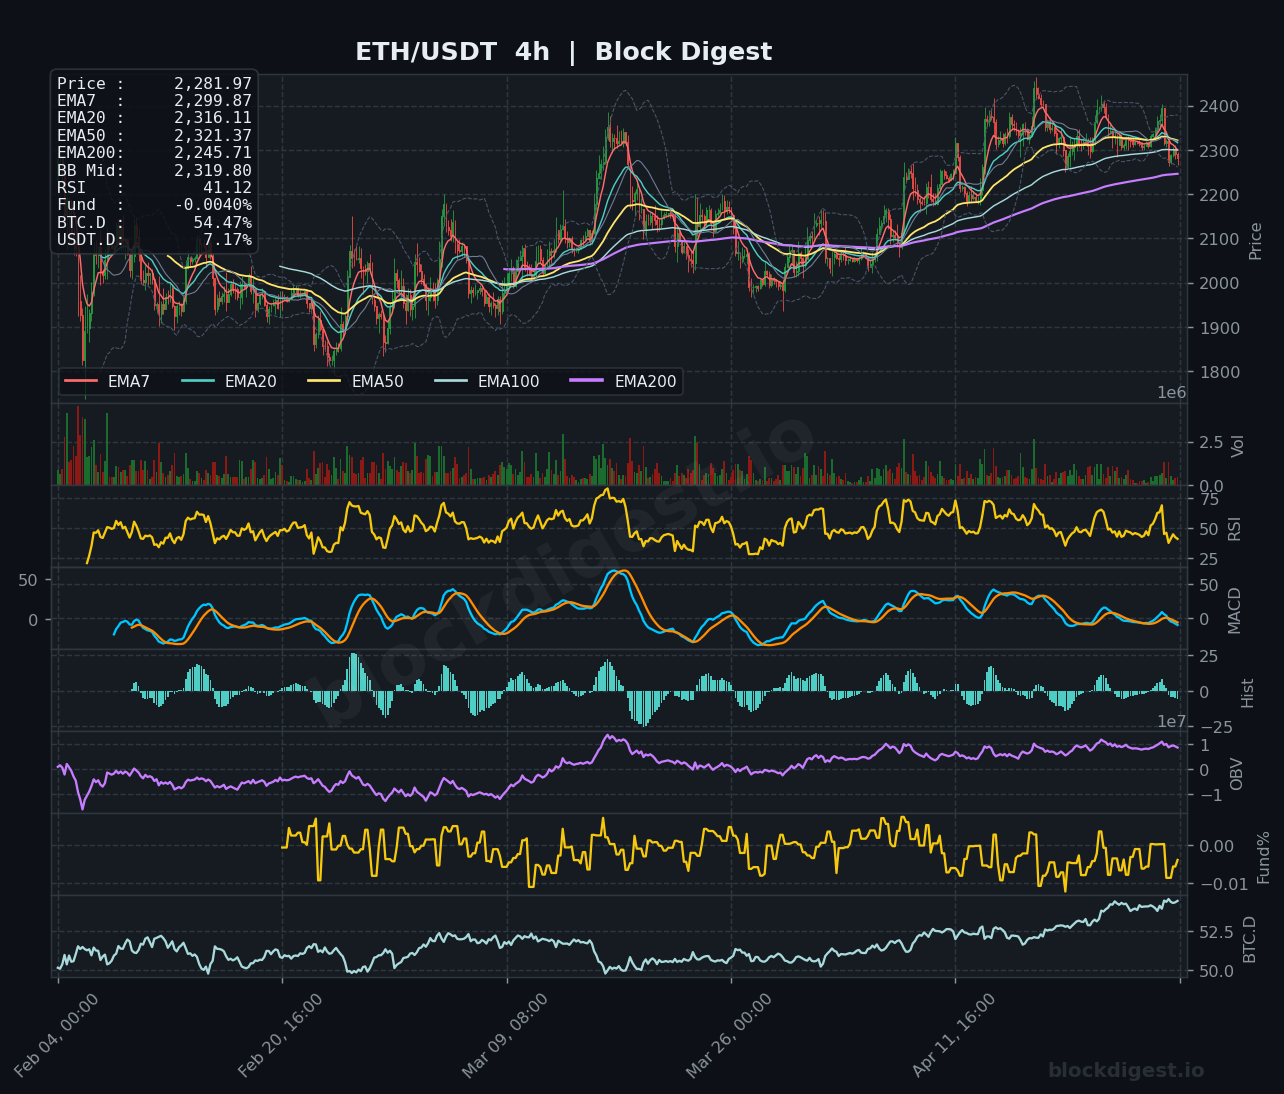
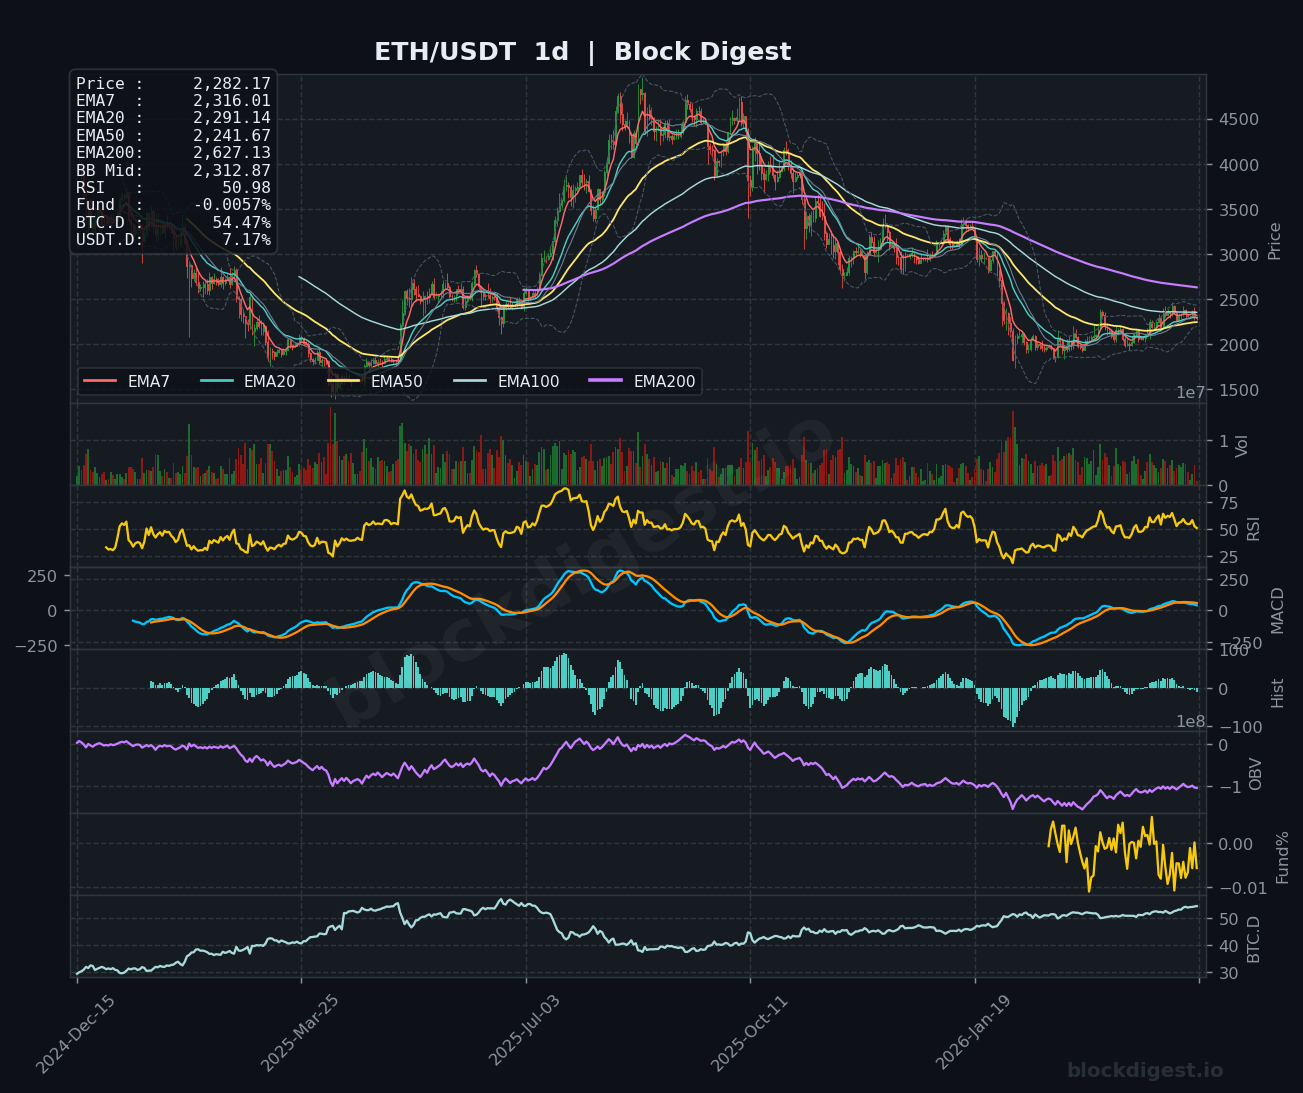
Ethereum is trading at $2,281.97, positioned below all major exponential moving averages on the 1-hour timeframe, signaling short-term bearish pressure. The daily chart reveals price trading near the lower Bollinger Band with the EMA structure showing a bearish configuration as shorter-term EMAs (EMA7 at $2,316.01) remain below longer-term averages (EMA200 at $2,627.13). The 4-hour timeframe shows a similar deterioration in structure, with price recently breaking below the EMA50 ($2,321.37) and continuing to compress against key support zones. Overall market structure suggests ETH is in a corrective phase following a failed attempt to establish momentum above $2,400 in mid-April.
Multi-Timeframe Confluence
All three timeframes demonstrate bearish alignment, with the 1-hour chart showing immediate downside pressure as price remains trapped below the $2,290-$2,310 resistance cluster formed by converging EMAs. The 4-hour timeframe confirms this weakness, displaying a clear bearish EMA cascade with EMA7 ($2,299.87) crossing below EMA20 ($2,316.91), while the daily chart maintains a downtrend structure beneath the declining EMA50 ($2,241.67). A critical confluence zone emerges around $2,240-$2,250, where the daily EMA50 intersects with previous support from mid-April consolidation patterns. The consistency of bearish signals across timeframes suggests limited near-term upside potential unless a decisive break above $2,320 occurs with volume confirmation.
Key Levels to Watch
Resistance:
- $2,310-$2,320: Immediate resistance zone where 1h EMA50 ($2,311.63) and 4h EMA50 ($2,321.37) converge, representing the first hurdle for any recovery attempt
- $2,350-$2,370: Secondary resistance marked by the 4h EMA7 rejection zone and previous consolidation area from late April
- $2,400-$2,420: Major resistance level aligning with recent failed breakout attempts and the psychological $2,400 handle
Support:
- $2,280-$2,290: Current price zone with immediate support; loss of this level would expose further downside
- $2,240-$2,250: Critical support confluence of daily EMA50 and previous consolidation lows from mid-April
- $2,150-$2,180: Major support zone representing late March/early April accumulation area and a potential demand zone for bulls
Momentum & On-Chain Signals
The RSI readings paint a concerning picture with the 1h RSI at 37.97, indicating oversold conditions in the short term, while the 4h RSI at 41.12 and daily RSI at 50.98 suggest room for further downside before reaching oversold territory on higher timeframes. MACD on the 1-hour chart shows a bearish crossover with negative histogram expansion, though the 4-hour MACD appears to be nearing a potential support level where reversals could occur. The OBV across timeframes shows declining accumulation, particularly evident on the daily chart where distribution appears to have accelerated since the April peak above $2,400. Funding rates at -0.0040% indicate a slight bearish bias among perpetual traders, though not extreme enough to suggest imminent squeeze potential.
BTC Dominance & Market Sentiment
Bitcoin dominance stands at 54.47%, showing continued strength relative to altcoins and suggesting risk-off behavior within the cryptocurrency market where capital flows toward BTC as a perceived safe haven. USDT dominance at 7.17% remains relatively elevated, indicating defensive positioning with traders maintaining higher stablecoin allocations rather than deploying capital aggressively into risk assets. This combination of rising BTC.D and elevated USDT.D creates a challenging environment for ETH, typically correlating with altcoin underperformance and limited upside potential until broader market risk appetite improves.
Risk Scenarios
Bullish case: A decisive reclaim of $2,320 with sustained trading above this level for multiple 4-hour candles would invalidate the immediate bearish structure and open the path toward $2,370-$2,400. Volume confirmation above 1.5x recent averages during this breakout would strengthen the reversal thesis, potentially targeting the $2,450-$2,500 zone where daily EMA resistance clusters reside.
Bearish case: Failure to hold the $2,280 support with a 4-hour close below $2,270 would likely trigger acceleration toward the $2,240-$2,250 critical support zone. Further breakdown below $2,240 could initiate a more significant correction toward $2,150-$2,180, representing a -5% to -7% decline from current levels and testing the structural support from Q1 2026.
Outlook
Ethereum faces a critical juncture with bearish technical alignment across all timeframes, though short-term oversold conditions on the 1-hour RSI suggest potential for a relief bounce. The key catalyst for directional clarity will be price action around the $2,280-$2,320 range over the next 24-48 hours; sustained weakness below $2,280 favors continuation toward $2,240, while reclaiming $2,320 could trigger short covering toward $2,370. The broader macro picture of elevated BTC.D and USDT.D suggests limited conviction for aggressive ETH longs until altcoin sentiment improves. Traders should monitor the daily EMA50 at $2,241.67 as the line in the sand—holding this level preserves medium-term structure, while losing it would signal deeper correction potential toward $2,150 and potentially retest of major support zones from March 2026.
Disclaimer: This analysis is for informational purposes only and does not constitute financial advice. Cryptocurrency markets are highly volatile and unpredictable. All trading decisions should be made based on your own research and risk tolerance. Block Digest is not responsible for any financial losses incurred as a result of acting on this content.
Charts