
ETH
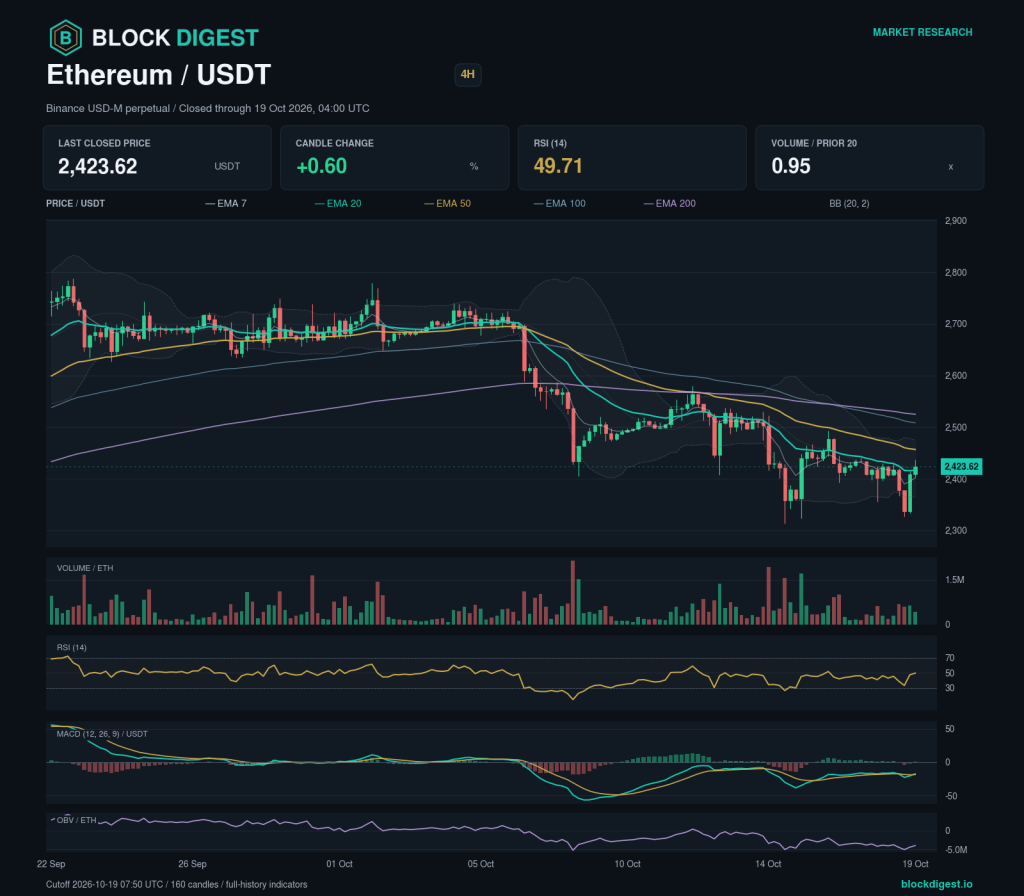
Ethereum Weekly: Daily and Weekly Structures Diverge
Weekly Market Overview Ethereum’s daily chart still shows lower confirmed highs and lows, even as weekly swings point higher. That disagreement limits conviction in the daily trend. Ethereum’s latest completed four-hour candle closed at 2,423.62 USDT, for the period ending 2026-10-19 04:00 UTC. The last daily close rose 0.31% from the previous close. The next...
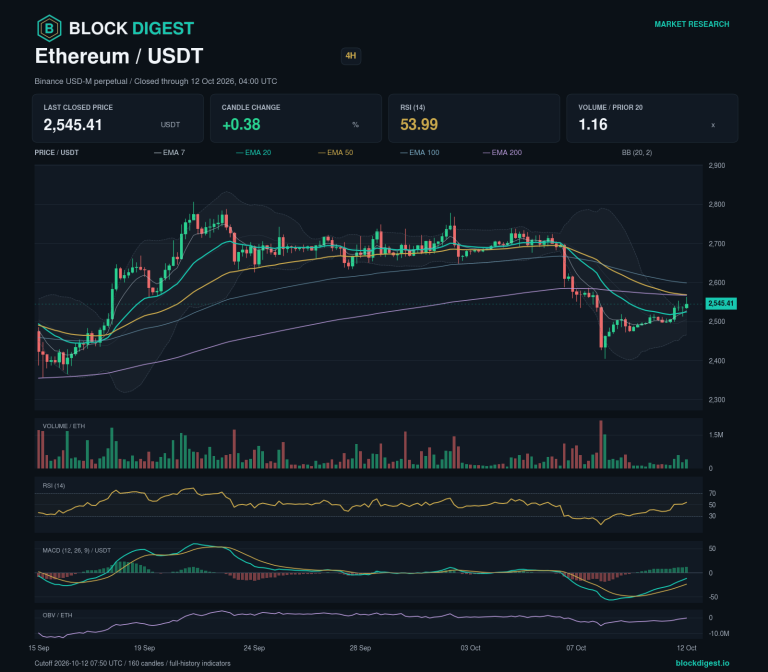
Ethereum Weekly: Key Levels Frame an Unsettled Structure
Weekly Market Overview Ethereum’s daily swing sequence offers no clear directional thesis. That puts the emphasis on the relevant support and resistance zones rather than a forecast of the next move. Ethereum’s latest completed four-hour candle closed at 2,545.41 USDT, for the period ending 2026-10-12 04:00 UTC. The last daily close rose 1.23% from the...
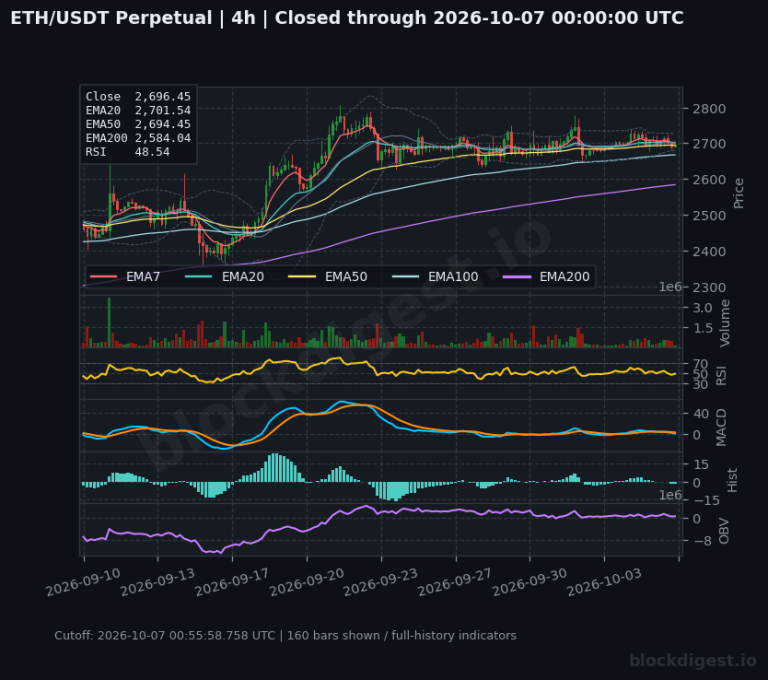
Ethereum Weekly: Higher Swings Set the Weekly Framework
Weekly Market Overview Higher confirmed daily highs and lows underpin the weekly assessment, leaving Ethereum’s daily swing structure constructive. Ethereum’s latest completed four-hour candle closed at 2,696.45 USDT, for the period ending 2026-10-07 00:00 UTC. The last daily close fell 0.45% from the previous close. BlockDigest’s base assessment is bullish. The next upside checkpoint requires...
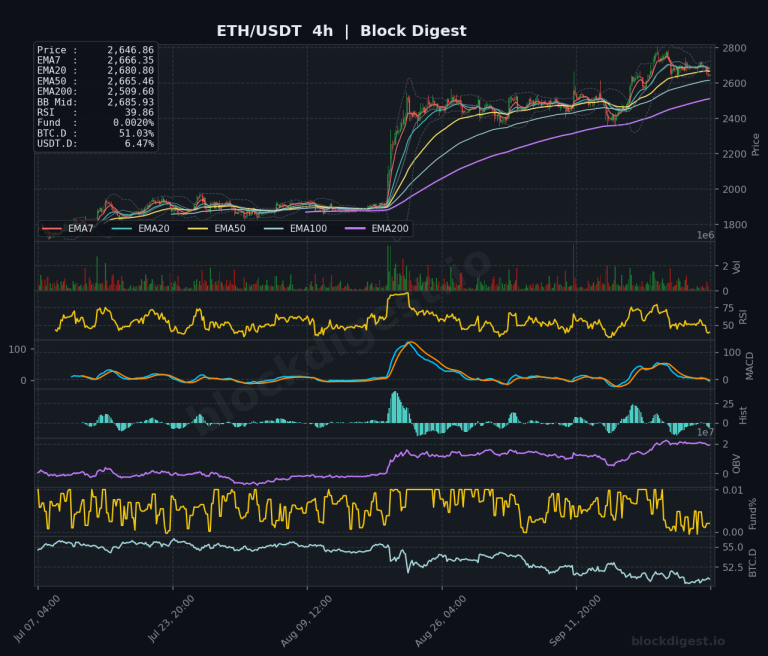
Ethereum Weekly Analysis: Ethereum consolidation near 2646 with bullish trend
Weekly Market Overview Ethereum is consolidating near multi-month highs, trading at 2646.86 after a powerful breakout from the 2000–2200 base. The weekly candle shows tight consolidation and slight upper-range compression beneath macro resistance, marking a pause after a period of aggressive expansion. The trend has shifted decisively bullish on the weekly timeframe, with the asset...
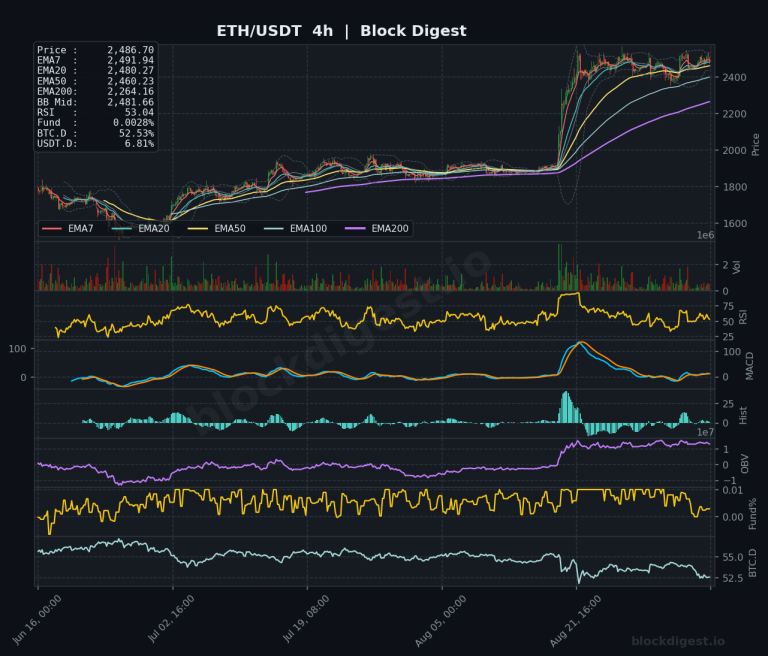
Ethereum Weekly Analysis: Ethereum Consolidates Beneath $2,485 Resistance Level
Weekly Market Overview Ethereum is consolidating directly beneath critical multi-month resistance after an aggressive vertical expansion out of the sub-$2,000 accumulation range. The current weekly candle reflects tight compression around the $2,485 mark, showing shrinking bodies and a narrower intraweek range after weeks of sustained buying. This structural pause preserves the series of higher lows...
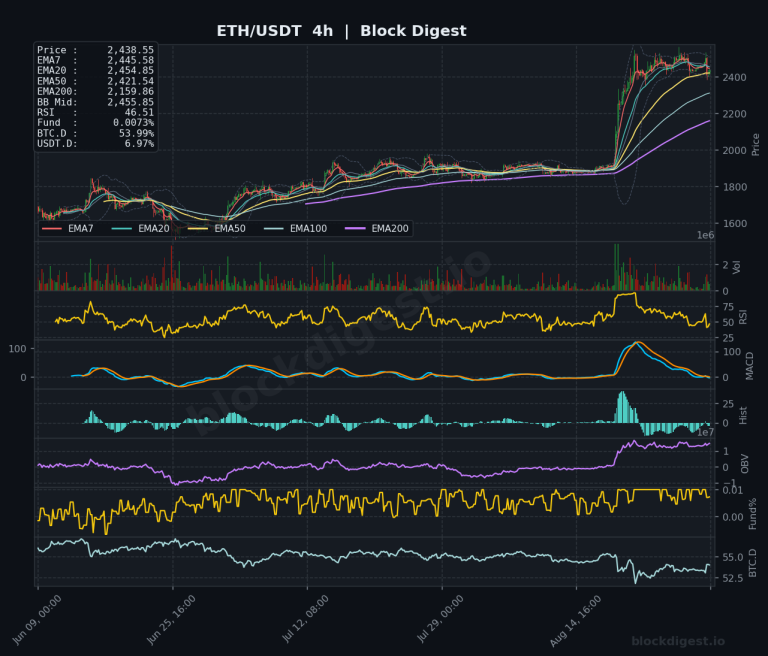
Ethereum Weekly Analysis: Reclaiming 50 EMA at $2,373
Weekly Market Overview Ethereum trades at $2,438.55 as the final weekly candle of August consolidates near multi-month highs following a powerful impulsive expansion off the summer base. The weekly structure shows aggressive absorption of overhead supply, with price reclaiming the weekly 50 EMA at $2,373.20 and pressing directly into major structural resistance. This transition shifts...
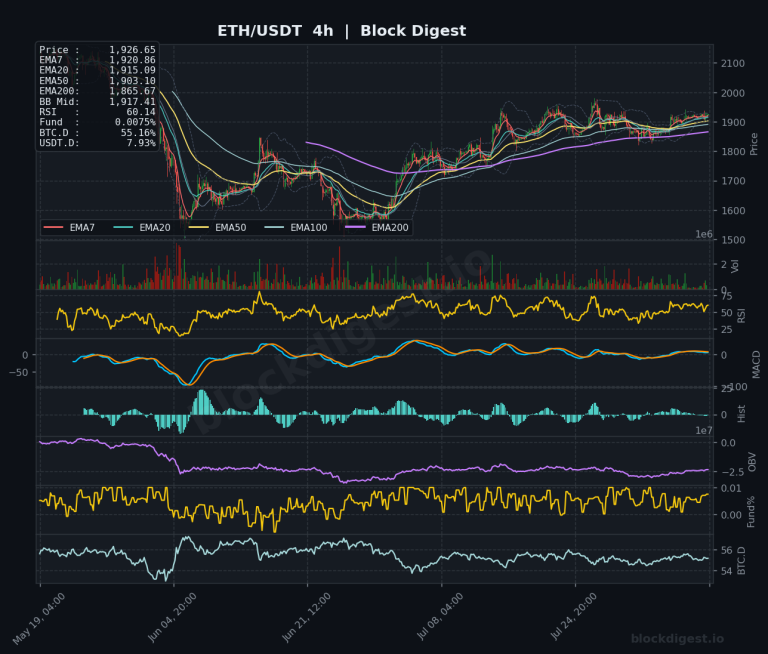
Ethereum Weekly Analysis: Ethereum Consolidates Below $2,000 Resistance Level
Weekly Market Overview Ethereum closed the week at approximately $1,926, posting a modest gain of roughly 0.33% as price action continued to consolidate within a historically significant range just below the psychologically important $2,000 level. The weekly candle structure reflects subdued directional conviction — a tight-bodied candle with contained wicks — suggesting an ongoing tug-of-war...
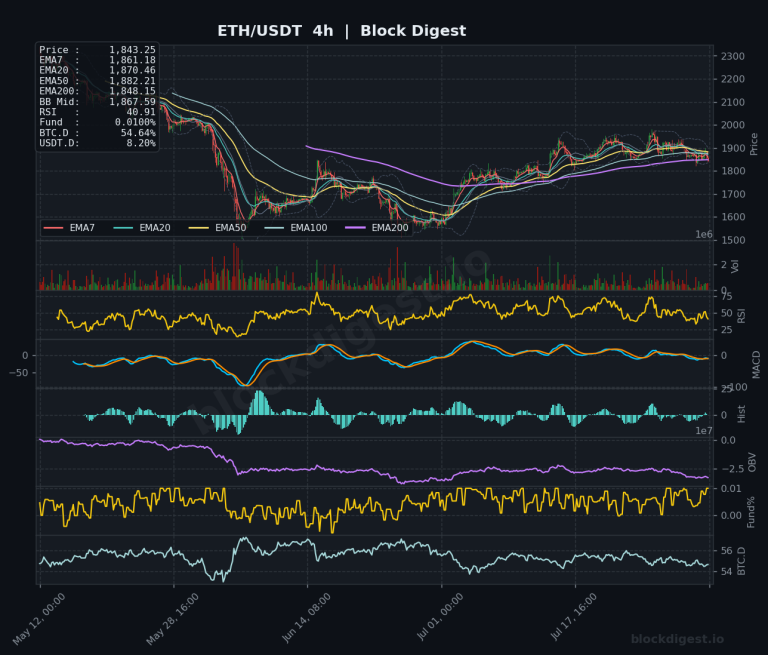
Ethereum Weekly Analysis: Ethereum slides to $1,843, resistance holds at $1,950
Weekly Market Overview Ethereum enters the week of August 3, 2026 under meaningful selling pressure, with price trading around $1,843 after a 3%+ decline in the most recent session. The weekly candle structure reflects a continuation of the broader downtrend that has dominated ETH since its cycle highs, with price struggling to sustain any meaningful...
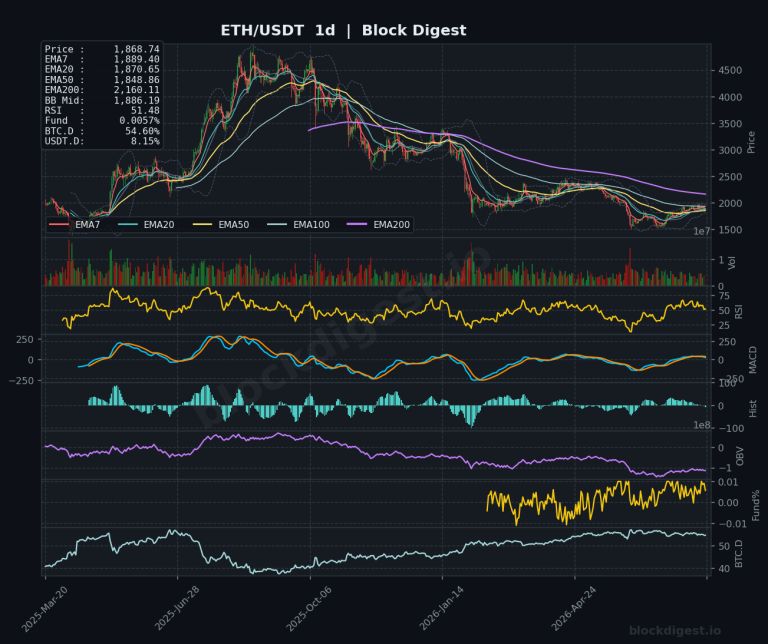
Ethereum Monthly Analysis: Ethereum Retests 2023 Base at $1,868
Macro Market Overview Ethereum enters August 2026 printing what is shaping up to be a structurally significant monthly candle, currently holding near $1,868 after a pronounced multi-month downtrend that has erased the majority of the 2024–2025 bull cycle gains. On the monthly chart, price has now retraced deep into the macro consolidation zone that defined...
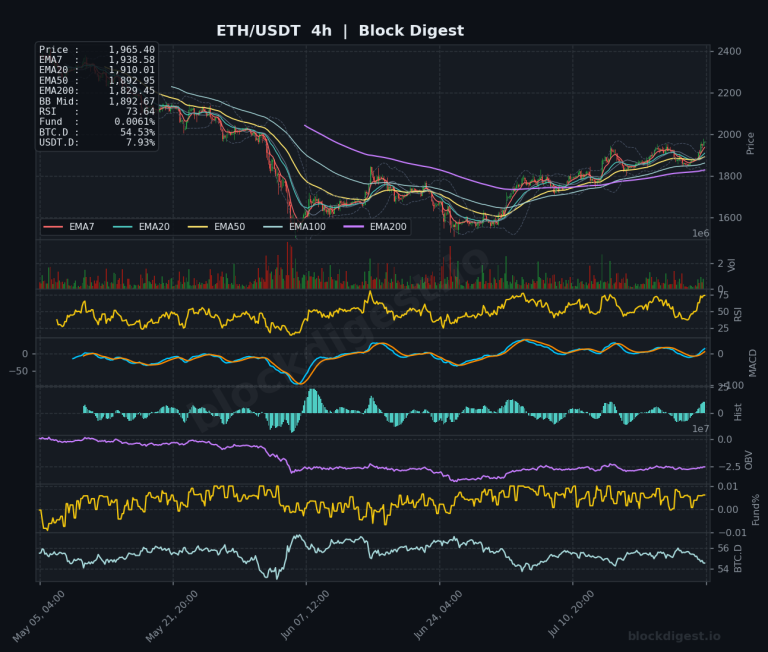
Ethereum Weekly Analysis: Ethereum Rejected at $2,000 Resistance Level
Weekly Market Overview Ethereum is trading at $1,965.40 as of the July 27, 2026 analysis date, holding just below the psychologically significant $2,000 level after a volatile week defined by a sharp intraweek rally followed by a pullback. The weekly candle is forming a potential bearish wick rejection near $2,000, suggesting sellers remain active at...
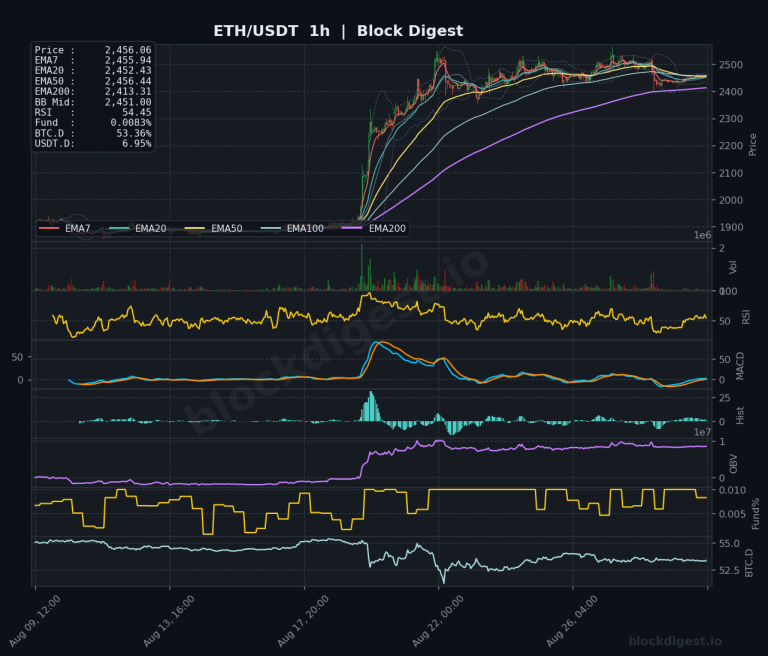
Ethereum Daily Technical Analysis
Market Overview Ethereum is currently navigating a pivotal consolidation phase, trading at $2,456.06, which places it firmly above all major daily EMAs. The price action remains constructive, holding well above the daily Bollinger Band midline of $2,219.25, signaling a sustained bullish structure on the higher timeframe. While the daily trend is clearly defined by the...
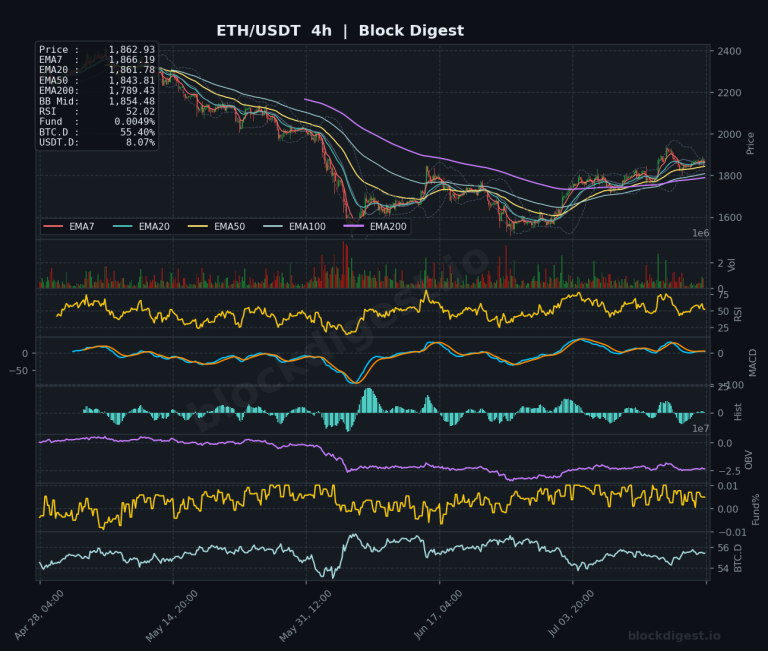
Ethereum Weekly Analysis: Ethereum at $1,862 amid inflation and geopolitical tensions
Weekly Market Overview Ethereum enters the week of July 20, 2026 trading at approximately $1,862, clinging to a tentative recovery structure after what has been a prolonged and punishing bear trend from the 2025 highs above $4,000. The week’s price action has been shaped by competing forces: a softer-than-expected U.S. inflation print briefly propelled ETH...