
Weekly Analysis
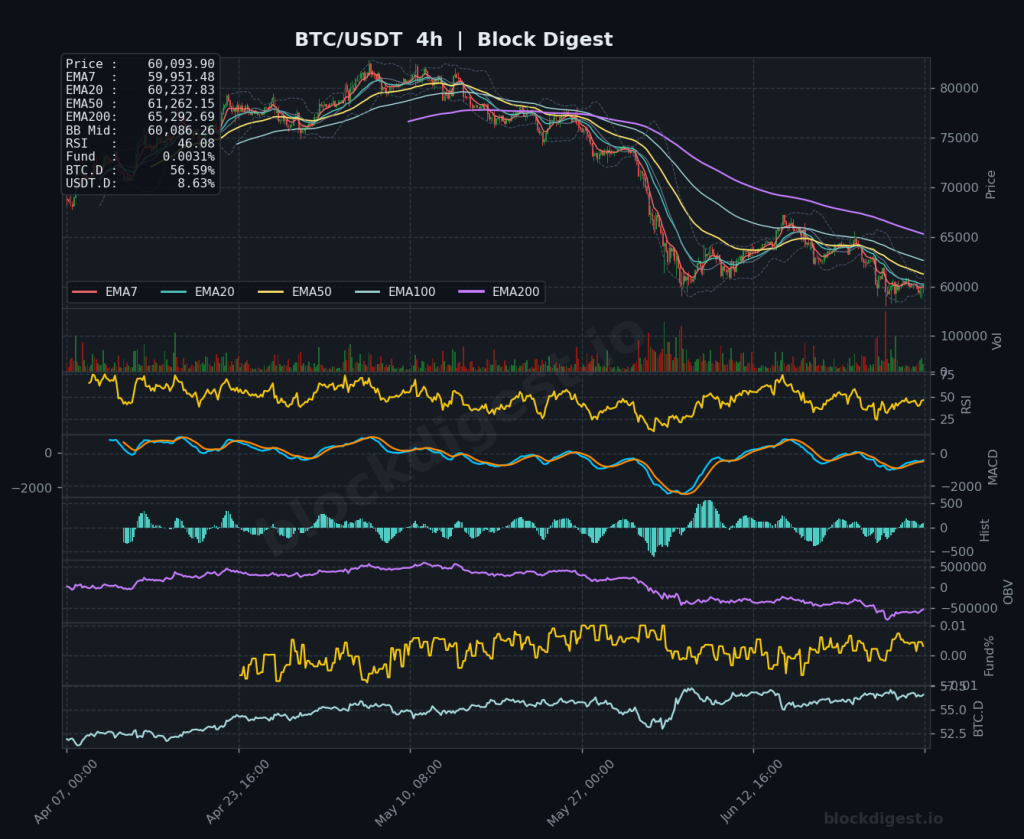
Bitcoin Weekly Analysis: Breakdown Below $60K After Sustained Selling Pressure
Weekly Market Overview Bitcoin closes the week of June 29, 2026 at approximately $60,087, marking a significant deterioration in market structure as price has breached the psychologically critical $60,000 zone. The weekly candle reflects sustained selling pressure following a prolonged downtrend from the all-time high region above $109,000, with price now trading at levels not...
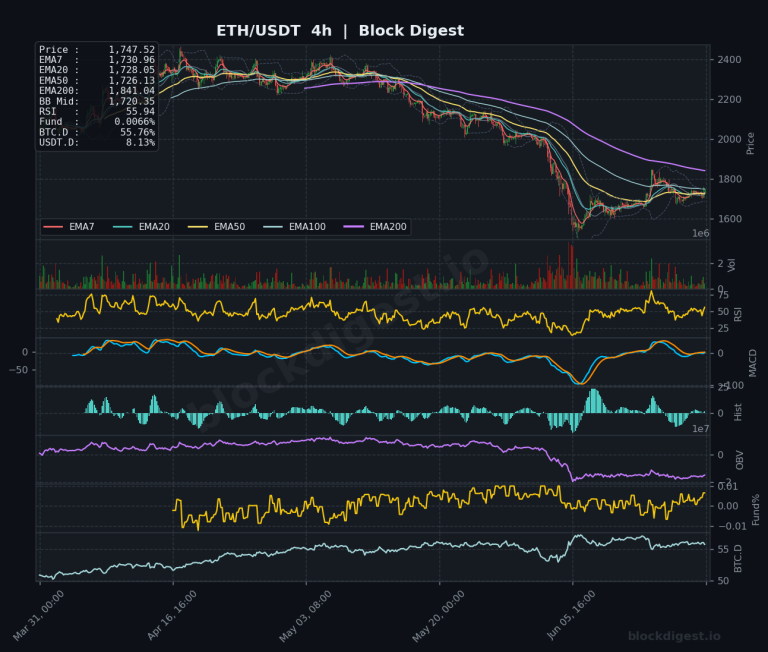
Ethereum Weekly Analysis: ETH Consolidates at $1,747 After Multi-Month Decline
Weekly Market Overview ETH/USDT enters the week of June 22, 2026 trading at approximately $1,747–$1,748, consolidating after a prolonged multi-month downtrend that saw price collapse from the $4,500 region into the mid-$1,500s. The current weekly candle structure suggests a tentative stabilization attempt, with price finding some footing above the recent capitulation lows near $1,540–$1,570. However,...
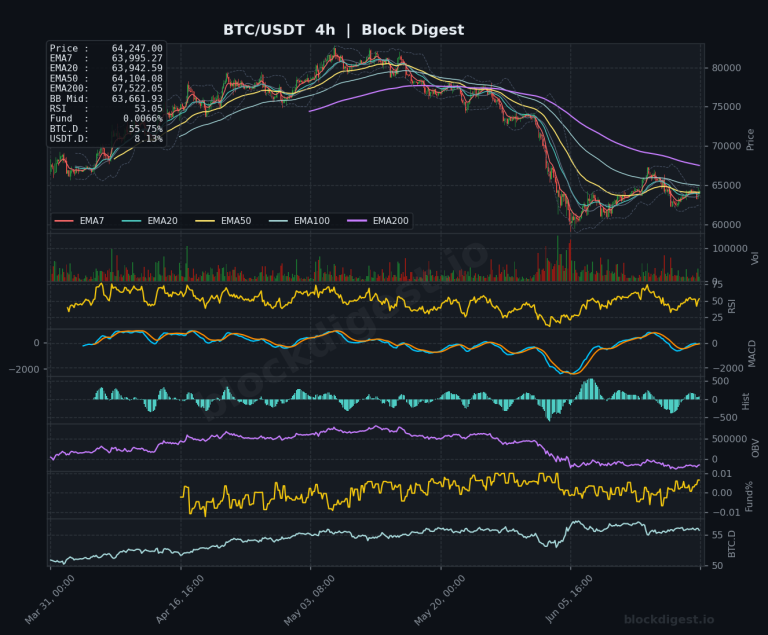
Bitcoin Weekly Analysis: Bitcoin corrects from $109K peak, struggles at $64K
Weekly Market Overview Bitcoin enters the week of June 22, 2026 trading around $64,226, caught in a prolonged corrective phase following what appears to have been a cycle peak near $109,000–$110,000 in late 2025. Price action this week has been characterized by continued compression below key moving averages, with BTC struggling to reclaim meaningful resistance...
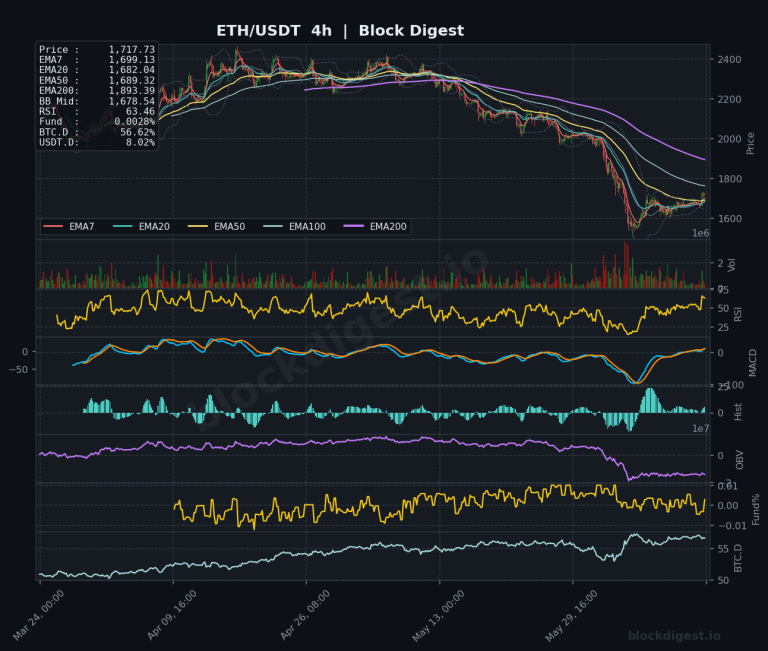
Ethereum Weekly Analysis: ETH trades below EMAs at $1,717 structural lows
Weekly Market Overview ETH/USDT continues to trade under significant macro pressure, with price currently sitting at $1,717 — well below all major EMAs on the weekly timeframe and near multi-year structural lows relative to the 2024–2025 bull cycle peak. This week’s price action reflects a modest intraweek recovery attempt from the $1,550–$1,600 range lows seen...
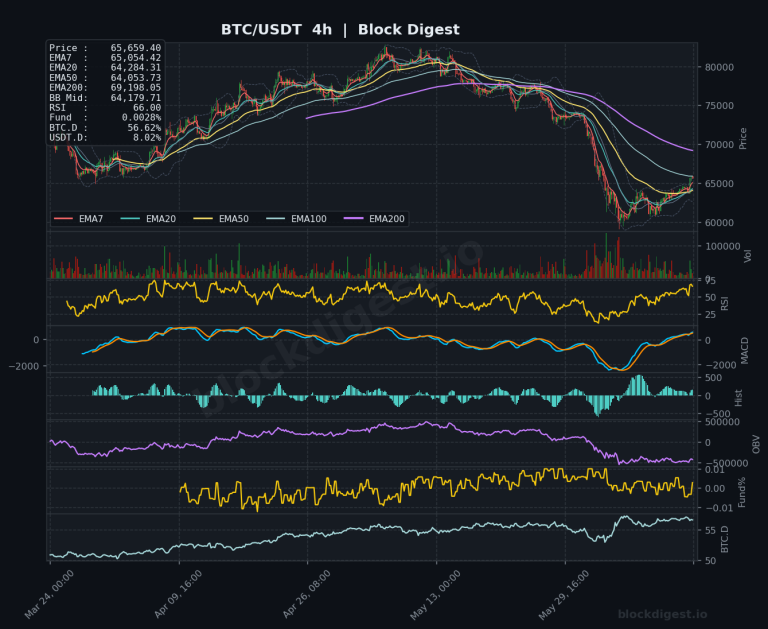
Bitcoin Weekly Analysis: Bitcoin Corrects from $109K Cycle Highs
Weekly Market Overview Bitcoin enters the week of June 15, 2026 trading around $65,645, having experienced a significant macro correction from its cycle highs near $109,000 recorded earlier in the bull run. Price action over the past several weeks has been characterized by a persistent downtrend, with BTC carving out a series of lower highs...
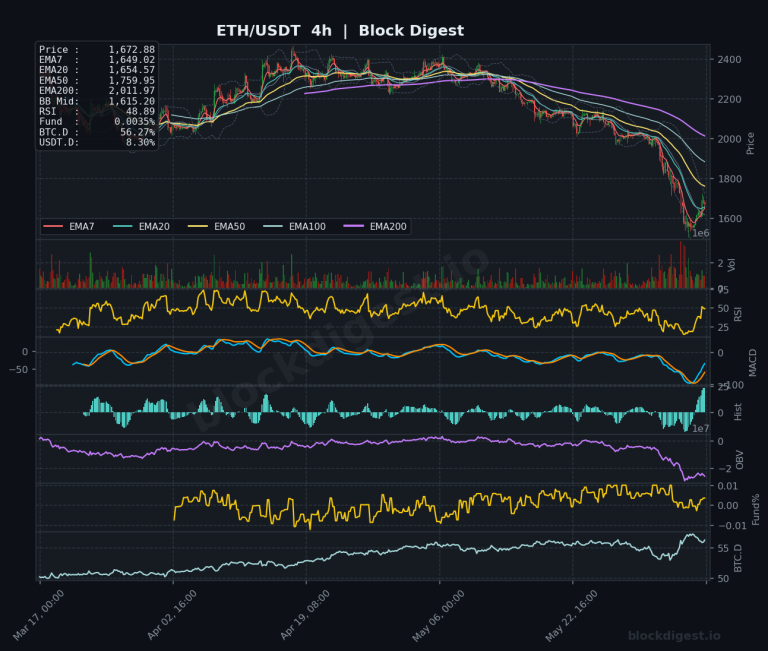
Ethereum Weekly Analysis: Ethereum Falls to Early 2023 Lows Amid Distribution
Weekly Market Overview Ethereum has endured a brutal multi-week sell-off, with ETH/USDT currently trading around $1,672 — levels not seen since early 2023. The weekly candle structure reflects sustained distribution, with price printing consecutive bearish closes well below all major exponential moving averages across every timeframe. This week’s price action was further pressured by macro...
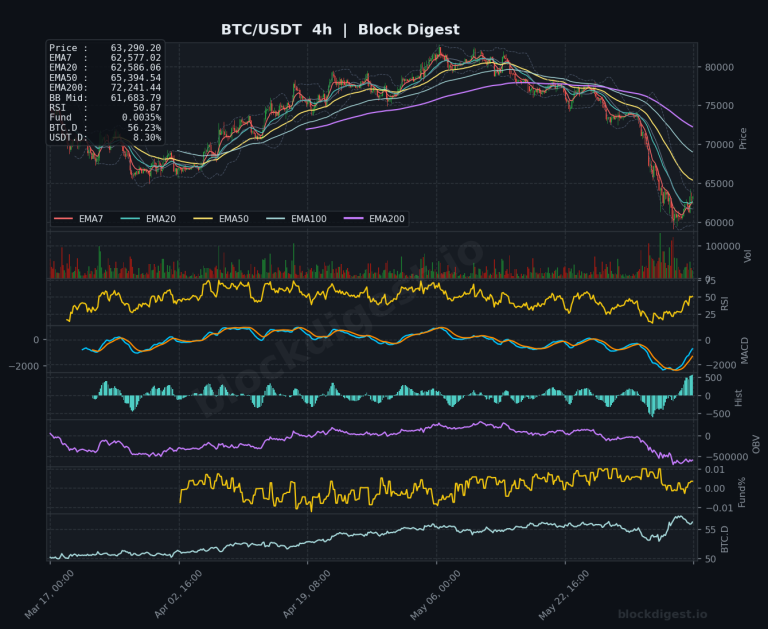
Bitcoin Weekly Analysis: Bearish Engulfing at $63K, 51% From Peak
Weekly Market Overview Bitcoin endured one of its most punishing weeks of 2026, shedding approximately 12.3% to trade around $63,063–$63,317 as of June 8. The weekly candle is shaping up as a decisive bearish engulfing structure, confirming the breakdown from the multi-month distribution range that had formed below the October 2025 all-time high near $126,200....
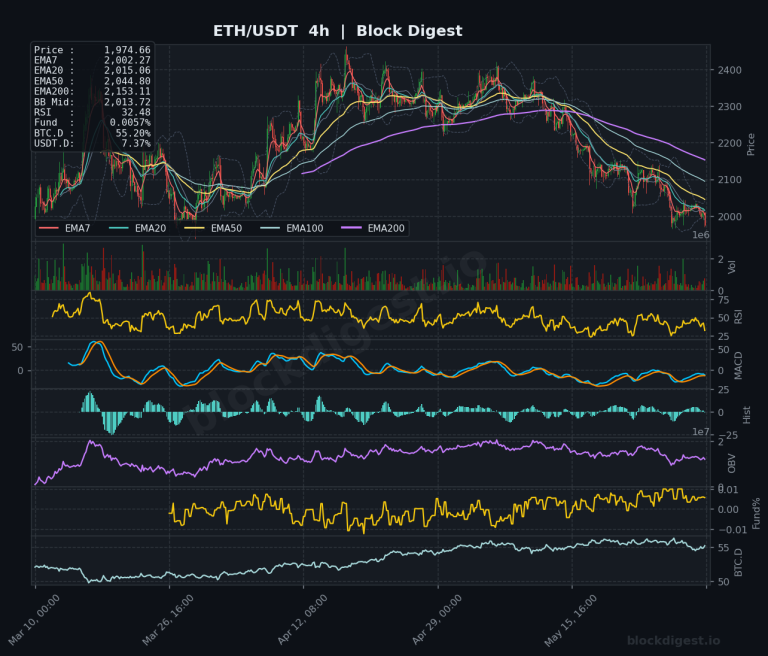
Ethereum Weekly Analysis: Ethereum Breaks Below $2,000 Resistance Level
Weekly Market Overview Ethereum closed the week trading just below the psychologically critical $2,000 level, with price printing at approximately $1,975 on the weekly chart — a level that has served as a pivotal macro reference point across multiple market cycles. The weekly candle reflects continued distribution pressure, extending a downtrend that began following the...
Bitcoin Weekly Analysis: Bitcoin Tests Critical Zone Below $75K
Weekly Market Overview Bitcoin enters the first week of June 2026 in a notably vulnerable technical position, with price trading at approximately $72,783 — well below the key psychological $75,000 level and sitting beneath all major short-term EMAs on the weekly chart. The weekly candle structure reflects continued distribution pressure following a prolonged decline from...
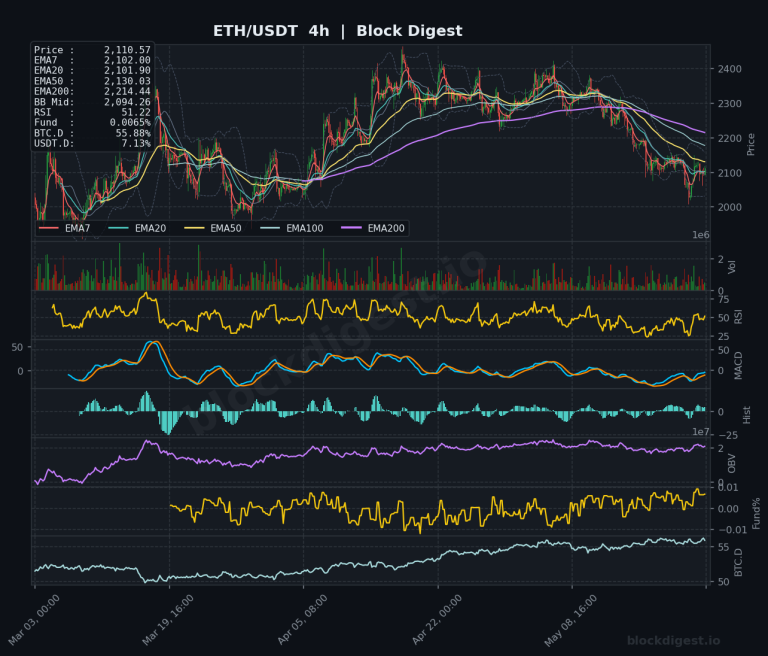
Ethereum Weekly Analysis: ETH Falls to $2,110 Amid 50% Decline From Highs
Weekly Market Overview ETH/USDT closed the week around $2,110, extending a prolonged downtrend that has seen price shed roughly 50% from its 2025 highs near $4,500. The current weekly candle is printing in deeply bearish territory, with price trading well below all major moving averages on both the weekly and daily timeframes. The recent macro...
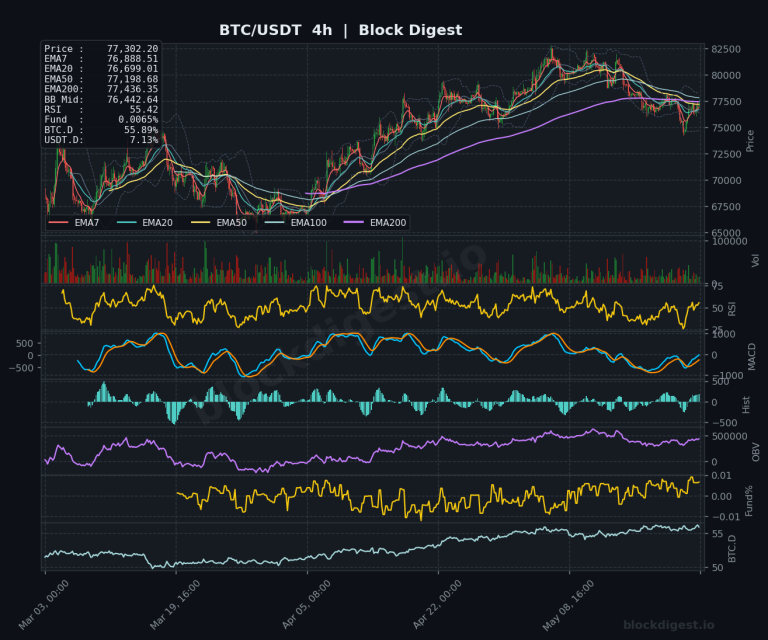
Bitcoin Weekly Analysis: Bitcoin Consolidates Below $126K All-Time High
Weekly Market Overview Bitcoin enters the final week of May 2026 trading at approximately $77,302, caught in a compressed consolidation range following its sharp rejection from the all-time high of $126,198 set in late 2025. The weekly candle structure reflects indecision, with price oscillating in a relatively tight band between $75,000 and $82,000 over recent...
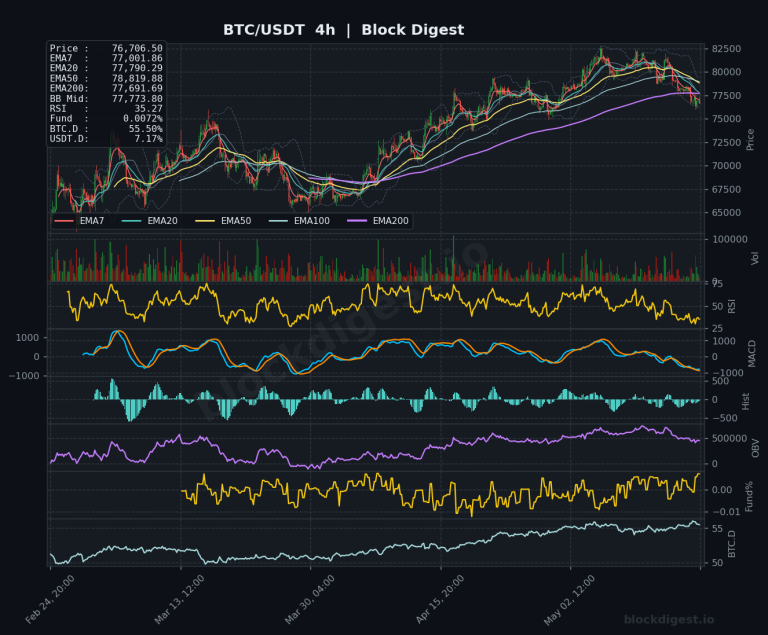
BTC Weekly Analysis — Week of May 19, 2026
Weekly Market Overview Bitcoin closed the week near $76,700, marking a decisive breakdown below the critical $78,000-$80,000 support zone that had held since late April. The weekly candle formed a bearish engulfing pattern with substantial volume, printing a nearly 7% decline that sliced through multiple EMA layers and confirmed a structural shift in momentum. Despite...