Weekly Market Overview
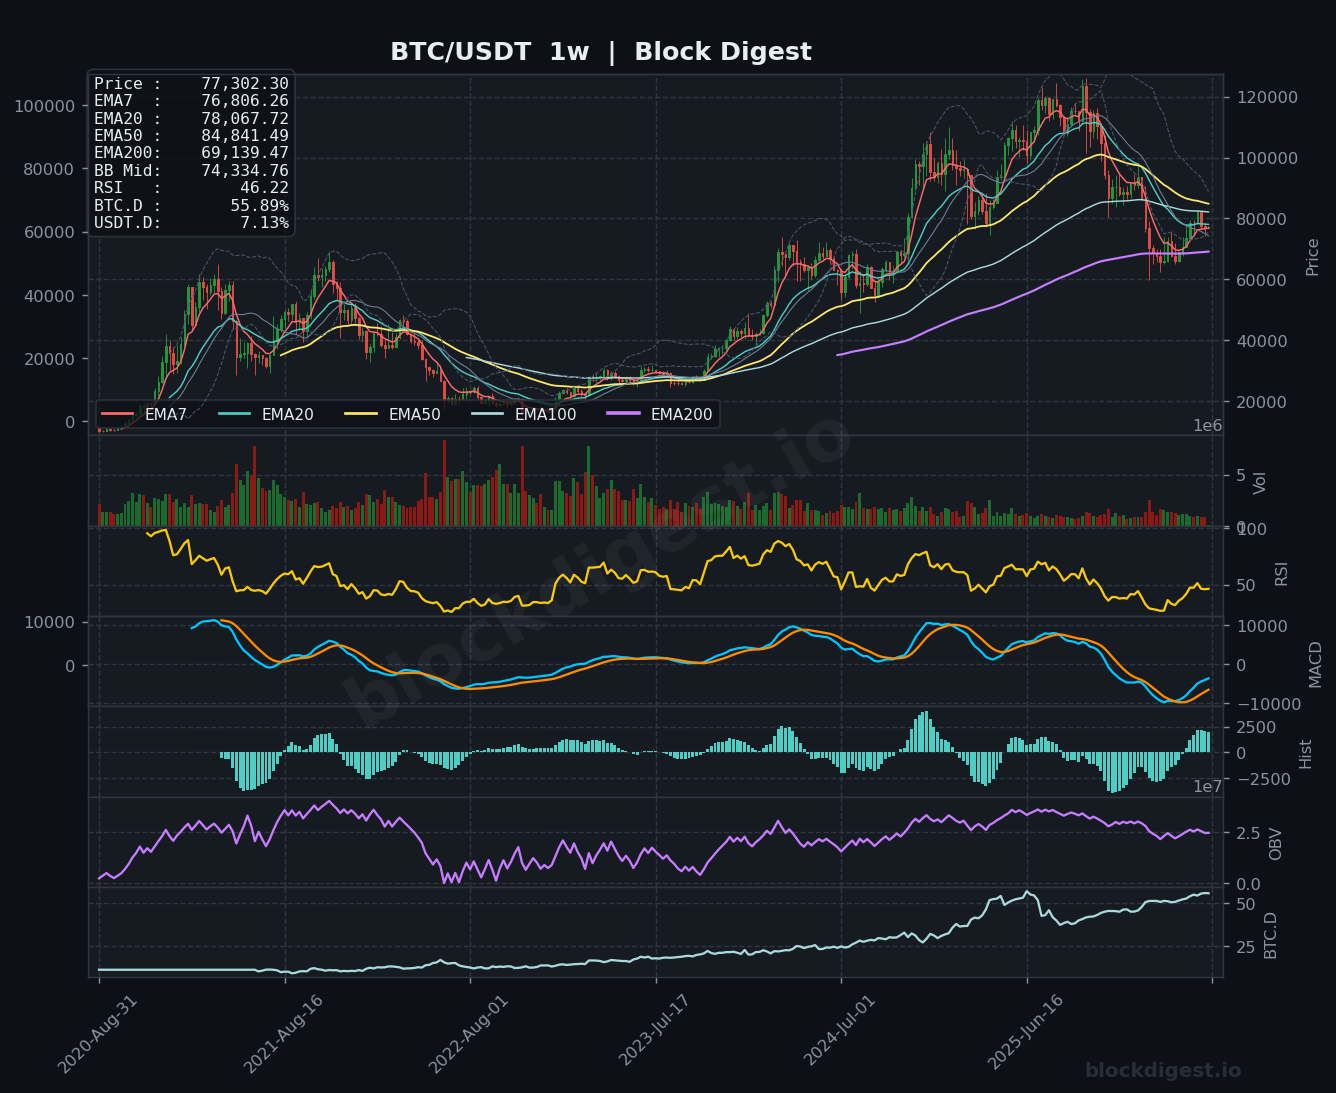
Bitcoin enters the final week of May 2026 trading at approximately $77,302, caught in a compressed consolidation range following its sharp rejection from the all-time high of $126,198 set in late 2025. The weekly candle structure reflects indecision, with price oscillating in a relatively tight band between $75,000 and $82,000 over recent weeks — a macro-level squeeze that demands resolution. The broader weekly trend remains technically corrective from ATH levels, yet the longer-term bull structure has not been invalidated, as price continues to hold above the rising weekly EMA200. Macro tailwinds from institutional accumulation and ETF inflows remain present, but persistent headwinds from elevated bond yields and Fed transition uncertainty are keeping bulls on the defensive.
Higher Timeframe Structure
On the weekly chart, Bitcoin is currently trading below the EMA20 ($78,068) and EMA50 ($84,841), both of which are sloping downward — a bearish EMA alignment at this timeframe. The EMA7 at $76,806 is providing marginal near-term support, while the weekly EMA200 at $69,139 remains the critical long-term floor, still sloping upward and confirming the macro bull cycle is structurally intact. The weekly Bollinger Band midline sits at $74,335, offering a key reference for mean-reversion scenarios. Price is effectively sandwiched between the BB midline as support and the declining EMA20 as overhead resistance — a no-man’s land that typically precedes a more decisive directional move.
Multi-Timeframe Confluence
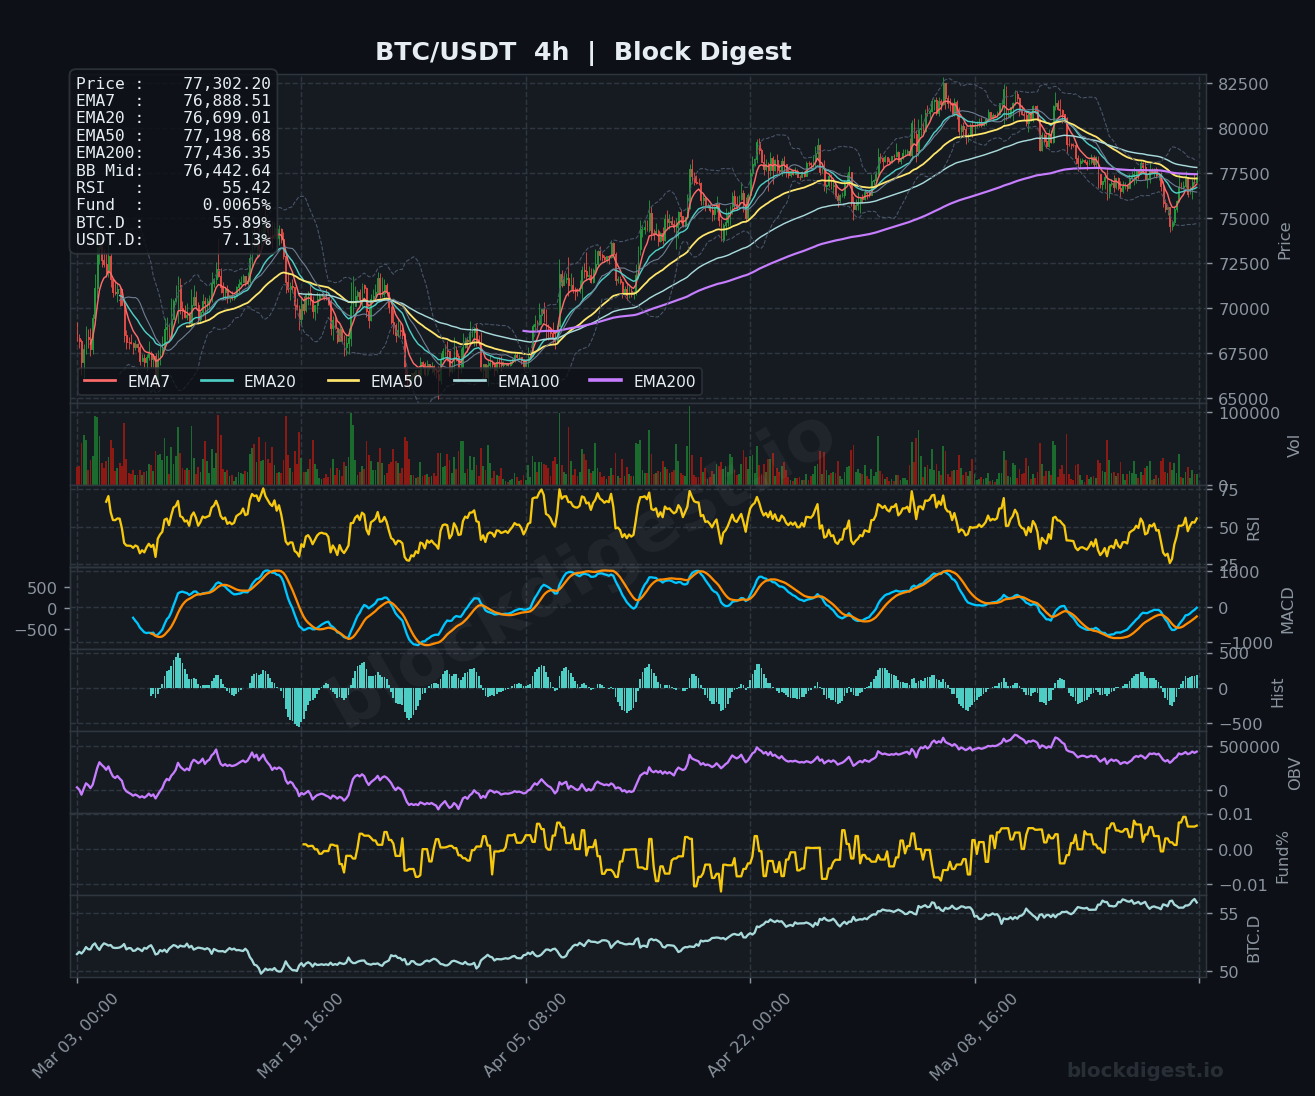
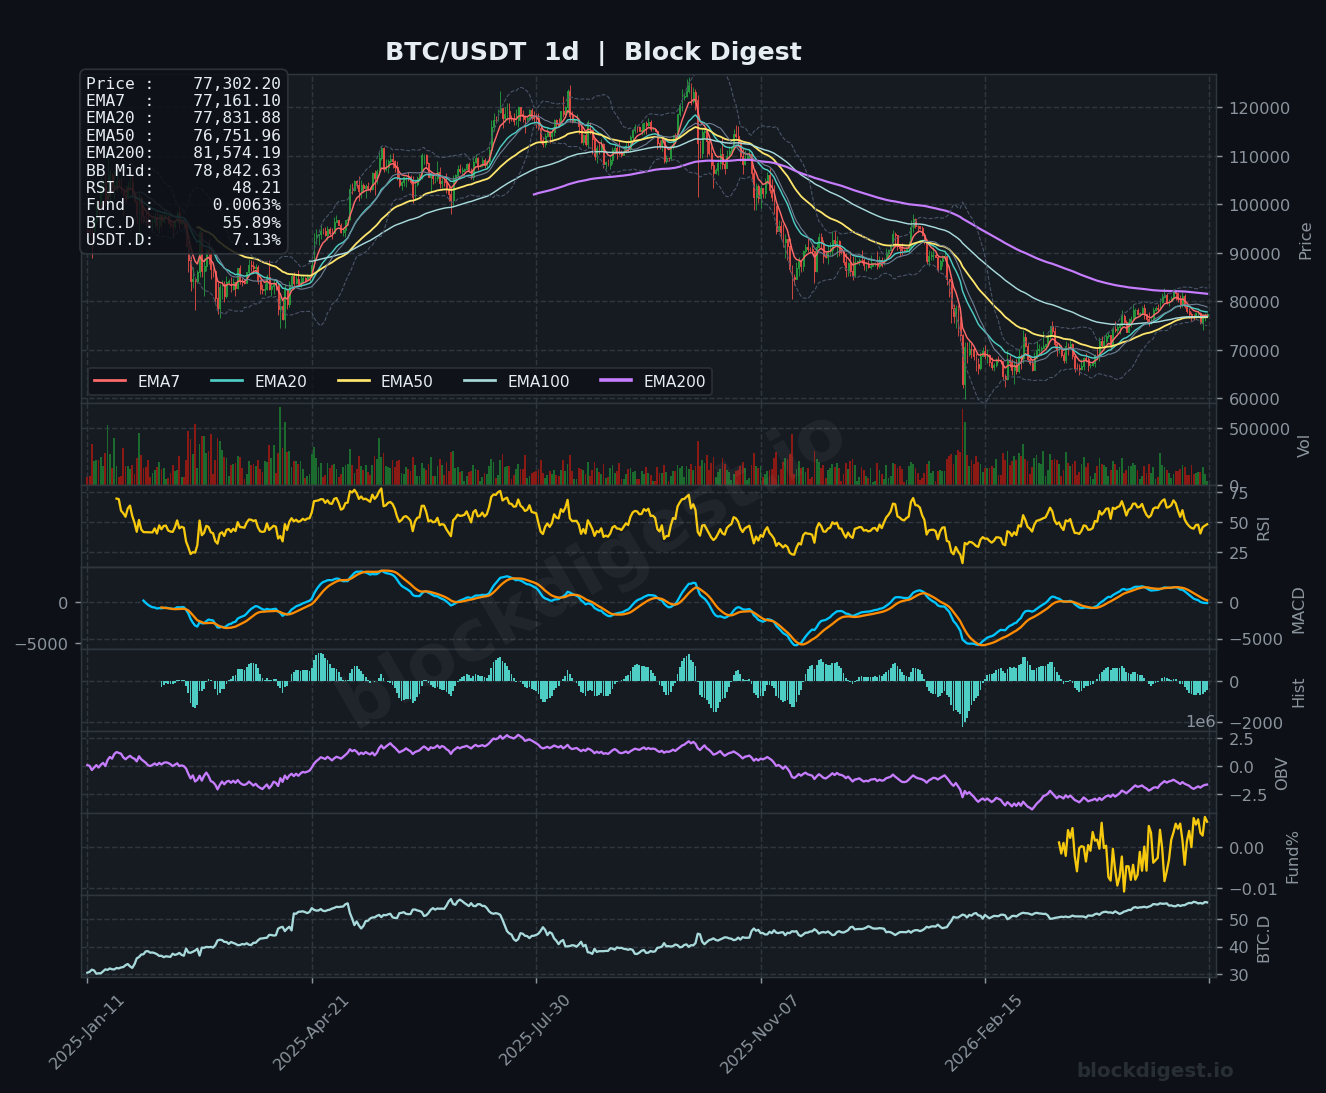
The daily chart reinforces the weekly bearish bias, with price trading below the EMA200 ($81,574) and the daily BB midline ($78,843), both of which now serve as overhead resistance. On the 4-hour chart, however, a subtle recovery attempt is visible — price has reclaimed the 4H EMA50 ($77,199) and EMA7 ($76,889), and the short-term moving averages are beginning to flatten and re-converge, hinting at a potential base-building phase. The confluent resistance cluster around $78,000–$78,800 (daily BB midline, daily EMA20, weekly EMA7) represents the most critical level to reclaim for bulls seeking a weekly trend reversal. Until that zone is convincingly cleared, the path of least resistance remains sideways-to-lower.
Key Weekly Levels
- Weekly Resistance:
- $78,000–$78,800 — Daily BB midline, daily EMA20, and weekly EMA7 convergence zone; the primary gatekeeping resistance
- $81,574 — Daily EMA200; a major reclamation target that would flip daily structure back to bullish
- $84,841 — Weekly EMA50; reclaiming this level would signal a significant structural recovery and bring $90K+ back into play
- Weekly Support:
- $76,000–$76,700 — 4H EMA200 ($77,436) and 4H EMA20/50 cluster; near-term short-term buyer zone
- $74,335 — Weekly BB midline; a technical mean-reversion support that previously acted as a launchpad
- $69,139 — Weekly EMA200; the ultimate macro support — a loss of this level would represent a serious structural deterioration
Momentum & Volume Analysis
On the weekly timeframe, RSI sits at 46.22 — below the neutral 50 level, indicating that momentum remains on the bearish side of the ledger without yet reaching oversold extremes. The weekly MACD is in negative territory with the histogram showing shallow negative bars that are gradually compressing, suggesting the bearish momentum is decelerating but no bullish crossover is imminent. Daily RSI at 48.21 mirrors this reading closely, while the 4H RSI has recovered to 55.42, showing a relative uptick in shorter-term buying pressure that could feed into a daily bounce. The weekly OBV remains in a mild downtrend from its ATH peak, reflecting net distribution during the retracement — though the 4H OBV has been rising steadily, signaling that intraweek accumulation is quietly occurring. Funding rates across timeframes are sitting at a modest positive +0.0063%–0.0065%, indicating that the market is very lightly long-leaning — not overheated, and leaving room for upside without triggering a significant long squeeze.
BTC Dominance & Altcoin Implications
BTC Dominance currently stands at 55.89% and has been trending upward on the weekly chart since mid-2023, reflecting Bitcoin’s continued capital concentration as the preferred risk asset in the current macro environment. USDT Dominance at 7.13% remains elevated, indicating a meaningful portion of crypto market capital is still sitting on the sidelines in stablecoins — a potential dry powder scenario if sentiment shifts. The combination of high BTC.D and elevated USDT.D suggests that altcoin season remains firmly off the table for now, with capital rotation into alts unlikely until Bitcoin establishes a convincing directional breakout and stablecoin holders gain confidence to redeploy risk.
Risk Scenarios
- Bull case: A sustained close above $78,800 on the daily chart would reclaim the BB midline and daily EMA20, opening a path toward the $81,500–$82,000 resistance zone where the daily EMA200 sits. Continued ETF inflows, favorable macro data, and a dovish Fed transition could catalyze a push toward $84,841 (weekly EMA50) and potentially retest the $90,000 psychological zone within the coming weeks.
- Bear case: Failure to hold the $76,000–$76,700 support cluster on the 4H chart — particularly a daily close below $75,000 — would re-expose Bitcoin to a retest of the weekly BB midline at $74,335. A breakdown below that level could trigger a deeper correction toward $69,000–$70,000 (weekly EMA200), which would represent a 10–11% drawdown from current levels and would structurally damage the medium-term recovery narrative.
Weekly Outlook
Bitcoin’s weekly setup as of May 25, 2026 is one of cautious neutrality with a slight bearish lean, as price trades below key daily and weekly moving averages while momentum indicators sit just under the neutral line. The key battle for the week ahead centers on the $78,000–$78,800 resistance zone — a reclamation of this area on strong volume would be the first meaningful signal that the corrective phase is ending. Catalysts to watch include any clarity on the Federal Reserve’s leadership transition, U.S. macro data (particularly inflation prints and bond yield movements), and ongoing ETF flow data which has been supportive. The positive funding rate environment and rising 4H OBV suggest quiet accumulation is underway, which is encouraging, but conviction buying will need to show up on the daily and weekly timeframes before a directional bias can be confirmed. Traders should respect the range, manage risk tightly around the $75,000 support floor, and wait for a high-conviction breakout or breakdown before committing to a directional position.
Disclaimer: This analysis is for informational purposes only and does not constitute financial advice. Cryptocurrency markets are highly volatile and unpredictable. All trading decisions should be made based on your own research and risk tolerance. Block Digest is not responsible for any financial losses incurred as a result of acting on this content.
Stay Ahead of the Market
Follow BlockDigest for crypto market intelligence, research and real-time updates.