Weekly Market Overview
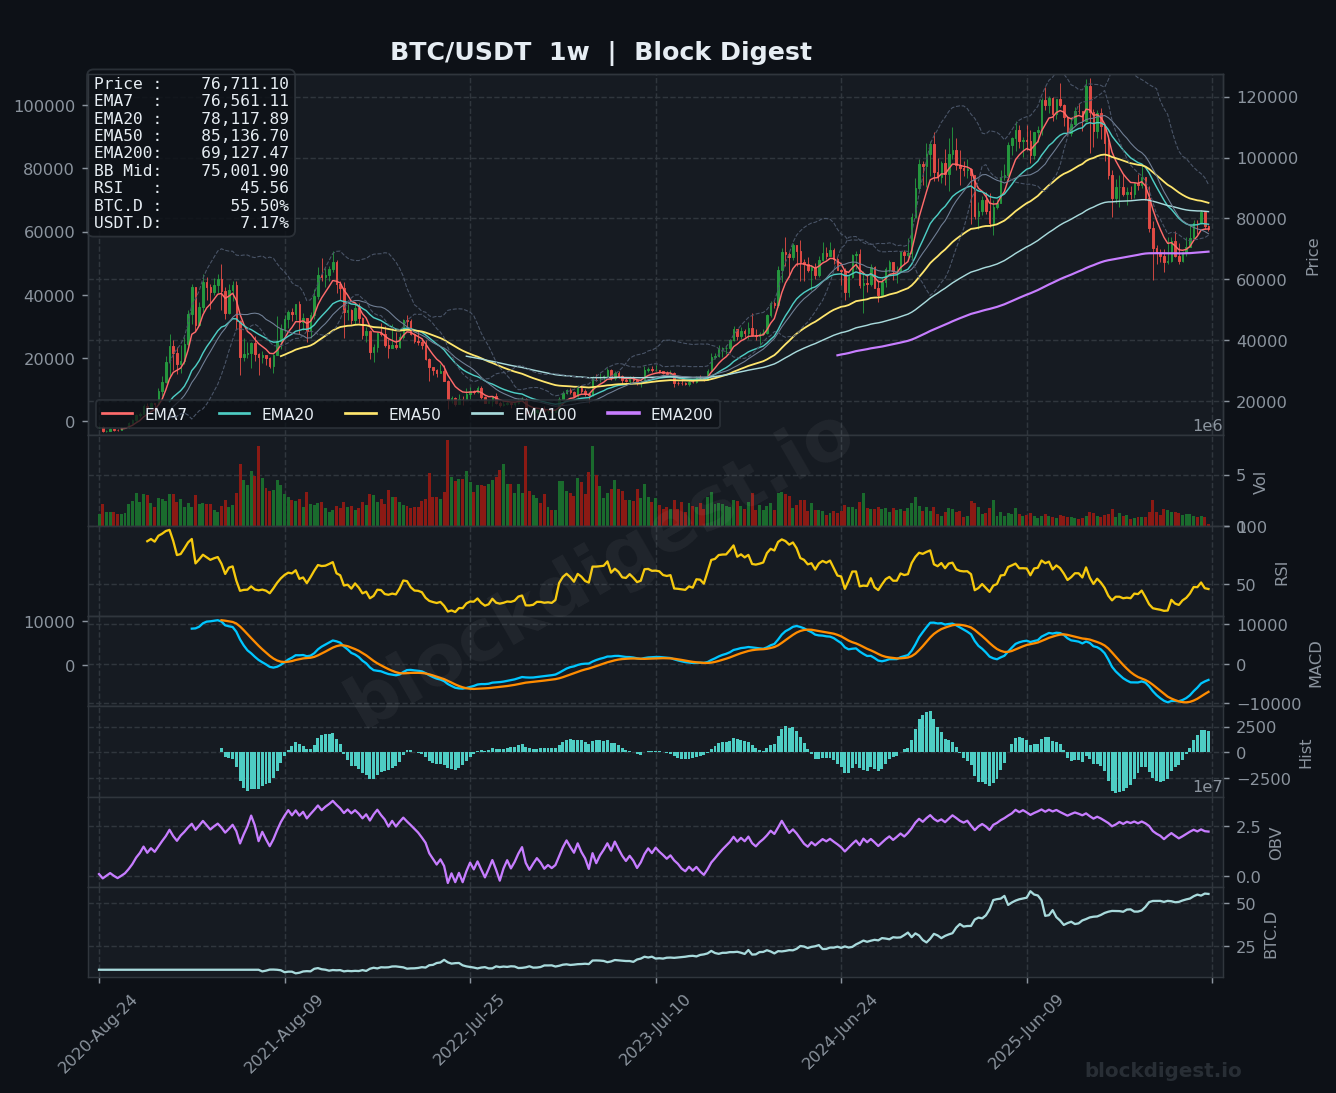
Bitcoin closed the week near $76,700, marking a decisive breakdown below the critical $78,000-$80,000 support zone that had held since late April. The weekly candle formed a bearish engulfing pattern with substantial volume, printing a nearly 7% decline that sliced through multiple EMA layers and confirmed a structural shift in momentum. Despite Strategy’s $2 billion bitcoin purchase adding 24,869 BTC to their holdings earlier in the week, price action has remained decisively bearish, rejecting the brief spike above $82,000 and establishing a lower high pattern. The current weekly close positions Bitcoin below its 7, 20, and 50-week EMAs for the first time since the March consolidation period, signaling a potentially significant trend deterioration at the macro level.
Higher Timeframe Structure
The weekly chart reveals a concerning breakdown in structural integrity, with price now trading at $76,711—below the EMA7 ($76,561), EMA20 ($78,117), and approaching a test of the EMA50 ($85,136). This represents the first time since early 2025 that Bitcoin has traded beneath this critical moving average cluster, marking a potential end to the multi-month uptrend that carried BTC from the $60,000 range to above $120,000. The EMA200 at $69,127 now emerges as the ultimate macro support level, while the weekly Bollinger Band midpoint at $75,001 sits dangerously close to current price. The broader weekly structure shows Bitcoin has retraced approximately 38% from its recent highs, approaching the 50% Fibonacci retracement zone that historically acts as a major decision point for continuation or reversal of the larger trend.
Multi-Timeframe Confluence
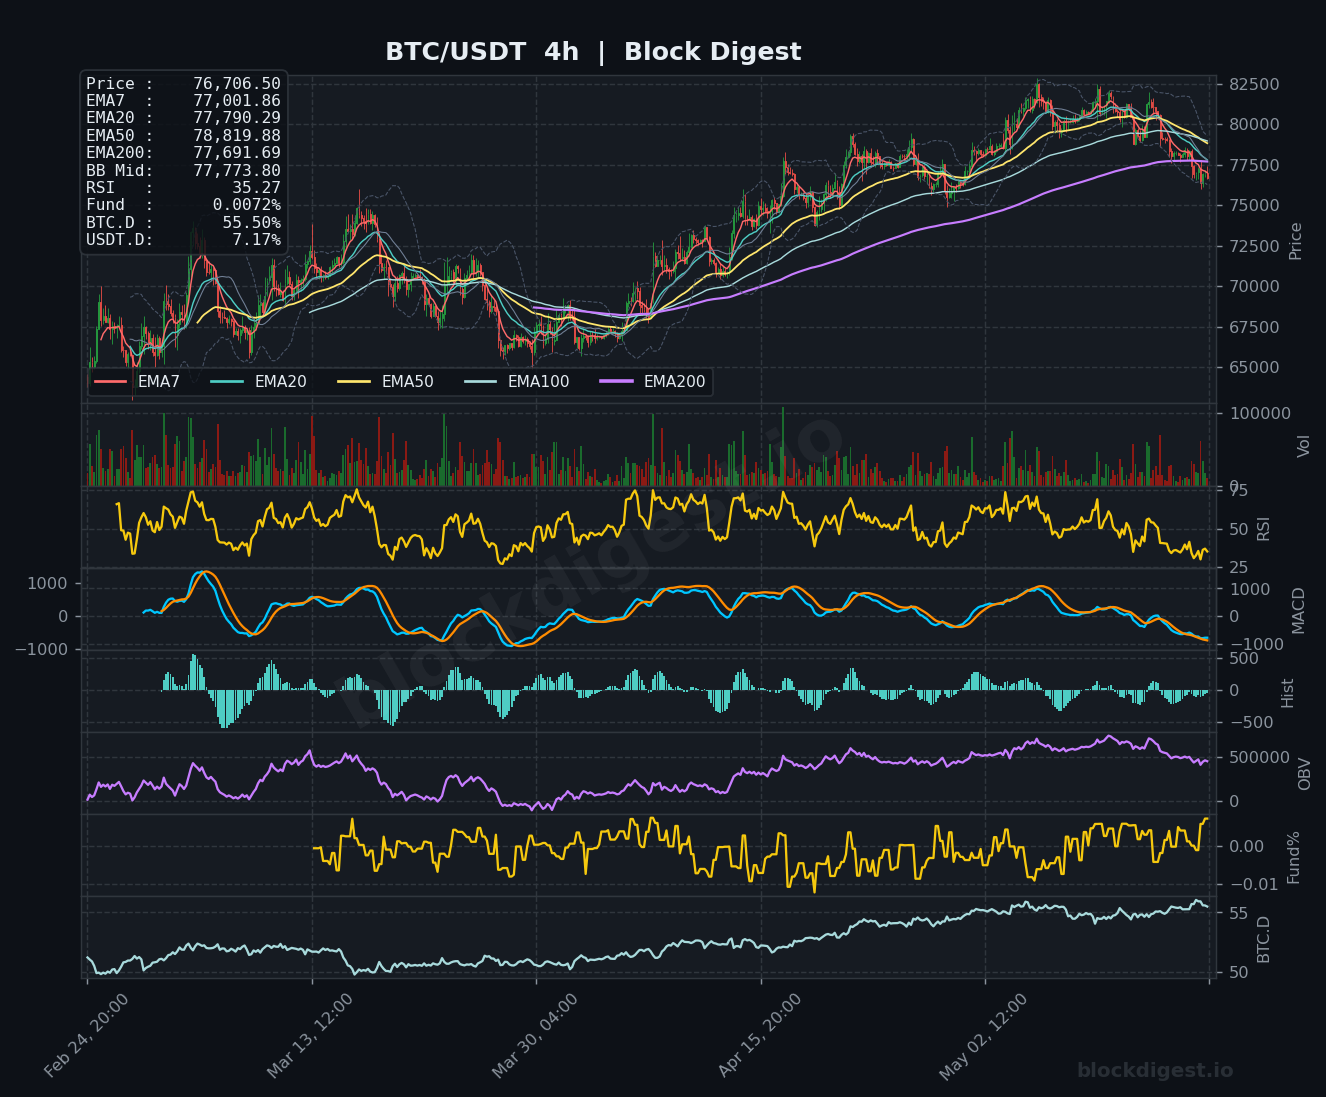
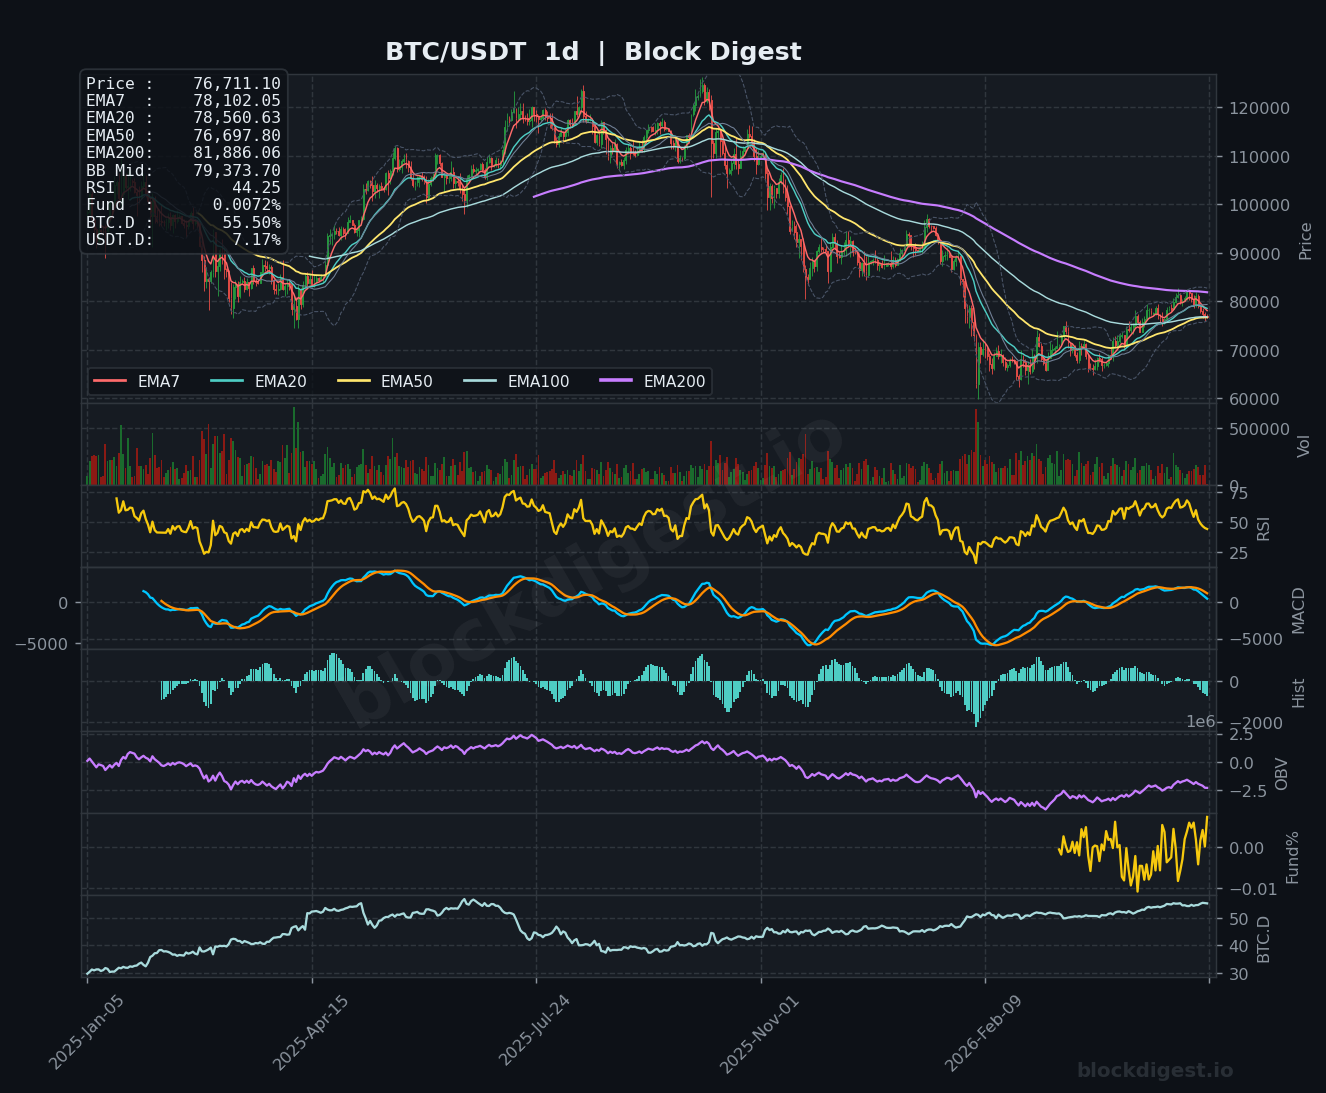
Multi-timeframe analysis reveals bearish alignment across all observed periods, with the weekly, daily, and 4-hour charts displaying synchronized downward momentum. The daily timeframe shows price trading below all major EMAs except the EMA200 ($81,886), which represents the last line of defense before a more severe breakdown, while the 4-hour chart exhibits a clear lower-high, lower-low pattern with price compression below the EMA50 ($78,819). Critical confluence exists at the $75,000-$76,000 zone, where the weekly Bollinger Band midpoint, psychological support, and prior consolidation areas converge to create a high-probability inflection point. The alignment of deteriorating momentum across timeframes—with RSI declining on weekly (45.56), daily (44.25), and 4-hour (35.27) charts—suggests the path of least resistance remains downward absent a decisive reclaim of the $78,000-$80,000 zone.
Key Weekly Levels
Weekly Resistance:
- $80,000-$82,000: The EMA20 weekly ($78,117) convergence zone and former support turned resistance; reclaiming this level would be required to invalidate the bearish weekly structure and signal potential trend resumption
- $85,000-$86,000: The EMA50 weekly ($85,136) represents major resistance and the reclaim threshold for bulls to regain structural control, aligning with the late April consolidation highs
- $90,000-$92,000: The February-March resistance zone and psychological level that would mark a full recovery of the recent breakdown and reestablish the longer-term bullish trajectory
Weekly Support:
- $75,000-$76,000: Immediate support cluster comprising the weekly Bollinger Band midpoint ($75,001), current price action, and psychological round number; breakdown here opens the door to deeper retracement
- $69,000-$70,000: The EMA200 weekly ($69,127) and critical macro support representing the ultimate defense for the bull market structure; historically this level has marked major cycle bottoms
- $64,000-$66,000: The late 2024 consolidation zone and 61.8% Fibonacci retracement level from the recent rally, representing a worst-case scenario weekly target if macro support fails
Momentum & Volume Analysis
Weekly momentum indicators have deteriorated significantly, with RSI dropping to 45.56—below the neutral 50 level for the first time since early 2025 and approaching bearish territory. The MACD histogram on the weekly chart has flipped negative with accelerating bearish momentum, while the signal line crosses suggest the beginning of a potential multi-week downtrend phase. On-Balance Volume (OBV) shows distribution divergence across timeframes, with the weekly OBV declining sharply despite previous accumulation periods, indicating smart money has been exiting positions during recent weakness. The daily RSI at 44.25 and 4-hour RSI at 35.27 both signal oversold conditions in the short term, though weekly momentum remains merely neutral rather than oversold, suggesting further downside potential exists before a meaningful bottoming process begins. Funding rates at 0.0072% remain relatively neutral to slightly positive, indicating leveraged longs haven’t fully capitulated yet—a concerning signal that suggests additional forced liquidations could accelerate downside momentum if the $75,000 level breaks.
BTC Dominance & Altcoin Implications
Bitcoin dominance currently sits at 55.50%, showing relative strength compared to the broader altcoin market despite BTC’s recent weakness—a typical pattern during risk-off market phases where capital flows back to the relative safety of Bitcoin. USDT dominance at 7.17% has been gradually declining, suggesting that while Bitcoin is correcting, capital isn’t necessarily fleeing to stablecoins en masse, which could indicate investors are either moving to traditional markets or waiting in fiat positions. The current BTC.D structure suggests altcoins face substantial additional pressure in the near term, as they typically underperform Bitcoin during corrective phases and only begin to outperform once BTC establishes a clear bottom and stabilizes.
Risk Scenarios
Bull case: A successful defense of the $75,000-$76,000 support zone with a decisive weekly close above $78,000 would invalidate the breakdown and signal renewed institutional accumulation, potentially targeting a retest of $82,000-$85,000 as the initial recovery objective. Reclaiming the EMA20 weekly would restore short-term bullish structure, with momentum confirmation from RSI returning above 50 and MACD histogram flipping positive. In this scenario, the $2 billion Strategy purchase could be validated as a generational bottom buy, with targets extending toward $90,000-$95,000 over the subsequent 4-6 weeks as weekly moving averages realign bullishly.
Bear case: A weekly close below $75,000 would trigger accelerated breakdown momentum, likely targeting the EMA200 weekly at $69,000-$70,000 as the next major support test with potential for waterfall liquidations. In this scenario, leveraged long liquidations would cascade as the psychological $70,000 level approaches, with funding rates flipping deeply negative and RSI reaching oversold extremes below 30 on the weekly timeframe. Further deterioration could see BTC test the $64,000-$66,000 zone representing the 2024 consolidation range, marking a complete retracement of the recent rally phase and potentially signaling a multi-month corrective period.
Weekly Outlook
The week ahead carries substantial downside risk as Bitcoin attempts to defend the critical $75,000-$76,000 support zone with weakening momentum across all timeframes and deteriorating technical structure. The weekly close below the EMA20 represents a significant structural break that has only occurred a handful of times during this cycle, typically preceding multi-week corrective phases averaging 15-25% total drawdowns. Key catalysts to monitor include U.S. economic data releases that could impact broader risk assets (given BTC’s 84% correlation with S&P 500), potential further institutional announcements, and the critical daily and weekly closes throughout the coming week. The balance of probabilities favors additional downside testing of the $72,000-$75,000 range before any meaningful reversal attempt, with bulls needing to reclaim $78,000 on strong volume to invalidate the bearish thesis. Risk/reward currently favors defensive positioning or waiting for confirmed bottoming signals at macro support levels, as the path of least resistance remains down until weekly momentum indicators stabilize and show evidence of exhaustion at key support zones.
Disclaimer: This analysis is for informational purposes only and does not constitute financial advice. Cryptocurrency markets are highly volatile and unpredictable. All trading decisions should be made based on your own research and risk tolerance. Block Digest is not responsible for any financial losses incurred as a result of acting on this content.
Stay Ahead of the Market
Follow BlockDigest for crypto market intelligence, research and real-time updates.