Bitcoin Weekly Analysis: Bitcoin Corrects from $109K Cycle Highs
Weekly Market Overview
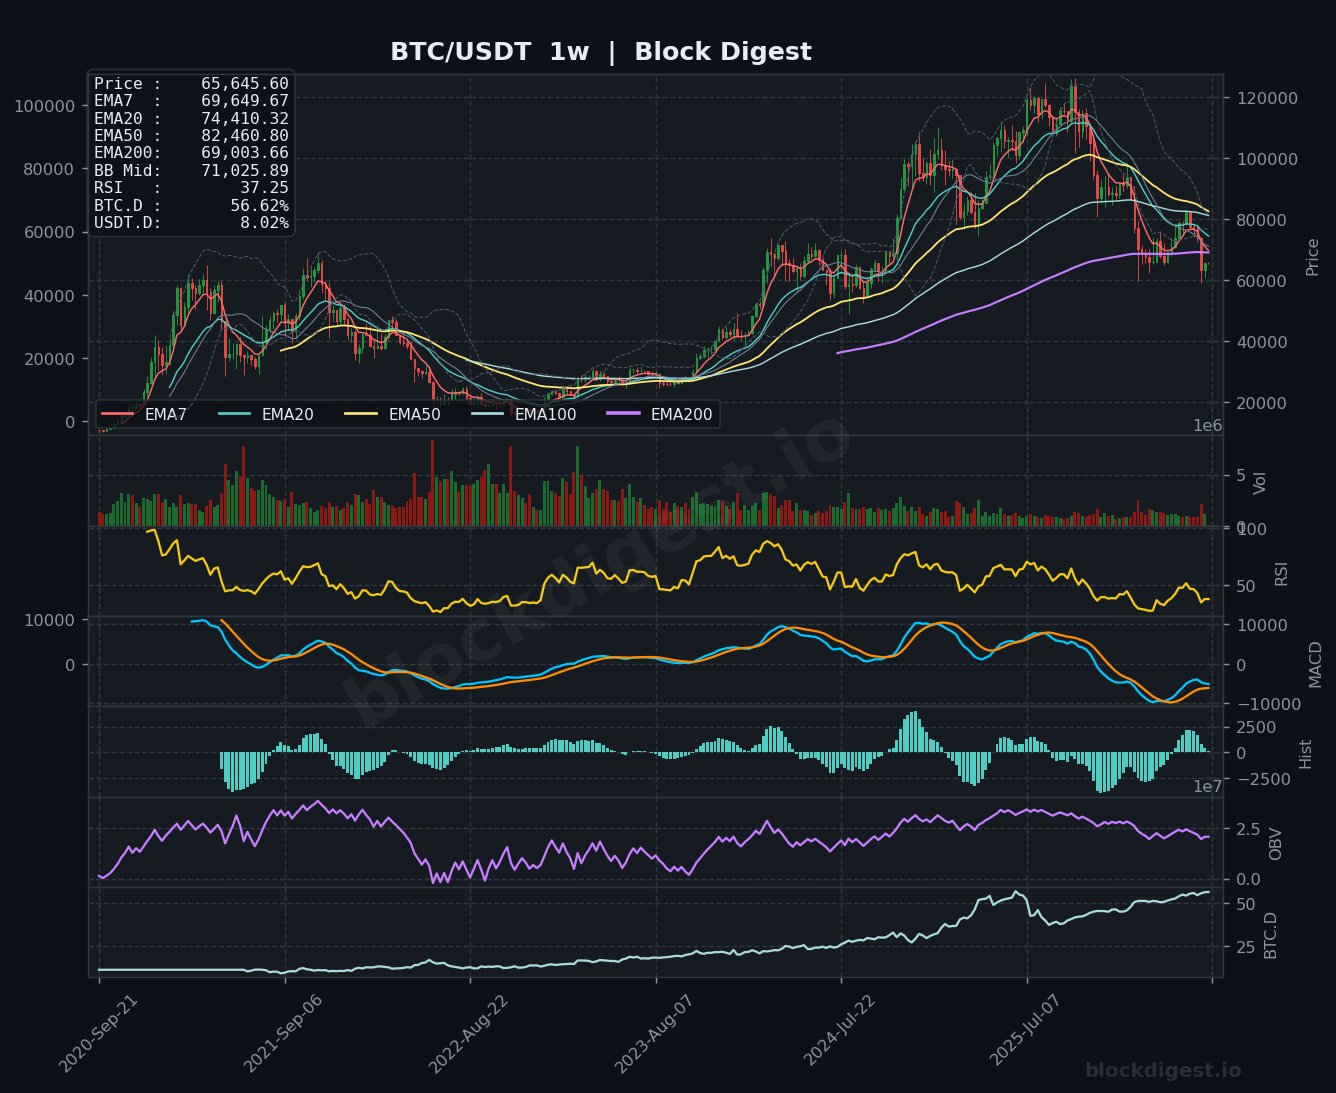
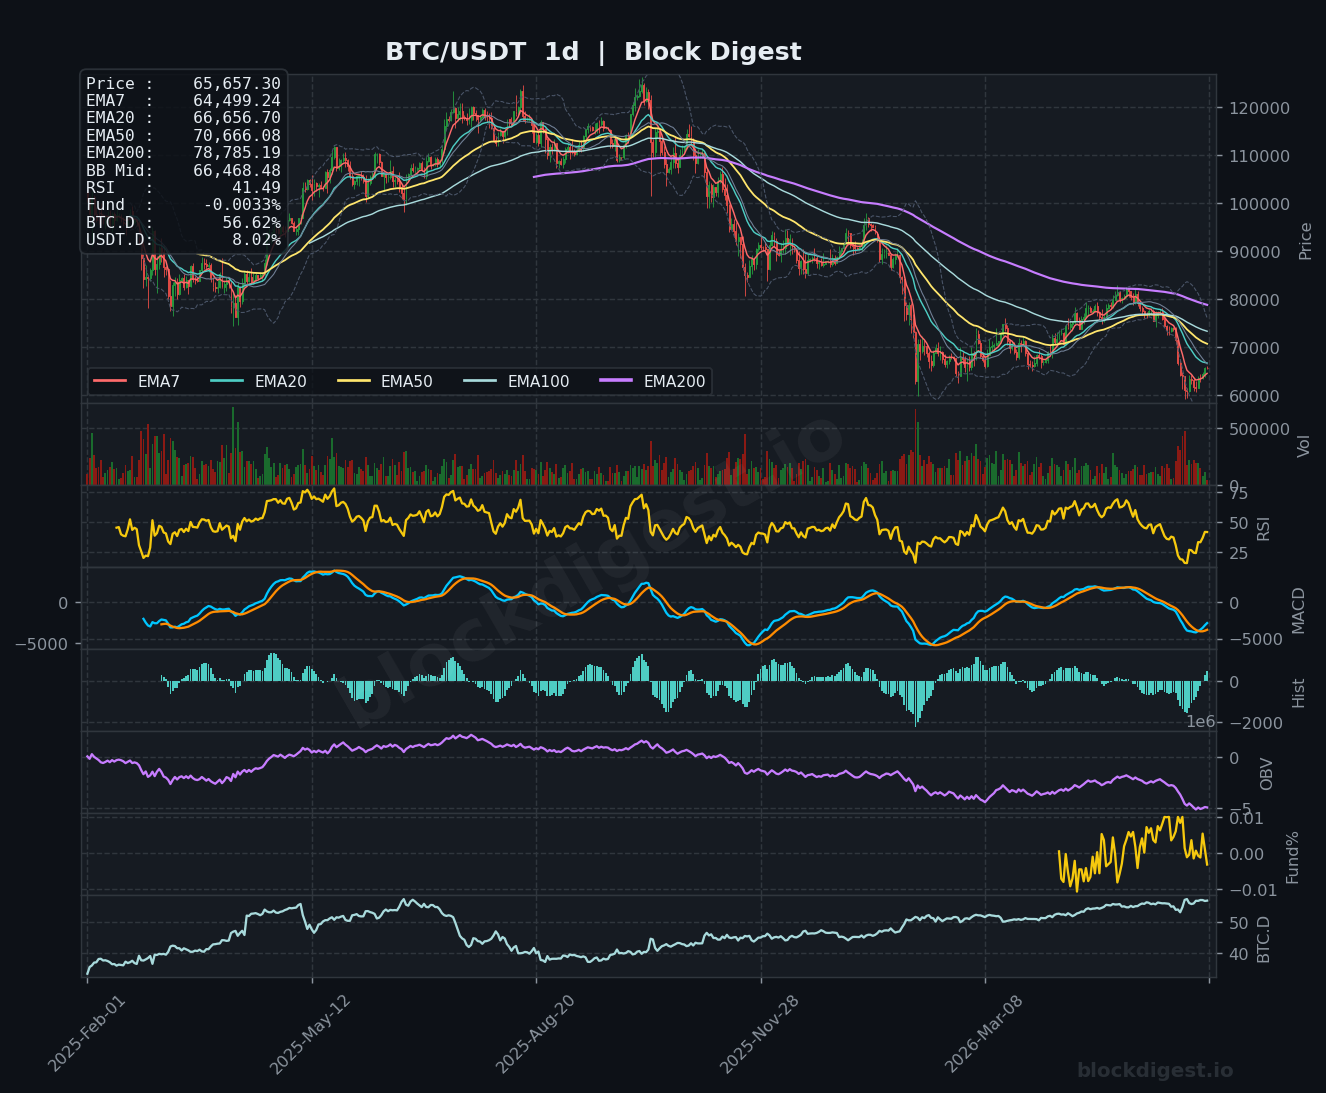
Bitcoin enters the week of June 15, 2026 trading around $65,645, having experienced a significant macro correction from its cycle highs near $109,000 recorded earlier in the bull run. Price action over the past several weeks has been characterized by a persistent downtrend, with BTC carving out a series of lower highs and lower lows across all major timeframes. The current weekly candle is attempting to stabilize in the $63,000–$66,000 range following a sharp multi-month sell-off, suggesting early signs of exhaustion from sellers, though no confirmed structural reversal has materialized. The broader weekly context places BTC at a critical juncture — holding above the weekly 200 EMA but trading well beneath the 7, 20, and 50 EMAs, which are all sloping downward in bearish alignment.
Higher Timeframe Structure
On the weekly chart, the EMA stack tells a clearly bearish story: EMA7 sits at $69,649, EMA20 at $74,410, EMA50 at $82,460, and EMA200 at $69,003, with price at $65,645 trading below all of them simultaneously — a deeply unfavorable configuration not seen since the 2022 bear market. The weekly Bollinger Band midline resides at $71,025, acting as a dynamic resistance ceiling that price must reclaim to shift the intermediate-term bias back toward neutral. The fact that BTC is currently pressing against — and has recently breached — the weekly EMA200 ($69,003) is a historically significant development, as this level has previously served as a macro bull-bear delineation line. The weekly RSI reading of 37.25 is approaching oversold territory, mirroring conditions seen at major cycle lows, which is noteworthy but not yet a confirmed buy signal in isolation.
Multi-Timeframe Confluence
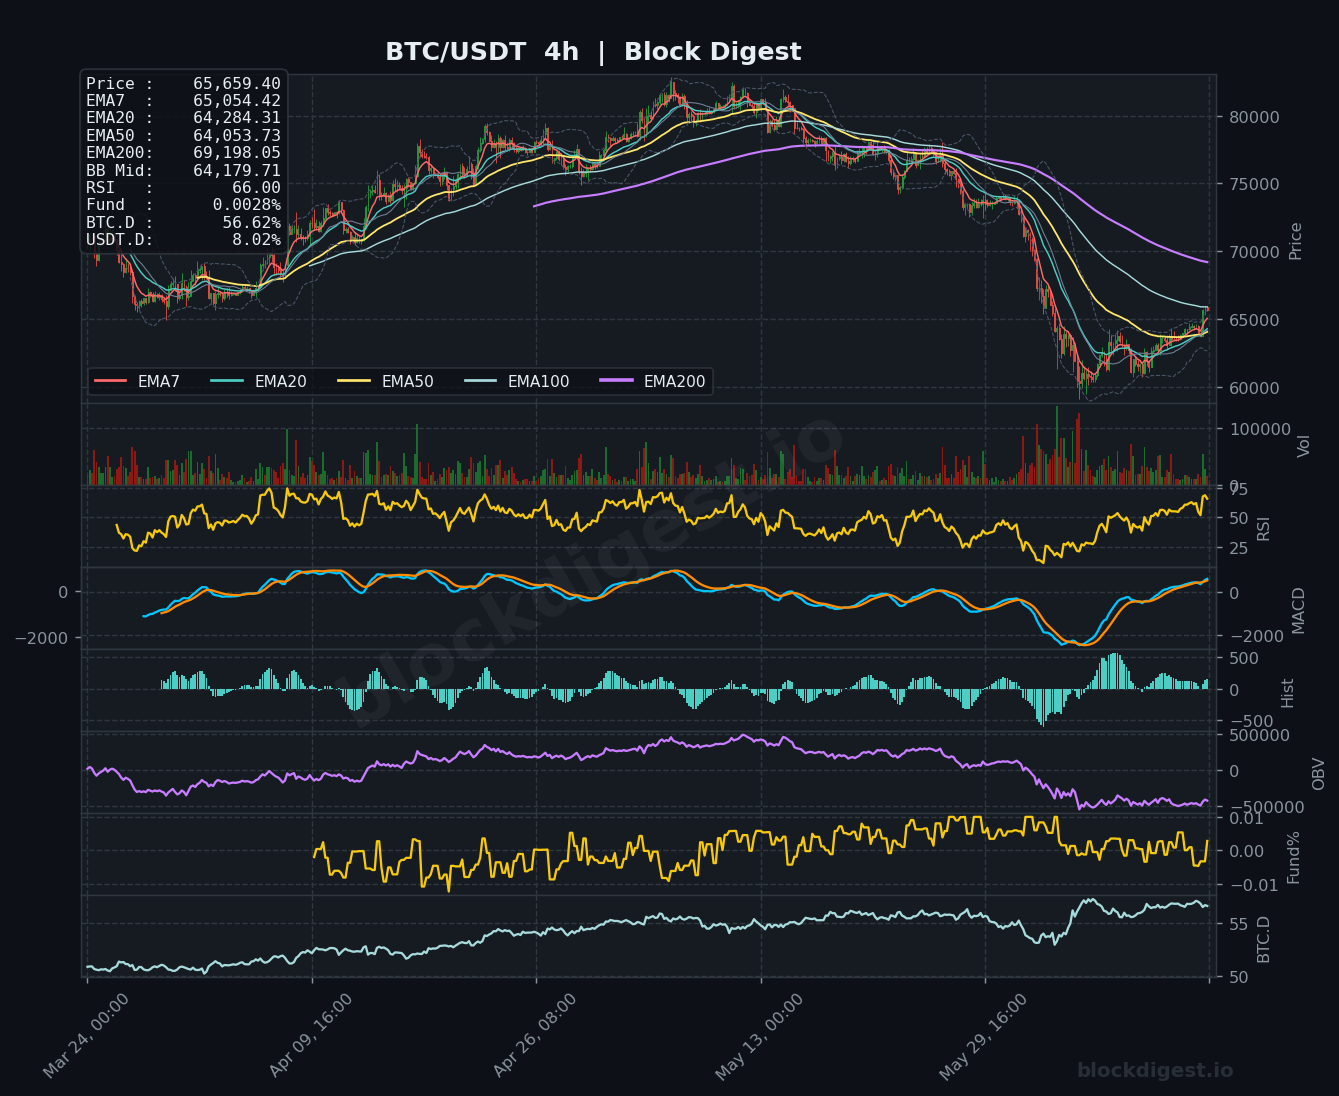
Across all three timeframes, the bearish structure remains intact, though short-term momentum hints at a nascent stabilization effort. On the 4-hour chart, price has reclaimed its EMA7 ($65,054) and EMA20 ($64,284), with the 4h RSI recovering to 66 — suggesting a short-term relief bounce is underway after the capitulation low near $60,000. The daily chart shows price at $65,657 still trapped beneath the EMA7 ($64,499) and EMA20 ($66,656), meaning the daily EMA20 near $66,650 represents the first meaningful resistance cluster above current price. Confluence of resistance exists between $66,500 and $69,000, where the daily EMA20, weekly EMA200, and weekly EMA7 all converge — a zone bulls must convincingly conquer to begin reversing the higher timeframe damage.
Key Weekly Levels
- Weekly Resistance: $66,500–$66,650 (daily EMA20 and BB midline area); $69,000–$69,650 (weekly EMA200 and weekly EMA7 confluence — critical macro resistance); $74,400 (weekly EMA20, broader medium-term resistance)
- Weekly Support: $63,000–$63,500 (recent consolidation base and short-term demand zone visible on 4h); $60,000 (psychological round number and recent capitulation low); $56,000–$58,000 (structural support from prior cycle consolidation range)
Momentum & Volume Analysis
The weekly MACD remains in deeply negative territory with the signal line and MACD line both below zero, and the histogram showing slight improvement but still bearish — consistent with a market in a corrective phase rather than a confirmed reversal. The weekly OBV has been trending lower since the cycle top, confirming that distribution has been dominant and that sustained buying pressure has not yet returned at the macro level. On the daily timeframe, the RSI at 41.49 remains below the neutral 50 level, reinforcing the bearish bias, though it is recovering from more extreme oversold readings. The 4h funding rate of +0.0028% is marginally positive, suggesting a modest long bias in perpetual futures markets — not overheated, but indicating that the current bounce is attracting light speculative interest rather than conviction-driven institutional demand, which keeps the risk of a fakeout elevated.
BTC Dominance & Altcoin Implications
BTC dominance stands at 56.62% and has been in a sustained uptrend since early 2025 as visible on both the 4h and weekly BTC.D panels, reflecting a continued flight-to-quality dynamic where capital rotates into Bitcoin relative to altcoins during periods of broader market stress. USDT.D at 8.02% remains elevated, signaling that a meaningful portion of market participants have de-risked into stablecoins and have yet to redeploy, which could serve as dry powder for a recovery rally but also confirms the prevailing risk-off sentiment. Until BTC.D shows a meaningful reversal lower from the 56–57% range, altcoins are likely to continue underperforming, and any broad altseason rotation remains premature in the current macro setup.
Risk Scenarios
- Bull case: A successful weekly close above the $69,000–$69,650 confluence zone (weekly EMA200 + weekly EMA7) would represent the first meaningful structural reclaim and could trigger a momentum chase toward $74,400 and ultimately $78,000–$80,000. The conditions would require sustained volume confirmation, a daily RSI cross above 50, and a flattening or bullish cross on the daily MACD. A weakening USDT.D alongside a BTC.D pullback would further confirm risk appetite returning to the market.
- Bear case: Failure to hold the $63,000–$63,500 support zone on any retest of the recent lows would put the psychological $60,000 level back in play. A weekly close below $60,000 would be structurally catastrophic, opening the door to the $56,000–$58,000 range and raising serious questions about the sustainability of the bull cycle thesis. A re-acceleration of the MACD histogram to new lows alongside declining OBV would confirm continued institutional distribution.
Weekly Outlook
The directional bias for the week of June 15 leans cautiously neutral-to-bearish, with a short-term relief bounce underway that bears close watching for exhaustion signals. The $66,500–$69,650 resistance corridor is the defining battleground — a clean breakout through this zone on volume would materially shift the intermediate bias, while rejection here would likely reinstate downside pressure toward the $63,000 and potentially $60,000 handles. Traders should monitor the daily candle closes relative to the $66,650 EMA20 level and any shifts in funding rate dynamics or USDT.D as leading indicators of institutional intent. On the macro front, any significant risk-off catalysts in traditional markets could amplify Bitcoin’s downside given the already fragile technical structure, while a surprise bullish macro development could accelerate the relief rally given the oversold weekly RSI. Overall, this remains a high-risk, low-conviction environment — position sizing discipline and defined risk management are paramount until the weekly EMA200 is convincingly reclaimed.
Disclaimer: This analysis is for informational purposes only and does not constitute financial advice. Cryptocurrency markets are highly volatile and unpredictable. All trading decisions should be made based on your own research and risk tolerance. Block Digest is not responsible for any financial losses incurred as a result of acting on this content.