Bitcoin Weekly Analysis: Bearish Engulfing at $63K, 51% From Peak
Weekly Market Overview
Bitcoin endured one of its most punishing weeks of 2026, shedding approximately 12.3% to trade around $63,063–$63,317 as of June 8. The weekly candle is shaping up as a decisive bearish engulfing structure, confirming the breakdown from the multi-month distribution range that had formed below the October 2025 all-time high near $126,200. Price action has now retraced more than 51% from that peak, a magnitude of drawdown that historically marks the transition from a corrective pullback into a more structural bear trend. The confluence of MicroStrategy’s first disclosed Bitcoin sale, record spot ETF outflows exceeding $3.2 billion, and a Mt. Gox wallet transfer created a perfect storm of selling pressure that overwhelmed any near-term demand.
Higher Timeframe Structure
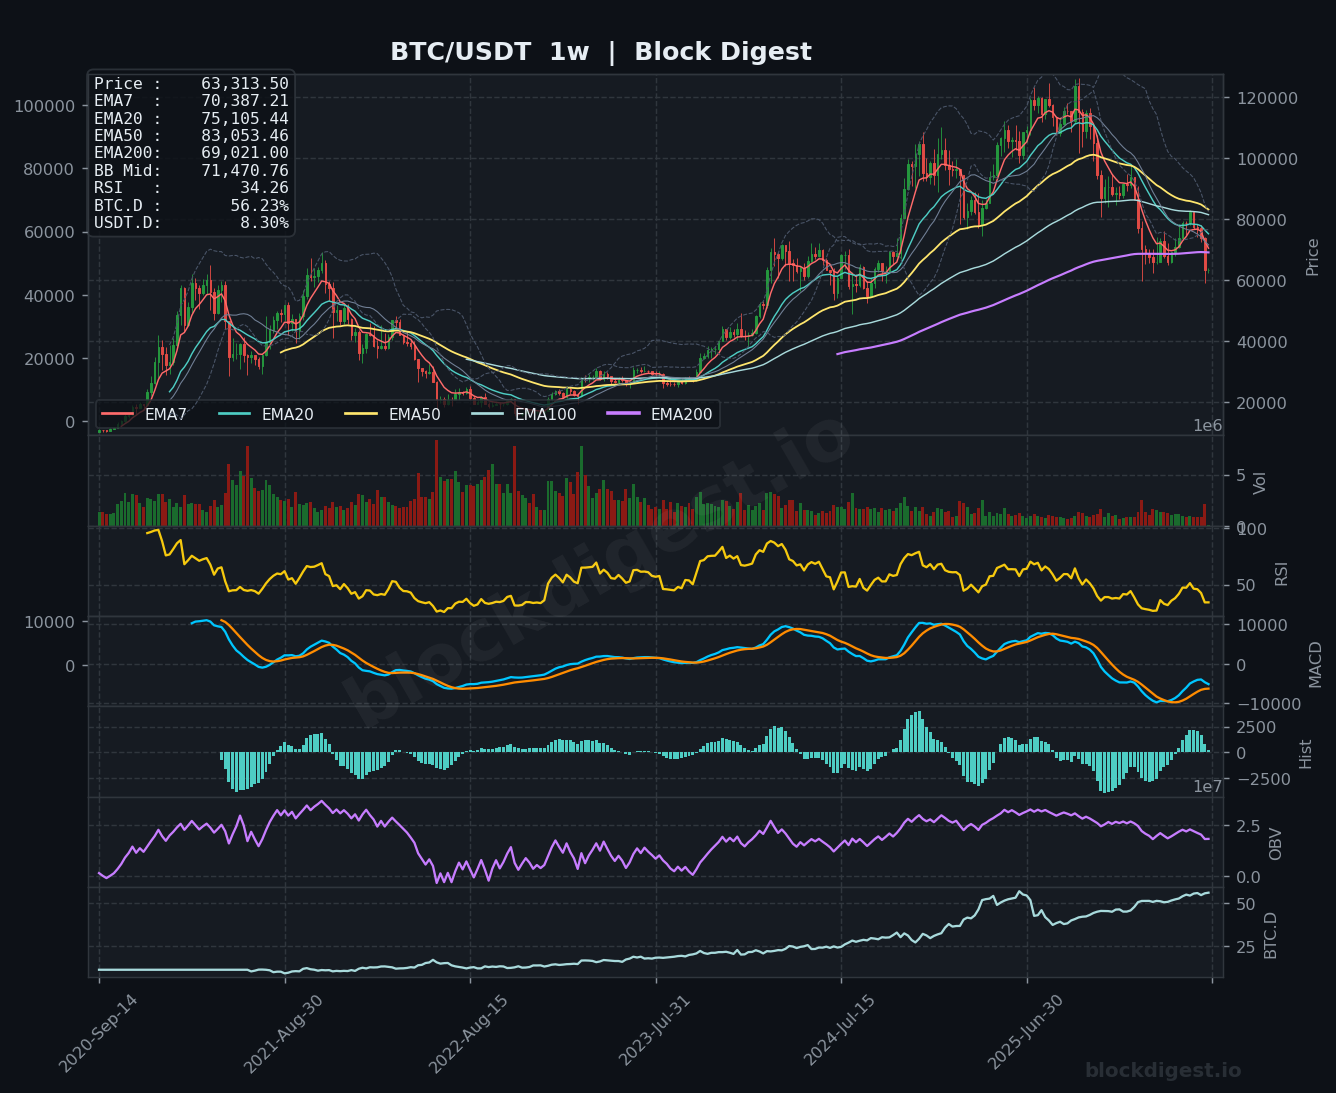
On the weekly chart, the EMA stack has fully inverted into a bearish configuration: price ($63,313) trades below the EMA7 ($70,387), EMA20 ($75,105), EMA50 ($83,053), and EMA100, while the EMA200 ($69,021) — historically a major macro support — has now flipped into overhead resistance. This is a textbook bearish waterfall alignment, and every attempted rally will likely face successive EMA rejections. Price has also broken decisively below the weekly Bollinger Band midline ($71,470), which now acts as resistance, and the lower band is beginning to widen, suggesting volatility expansion to the downside. The weekly RSI at 34.26 is approaching oversold territory but has not yet reached the extreme readings (sub-30) seen at prior cycle lows, indicating room for further downside before a durable bottom is confirmed.
Multi-Timeframe Confluence
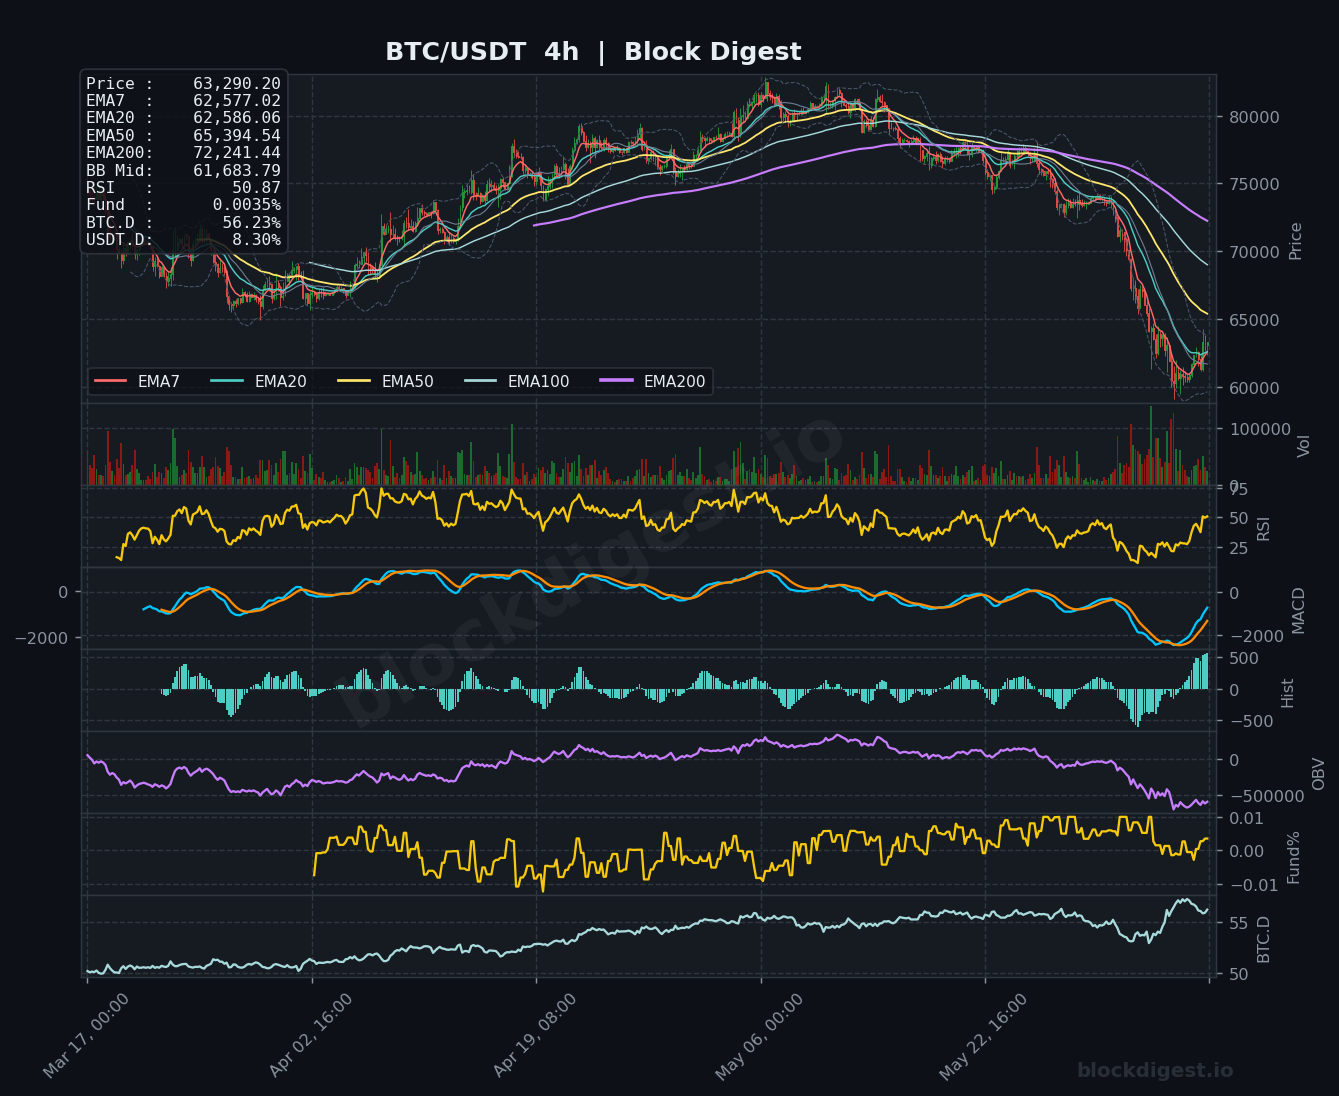
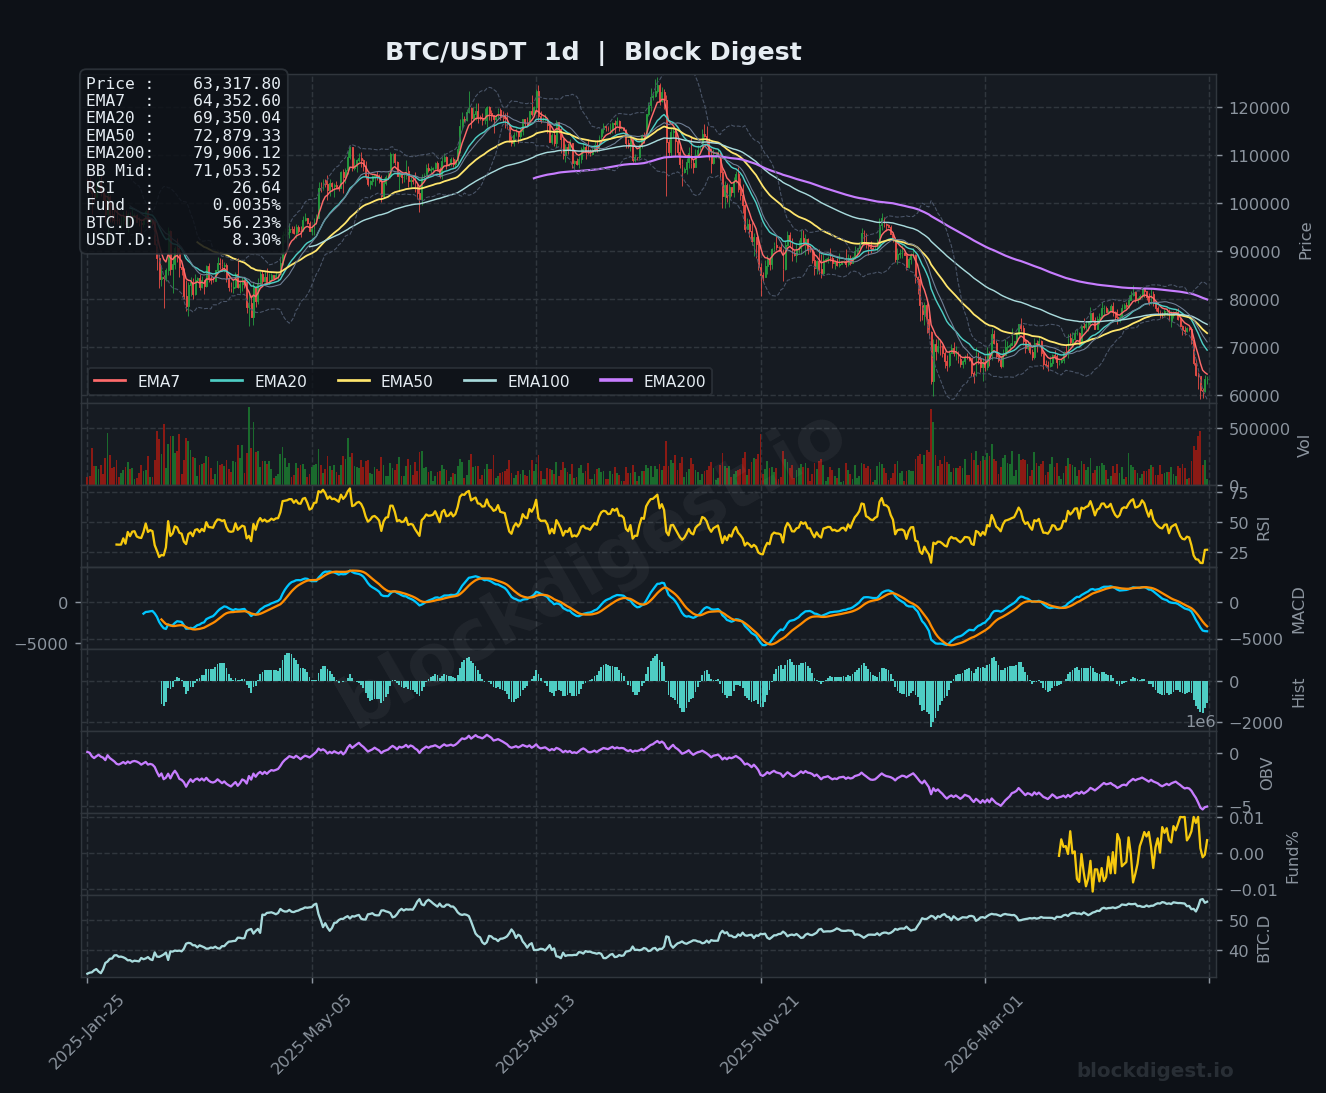
Across all three timeframes, the bearish thesis is remarkably aligned, offering little ambiguity about the prevailing trend direction. On the daily chart, price trades below a fully bearish EMA stack — EMA7 ($64,352), EMA20 ($69,350), EMA50 ($72,879), and EMA200 ($79,906) — all sloping downward in sequence. The 4-hour chart shows the EMA7 ($62,577) and EMA20 ($62,586) have converged tightly just below current price, providing a thin dynamic resistance ceiling in the $62,500–$63,000 zone that bulls must reclaim with conviction. The only marginally constructive signal is that the 4H RSI has stabilized near the 50 level, suggesting a brief consolidation or relief bounce may be underway, but this is firmly contained within a broader downtrend on both the daily and weekly frames.
Key Weekly Levels
- Weekly Resistance: $69,021 (weekly EMA200, now overhead resistance); $71,470 (weekly BB midline, critical reclaim level); $75,105 (weekly EMA20, structural resistance)
- Weekly Support: $60,000 (major psychological level and historical demand zone); $58,000–$59,000 (lower weekly Bollinger Band and prior accumulation range); $52,000–$54,000 (2024 pre-halving highs, last major macro support shelf)
Momentum & Volume Analysis
The weekly MACD remains in deep bearish territory, with the signal line and MACD line diverging further to the downside and histogram bars extending red — there is no sign of a bullish crossover or momentum deceleration at the weekly level. On the daily timeframe, RSI has plunged to 26.64, firmly in oversold territory, which historically has preceded short-term bounces but does not guarantee a trend reversal without fundamental catalyst support. The weekly OBV has rolled over sharply from its peak, corroborating the price decline with real volume-driven distribution rather than a thin-volume shakeout. Funding rates across all timeframes are sitting at a modest positive +0.0035%, a surprisingly neutral reading given the scale of the selloff, suggesting that while leveraged longs have been liquidated, the market has not yet flipped into the negative funding (short-dominated) environment that typically marks capitulation bottoms.
BTC Dominance & Altcoin Implications
BTC Dominance at 56.23% remains elevated and has been trending higher on the weekly chart, which historically signals that altcoins are bleeding harder than Bitcoin — a classic risk-off rotation where capital consolidates into the “safest” crypto asset. USDT Dominance at 8.30% has ticked higher, confirming that sideline stablecoins are accumulating rather than deploying into risk assets, a bearish signal for the broader market. Until BTC.D peaks and begins to roll over meaningfully — typically a signal that risk appetite is returning — altcoin outperformance should not be expected, and any portfolio rotation into altcoins carries elevated drawdown risk.
Risk Scenarios
- Bull case: A decisive daily close back above $65,000, accompanied by a return of positive spot ETF inflows and a macro catalyst such as a dovish NFP reading, could trigger a short-squeeze toward $69,000–$71,470 (weekly BB midline). Sustained buying through the EMA200 on the weekly ($69,021) would be the first structural signal that the corrective low is in, with longer-term targets toward $75,000–$78,000 on a multi-week recovery.
- Bear case: Failure to hold the $60,000 psychological level on a weekly closing basis would confirm a full breakdown into the prior consolidation range, opening downside toward $58,000–$59,000 at the lower Bollinger Band, and potentially the $52,000–$54,000 macro support shelf if ETF outflows continue and macro sentiment deteriorates further.
Weekly Outlook
The path of least resistance remains firmly to the downside, with price trapped below all major EMAs on the weekly and daily timeframes and momentum indicators yet to reach the exhaustion levels that historically precede durable reversals. The most critical level to watch this week is $60,000 — a clean weekly close below it would be a significant bearish development likely to accelerate selling and trigger stop-loss cascades. On the upside, bulls need to reclaim $65,000 with strong volume and ETF inflow data to even begin discussing a stabilization thesis. Key catalysts to monitor include US nonfarm payrolls (a weak print could revive Fed rate cut expectations and provide a temporary bid), continued ETF flow data, and any further Mt. Gox-related wallet movements. Overall, this is a market in distribution, not accumulation — and while the daily RSI oversold reading may produce a short-term relief bounce toward $65,000–$67,000, the weekly structure strongly favors selling into strength rather than buying dips until macro and flow conditions materially improve.
Disclaimer: This analysis is for informational purposes only and does not constitute financial advice. Cryptocurrency markets are highly volatile and unpredictable. All trading decisions should be made based on your own research and risk tolerance. Block Digest is not responsible for any financial losses incurred as a result of acting on this content.