Weekly Market Overview
Bitcoin enters the week of June 22, 2026 trading around $64,226, caught in a prolonged corrective phase following what appears to have been a cycle peak near $109,000–$110,000 in late 2025. Price action this week has been characterized by continued compression below key moving averages, with BTC struggling to reclaim meaningful resistance levels on the daily and weekly charts. The weekly candle structure reflects a market in distribution or deep correction, with lower highs persisting since the peak. Broader context suggests this is the most significant drawdown of the current cycle, with BTC having retraced roughly 40–42% from all-time highs.
Higher Timeframe Structure
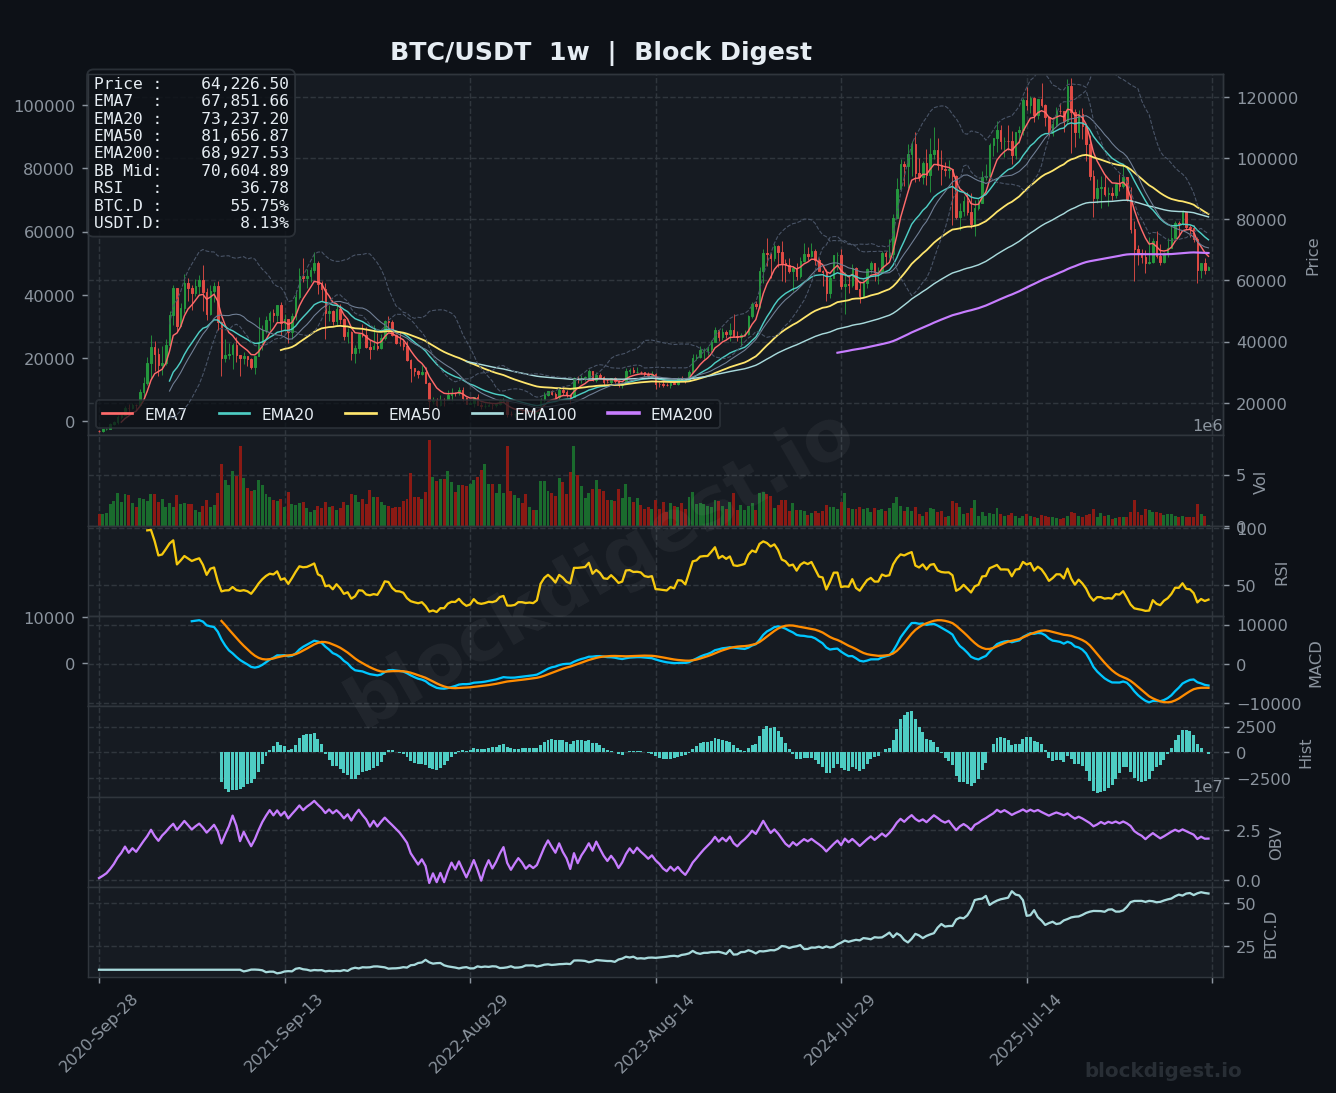
On the weekly chart, the EMA stack is in a firmly bearish configuration: price sits well below the EMA7 ($67,851), EMA20 ($73,237), EMA50 ($81,656), and EMA100, with only the EMA200 ($68,927) offering any nearby reference — and price is currently trading beneath it. The weekly Bollinger Band midline sits at $70,604, acting as dynamic resistance that has capped recent recovery attempts. Weekly RSI has deteriorated to 36.78, approaching oversold territory but not yet at levels historically associated with confirmed macro bottoms in prior cycles. The macro trend remains structurally bullish on multi-year timeframes, but the intermediate structure is clearly broken and requires significant repair before a new leg higher can be credibly confirmed.
Multi-Timeframe Confluence
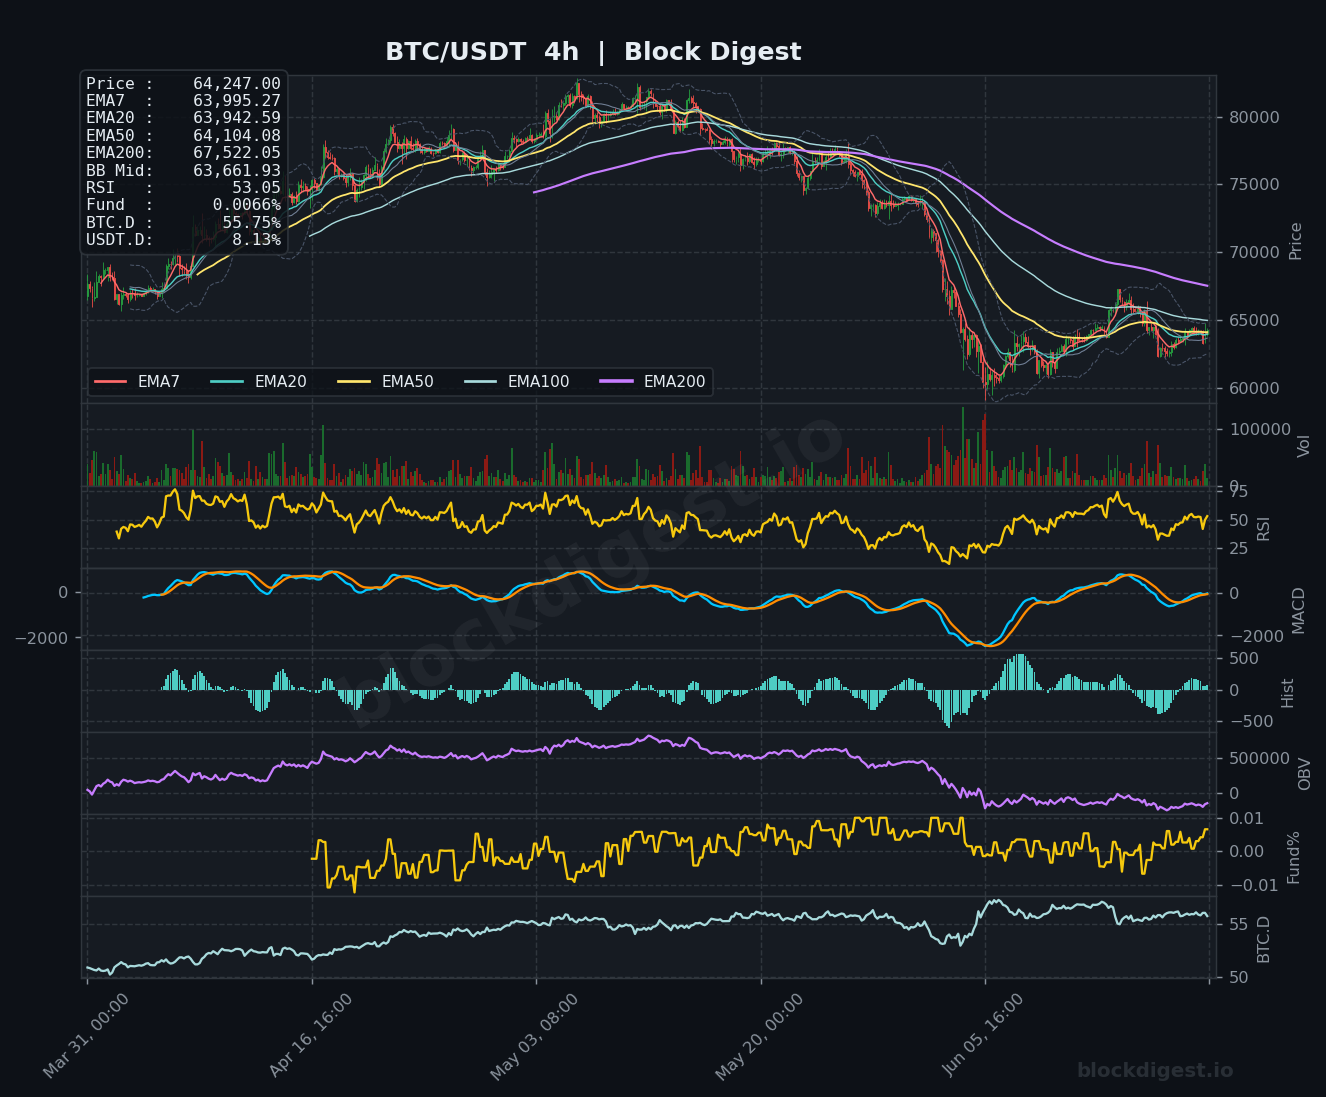
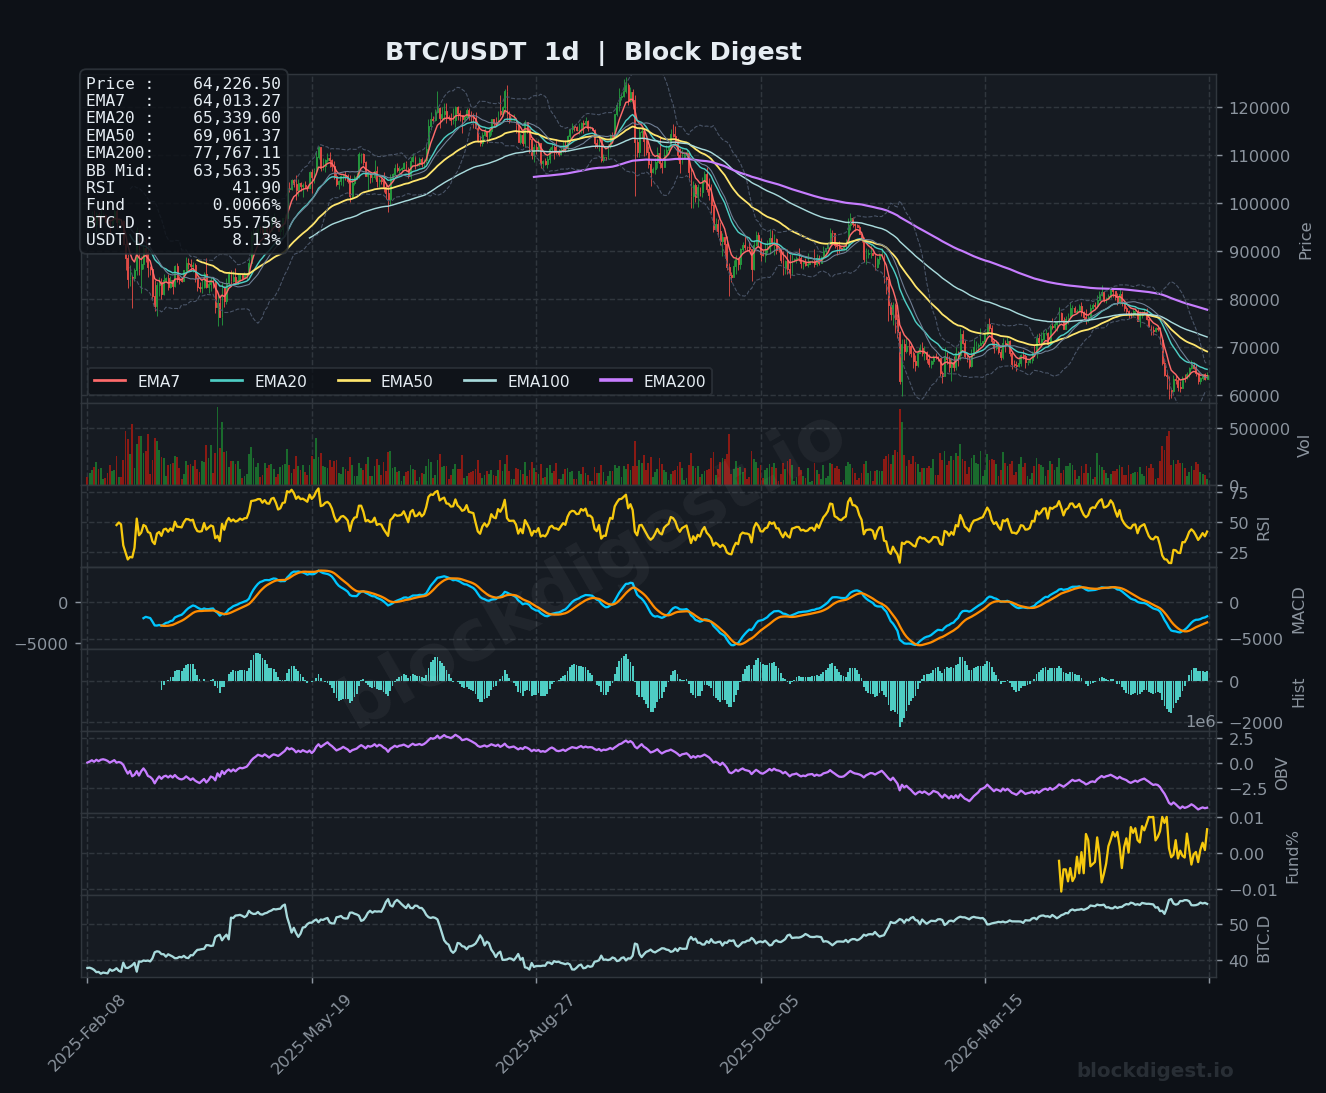
Across all three timeframes, the bearish narrative is consistent and reinforcing. On the daily chart, price is trading below the EMA20 ($65,339) and EMA50 ($69,061), with the EMA200 at $77,767 acting as a distant ceiling — daily RSI at 41.90 confirms weak momentum without yet signaling oversold capitulation. The 4-hour timeframe offers a slightly more constructive picture, with price ($64,247) trading marginally above its EMA7 ($63,995) and EMA20 ($63,942), suggesting a tentative short-term stabilization attempt around the $63,500–$64,500 zone. However, the 4H EMA200 at $67,522 looms as a significant overhead obstacle, and the short-term recovery has not yet generated sufficient momentum to challenge that level meaningfully.
Key Weekly Levels
- Weekly Resistance:
- $67,500–$68,000 — Confluence of the weekly EMA200 ($68,927) and 4H EMA200 ($67,522); reclaiming this zone is the first meaningful structural test
- $70,600–$73,240 — Weekly Bollinger Band midline and weekly EMA20; a recovery into this range would signal a potential trend shift
- $78,000–$81,650 — Daily EMA200 and weekly EMA50; major macro resistance that defined prior support during the bull run
- Weekly Support:
- $63,500–$63,660 — 4H Bollinger Band midline and near-term demand zone where price has been consolidating
- $60,000–$61,000 — Psychological round number and prior structural support visible on the weekly chart; critical macro floor
- $56,000–$58,000 — Deeper demand area corresponding to the 2024 pre-halving consolidation highs; last-resort support before a more severe bear scenario
Momentum & Volume Analysis
Weekly MACD remains in negative territory with the signal line separation still wide, indicating that downside momentum, while potentially decelerating, has not reversed on the macro timeframe. The weekly histogram shows slightly shrinking negative bars, which could be an early sign of bearish exhaustion, but no bullish crossover is imminent. Daily MACD mirrors this picture — still below zero with compressed histogram values — while the 4H MACD has recently crossed into positive territory, producing small positive histogram bars that indicate the short-term bounce has modest internal support. The funding rate across all timeframes sits at a near-neutral +0.0066%, which is a notable observation: the market is not overleveraged to the long side, suggesting the current price level is not being artificially supported by excessive speculation, and a short squeeze scenario remains possible if sentiment shifts.
BTC Dominance & Altcoin Implications
BTC dominance (BTC.D) is currently at 55.75%, having risen sharply from lows near 50% earlier in the cycle — a trend visible on both the 4H and daily charts. This elevated dominance level signals continued capital rotation into Bitcoin as a relative safe haven within crypto, with altcoins broadly underperforming. USDT.D at 8.13% indicates that stablecoin allocation remains elevated, reflecting persistent risk-off sentiment and sidelined capital that has not yet committed to re-entering the market aggressively. Until BTC.D shows a clear reversal or stabilization below 54%, altcoin season rotation is unlikely, and BTC itself may need to demonstrate sustained recovery first.
Risk Scenarios
- Bull case: A successful defense of the $63,500 support zone, combined with a reclaim of the $67,500–$68,000 level (weekly EMA200), would signal a structural base formation and open the door toward $73,000–$75,000 in the medium term. Sustained daily closes above $70,600 (weekly BB midline) with improving RSI momentum would confirm a trend recovery and invite more aggressive long positioning. A catalyst such as macro risk-on sentiment, improving equities, or institutional inflows could accelerate the move.
- Bear case: Failure to hold $63,500 on a weekly closing basis opens the path to a retest of $60,000–$61,000, a psychologically and technically critical support level. A break below $60,000 with conviction would represent a significant structural deterioration, targeting the $56,000–$58,000 demand zone and raising the prospect of a full cycle reset toward lower macro support around $50,000.
Weekly Outlook
The directional bias for the week ahead is cautiously neutral to slightly bearish, with a modest short-term stabilization in play on the 4H chart that lacks the conviction or volume to challenge higher resistance zones. The most critical level to monitor is the $63,500–$64,500 consolidation range — a sustained break below this zone would likely accelerate selling pressure, while a clean 4H close above $65,500 could invite a test of the $67,500 region where the first meaningful cluster of resistance awaits. Macro catalysts — including any Federal Reserve communications, U.S. economic data releases, or broader risk asset developments — could be the deciding factor in tipping price toward either scenario this week. The neutral funding rate provides a somewhat encouraging backdrop, as it limits forced liquidation risk on either side. Traders should remain disciplined, treating any rally as a potential selling opportunity until weekly structure repairs above $68,000–$70,000 are achieved.
Disclaimer: This analysis is for informational purposes only and does not constitute financial advice. Cryptocurrency markets are highly volatile and unpredictable. All trading decisions should be made based on your own research and risk tolerance. Block Digest is not responsible for any financial losses incurred as a result of acting on this content.
Stay Ahead of the Market
Follow BlockDigest for crypto market intelligence, research and real-time updates.