
Daily Analysis
ETH Daily Analysis — 2026-07-23 (Full Archive)
Market Overview Ethereum is currently trading at $1,912.78, holding above its short-term EMA cluster on the daily timeframe while remaining well below the EMA200 at $2,184.97 — a significant macro resistance barrier that continues to define the broader bearish structure from the 2025 highs. The daily chart shows price trading above EMA7 ($1,898.79), EMA20 ($1,839.74),...
BTC Daily Analysis — 2026-07-23 (Full Archive)
Market Overview Bitcoin is trading at approximately $65,382 as of July 23, 2026, pulling back roughly 1% after touching a seven-week high near $67,000 earlier this week. On the daily timeframe, price has reclaimed the EMA7 ($65,300) and EMA50 ($65,121), a constructive structural shift following the extended correction from the all-time high region. However, BTC...
ETH Daily Analysis — 2026-07-22 (Full Archive)
Market Overview Ethereum is trading at $1,912.12 as of July 22, 2026, attempting to consolidate after a sharp recovery from multi-month lows near $1,600 seen earlier in the summer. On the daily timeframe, price has reclaimed the EMA7 ($1,888.78), EMA20 ($1,830.02), and EMA50 ($1,826.05) — a meaningful structural shift — though it remains well beneath...
BTC Daily Analysis — 2026-07-22 (Full Archive)
Market Overview Bitcoin is trading at approximately $65,757 as of July 22, 2026, navigating a critical juncture following a multi-month recovery from lows near $59,000. On the daily timeframe, price has reclaimed the EMA7 ($65,191) and EMA50 ($65,097), signaling a constructive short-term structure, though it remains decisively below the EMA200 at $73,813 — a sobering...
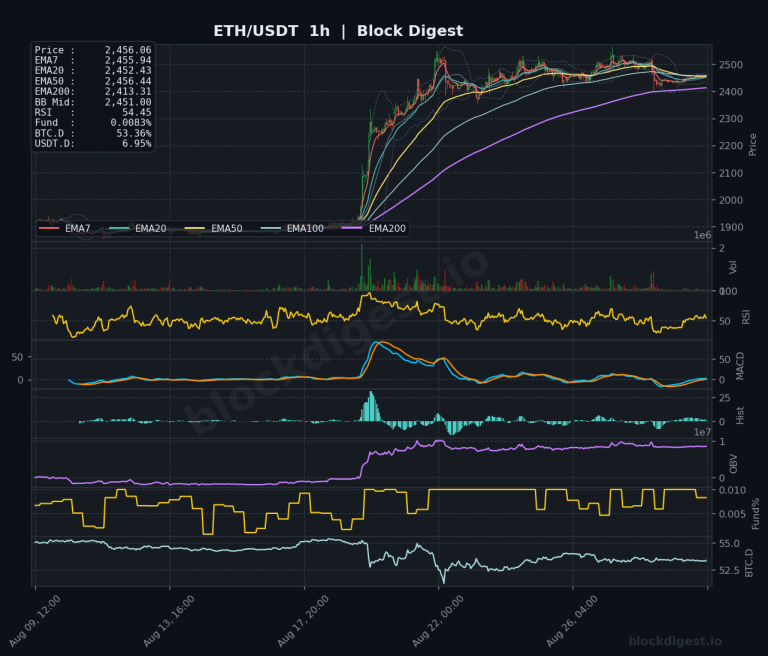
Ethereum Daily Technical Analysis
Market Overview Ethereum is currently navigating a pivotal consolidation phase, trading at $2,456.06, which places it firmly above all major daily EMAs. The price action remains constructive, holding well above the daily Bollinger Band midline of $2,219.25, signaling a sustained bullish structure on the higher timeframe. While the daily trend is clearly defined by the...
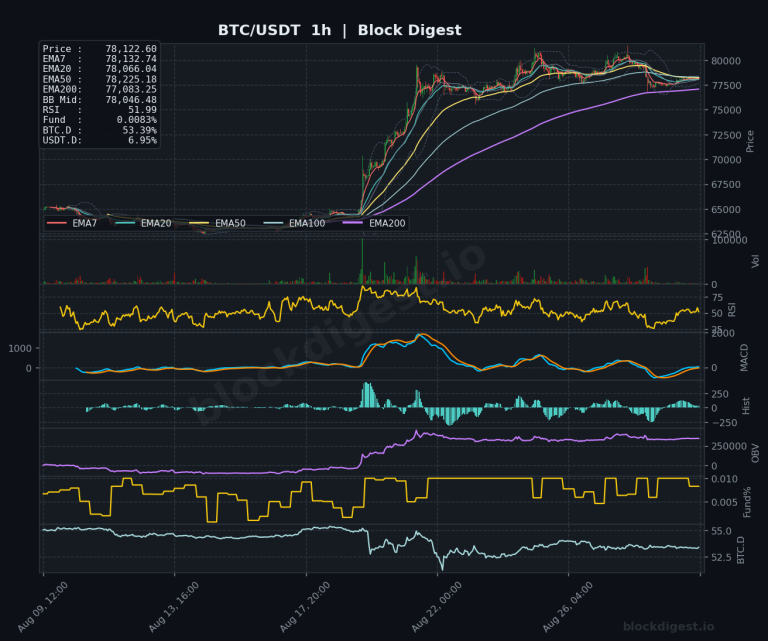
Bitcoin Daily Technical Analysis
Market Overview Bitcoin is currently exhibiting strong bullish momentum, trading at $78,122.70, which places it comfortably above all major daily EMAs. The price action is consolidating near the daily Bollinger Band mid-line of $71,741.69, having recently reclaimed key structural levels. The daily trend remains firmly upward, supported by a constructive alignment of short-term EMAs over...
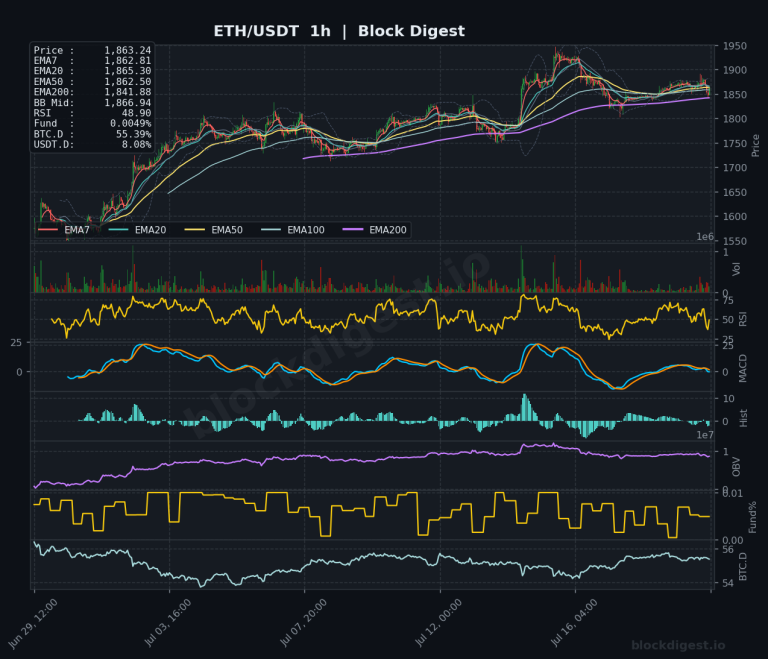
Ethereum Daily Analysis: Ethereum consolidates at $1,863 near Bollinger midline
Market Overview Ethereum is trading at $1,863.63 as of July 20, 2026, consolidating just below the Bollinger Band midline on the daily chart ($1,798.10 BB Mid) after a meaningful recovery from lows near $1,550 seen earlier this quarter. Price has reclaimed all short-term EMAs on the daily timeframe — the EMA7 ($1,855.02), EMA20 ($1,806.24), and...
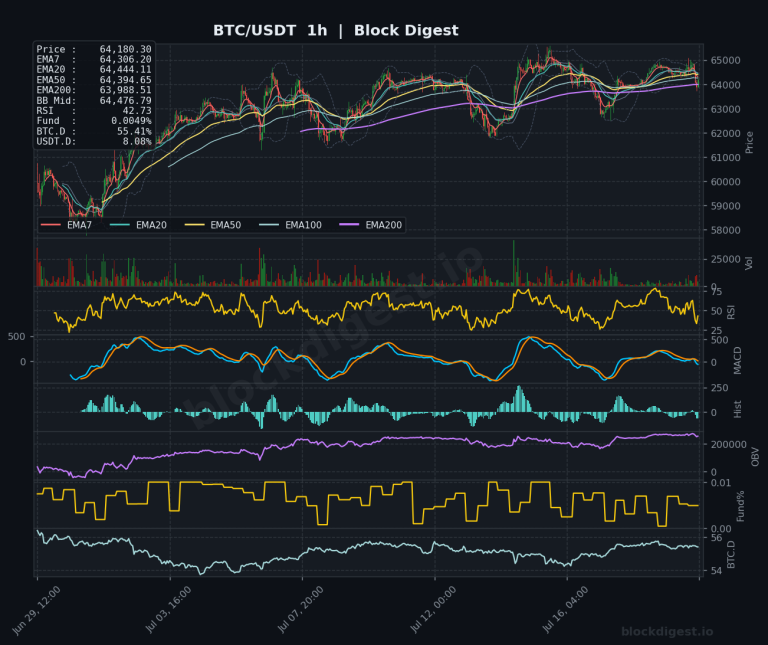
Bitcoin Daily Analysis: Bitcoin stabilizes below EMA50 after multi-month decline
Market Overview Bitcoin is trading at $64,180 as of July 20, 2026, navigating a structurally delicate zone as it attempts to stabilize following a prolonged multi-month downtrend from highs above $100,000. On the daily timeframe, price sits just below the EMA50 ($64,970) while holding marginally above the EMA7 ($64,232) and EMA20 ($63,668), suggesting the market...
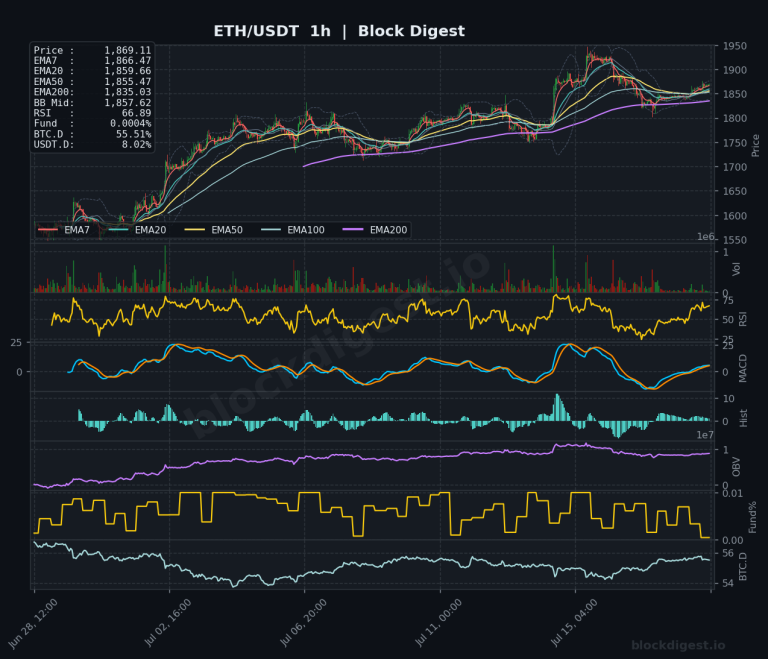
Ethereum Daily Analysis: ETH Holds $1,869 Above Key Moving Averages
Market Overview ETH/USDT is currently trading at $1,869.00, holding above its key short-term EMAs on the daily timeframe after a prolonged downtrend that saw price shed over 60% from its 2025 highs near $4,500. The daily chart shows price has reclaimed the EMA7 ($1,851.53) and is pressing above the EMA20 ($1,799.96) and EMA50 ($1,814.60) —...
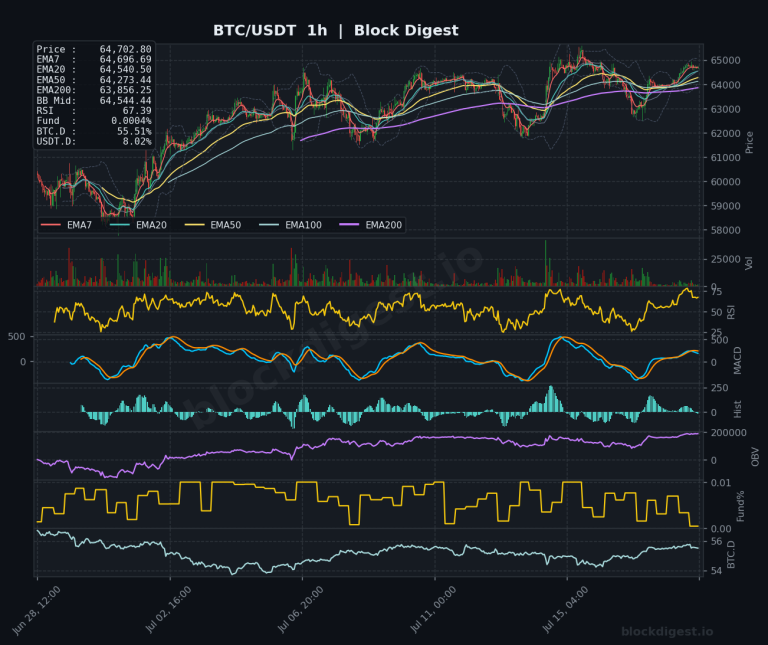
Bitcoin Daily Analysis: BTC Recovery Above EMA7 Faces EMA50 Resistance
Market Overview BTC/USDT is currently trading at $64,702.90, sitting in a recovery phase following a significant multi-month drawdown from prior all-time highs above $108,000. On the daily timeframe, price is trading above the EMA7 ($64,254) and EMA20 ($63,615), signaling short-term bullish structure, but remains firmly beneath the EMA50 ($65,003) and EMA200 ($74,112) — both of...

Ethereum Daily Analysis: ETH consolidates at $1,842 above key moving averages
Market Overview ETH/USDT is currently trading at $1,842.98, consolidating in a narrow range after a notable recovery from multi-month lows near $1,550 printed earlier in the cycle. On the daily timeframe, price has reclaimed both the EMA7 ($1,841.01) and EMA20 ($1,790.91), and is pushing above the EMA50 ($1,811.65) — a constructive development that suggests the...

Bitcoin Daily Analysis: BTC at $63.9K Below EMA50 Resistance
Market Overview BTC/USDT is currently trading at $63,982.40, sitting in a technically ambiguous zone following a pullback from the recent $65,500 high. On the daily timeframe, price remains in a broader recovery structure after a prolonged downtrend from all-time highs, but is notably trading below the daily EMA50 ($64,983.02) and well beneath the EMA200 ($74,220.33),...