ETH Daily Analysis — 2026-07-23 (Full Archive)
Market Overview
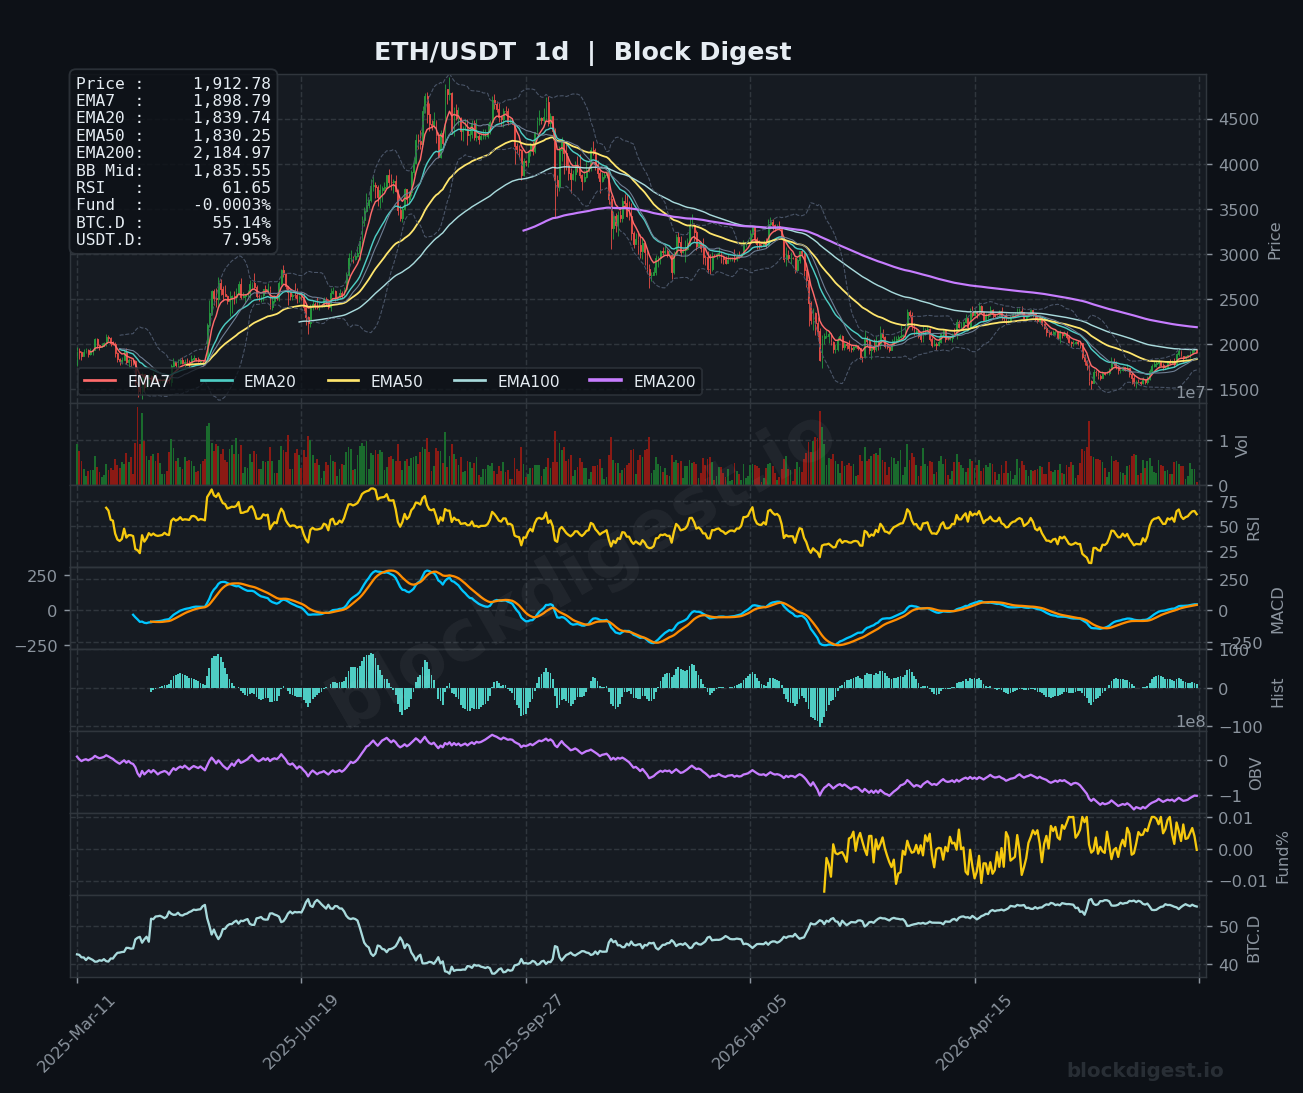
Ethereum is currently trading at $1,912.78, holding above its short-term EMA cluster on the daily timeframe while remaining well below the EMA200 at $2,184.97 — a significant macro resistance barrier that continues to define the broader bearish structure from the 2025 highs. The daily chart shows price trading above EMA7 ($1,898.79), EMA20 ($1,839.74), and EMA50 ($1,830.25), a meaningful recovery from the deep lows seen earlier in the year, suggesting a nascent intermediate-term recovery phase is underway. The daily Bollinger Band midline sits at $1,835.55, with price comfortably extended above it, indicating bullish momentum on that timeframe. Overall, the dominant daily structure remains a long-term downtrend, but price action since the spring lows reflects a credible base-building effort.
Multi-Timeframe Confluence
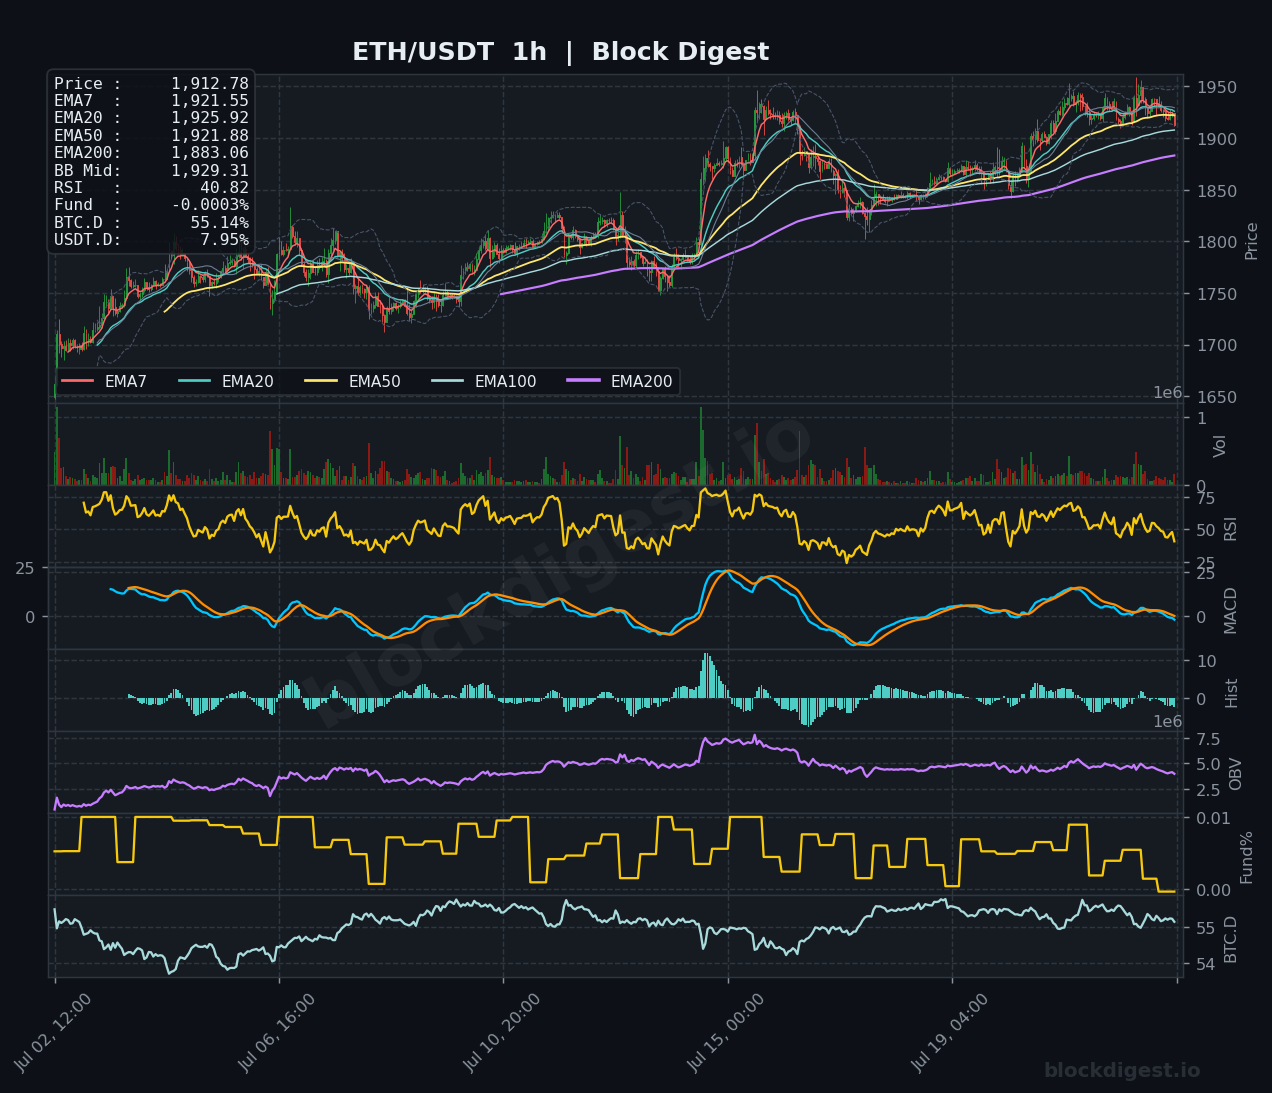
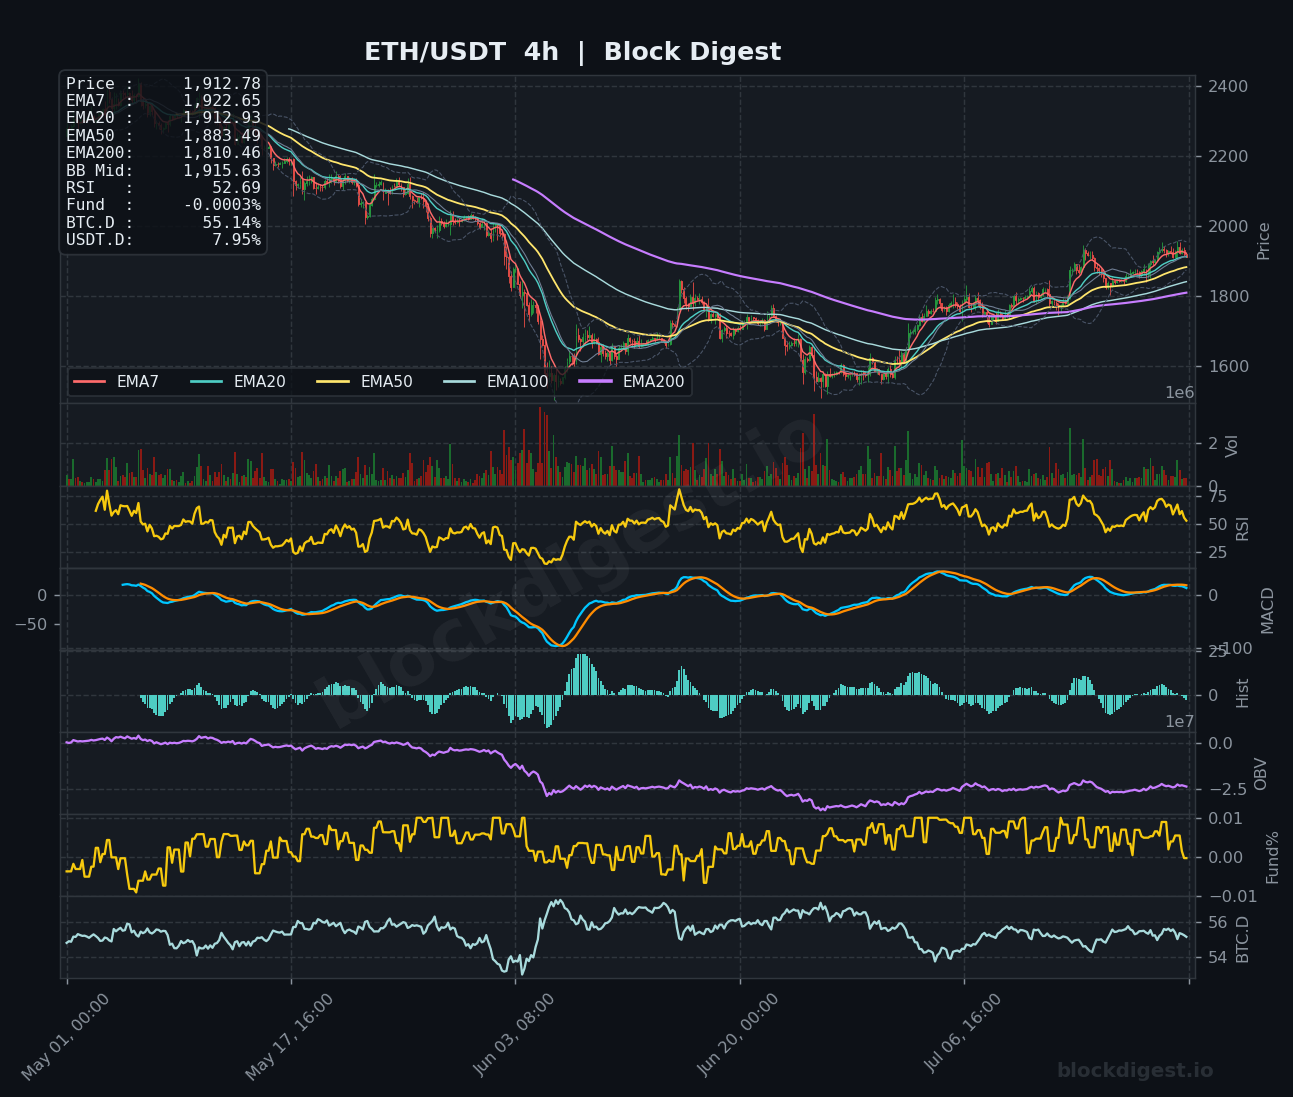
On the 1-hour chart, ETH has pulled back slightly from recent highs near $1,950, with price now sitting below the BB mid at $1,929.31 and beneath the EMA7 ($1,921.55), EMA20 ($1,925.92), and EMA50 ($1,921.88) — all tightly compressed, signaling short-term indecision after a strong rally leg. The 4-hour timeframe presents a more constructive picture: price is testing the EMA20 ($1,912.93) as near-term support, with the EMA50 at $1,883.49 providing secondary backing, and the MACD lines are curling positively back toward the zero line after an extended bearish period. The daily timeframe’s bullish EMA structure (EMA7 > EMA20 > EMA50) aligns with the 4H recovery trend, though the 1H short-term weakness introduces the possibility of a brief consolidation or shallow retest before continuation. The convergence of support near $1,880–$1,900 across the 4H and daily EMAs creates a meaningful confluence zone for potential buyers.
Key Levels to Watch
- Resistance:
- $1,929–$1,935 — 1H BB midline and compressed EMA cluster; reclaiming this zone would reestablish short-term bullish control
- $1,950–$1,960 — recent swing high on the 1H/4H charts; clearing this level opens a push toward the $2,000 psychological barrier
- $2,000–$2,050 — psychological round number and prior consolidation zone on the 4H chart; also where the descending 4H EMA200 ($1,810.46 on 4H vs $2,184.97 on daily) context becomes increasingly relevant
- Support:
- $1,883–$1,895 — confluence of 4H EMA50 and daily EMA7; first meaningful demand shelf on a dip
- $1,830–$1,840 — daily EMA20 and daily BB midline; key higher-timeframe support that must hold to preserve the recovery thesis
- $1,780–$1,800 — 4H EMA200 at $1,810 and prior structure; a breach here would represent a significant technical deterioration
Momentum & On-Chain Signals
The daily RSI at 61.65 reflects solid upside momentum without yet entering overbought territory on that timeframe, while the 4H RSI at 52.69 sits in neutral territory — suggesting room for expansion before encountering significant momentum resistance. The 1H RSI has cooled to 40.82, consistent with the current short-term pullback and not yet flashing oversold readings that would typically trigger a bounce. Our proprietary BD Pulse Score sits at 63/100 (Bullish), with the BD Extreme Index registering +1.32σ — technically overbought on a near-term basis — which corroborates the 1H softness and suggests the market may need to digest recent gains before the next leg higher. The daily MACD is making a sustained bullish turn, with histogram bars moving positive, though the OBV trend on the daily frame remains negative on a structural basis, a residual of the prolonged distribution from the 2025 peak — worth watching for a sustained OBV reversal to confirm genuine accumulation.
BTC Dominance & Market Sentiment
BTC dominance is holding at 55.14–55.15%, a level that reflects Bitcoin’s continued grip on market leadership amid the current institutional-driven rally, supported by six consecutive days of positive U.S. spot Bitcoin ETF inflows and regulatory progress via the Digital Asset Market Clarity Act. At this dominance level, altcoins including ETH tend to underperform Bitcoin on a relative basis, meaning ETH’s recovery — while technically improving — may remain capped unless dominance begins to roll over meaningfully. USDT dominance at 7.95% is moderate and not at alarming levels, indicating that while cash positions remain elevated, there is not a significant panic-driven flight to stable assets that would pressure risk assets broadly.
Risk Scenarios
- Bullish case: A reclaim of the $1,929–$1,935 EMA cluster on the 1H timeframe, followed by a daily close above $1,950, would confirm the short-term pullback has concluded and open a measured move toward the $2,000–$2,050 resistance zone. Continued positive ETF inflows into both BTC and ETH products alongside softening inflation data would provide the macro catalyst needed to sustain this push.
- Bearish case: A failure to hold the $1,883–$1,895 confluence zone on a 4H closing basis would shift near-term momentum decisively lower, with the $1,830–$1,840 daily EMA cluster becoming the critical line in the sand. A breakdown below $1,800 — coupled with a BTC dominance spike above 56% — would signal that ETH is losing relative strength and that the recovery from the spring lows may be rolling over into a broader corrective phase.
Outlook
ETH’s technical setup as of July 23, 2026 is cautiously constructive on the higher timeframes but requires short-term resolution of the current 1H consolidation. The macro recovery narrative is supported by positive ETF inflow momentum and improving regulatory clarity, but the BD Extreme Index reading of +1.32σ (Overbought) suggests the market has likely priced in near-term optimism and a cooling period is rational. The critical trigger for the next 24–48 hours is whether ETH can reclaim and sustain above the $1,920–$1,929 EMA cluster on the 1H, with a daily close above $1,950 acting as the clearest confirmation of bullish continuation. Until the daily EMA200 at $2,184.97 is challenged — and while BTC dominance remains sticky above 55% — ETH’s upside is likely to be measured and methodical rather than explosive.
—
Disclaimer: This analysis is for informational purposes only and does not constitute financial advice. Cryptocurrency markets are highly volatile and unpredictable. All trading decisions should be made based on your own research and risk tolerance. Block Digest is not responsible for any financial losses incurred as a result of acting on this content.