BTC Daily Analysis — 2026-07-22 (Full Archive)
Market Overview
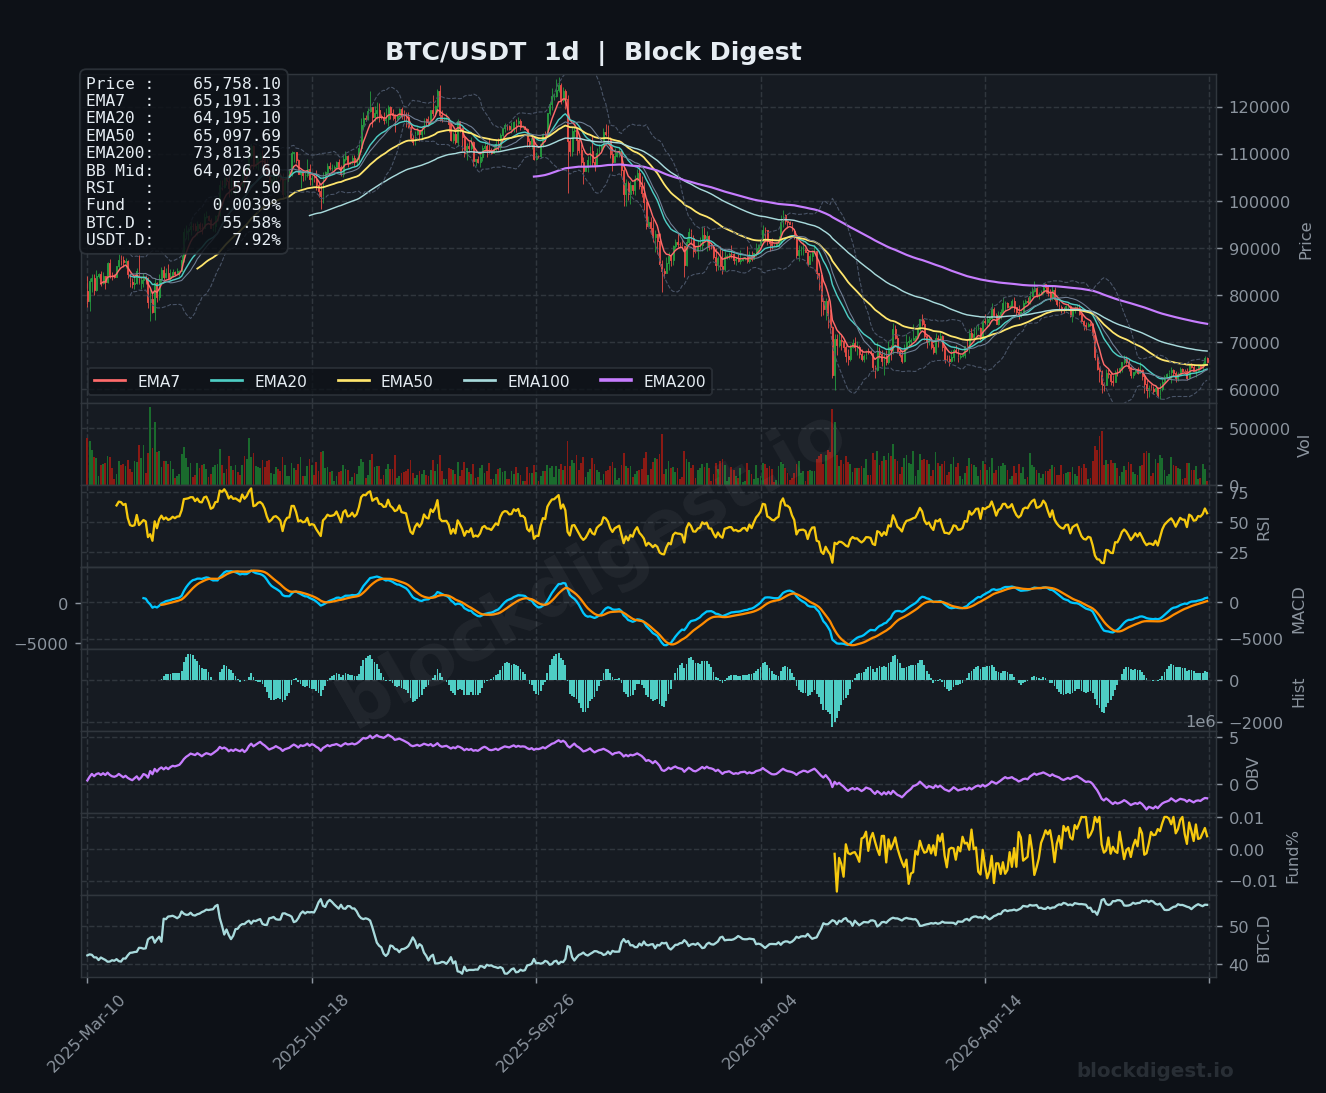
Bitcoin is trading at approximately $65,757 as of July 22, 2026, navigating a critical juncture following a multi-month recovery from lows near $59,000. On the daily timeframe, price has reclaimed the EMA7 ($65,191) and EMA50 ($65,097), signaling a constructive short-term structure, though it remains decisively below the EMA200 at $73,813 — a sobering reminder of the broader downtrend that has defined price action since the all-time high period. Price is currently trading above the daily Bollinger Band midline at $64,026, suggesting near-term bullish control, though the band itself remains wide, reflecting lingering macro uncertainty.
Multi-Timeframe Confluence
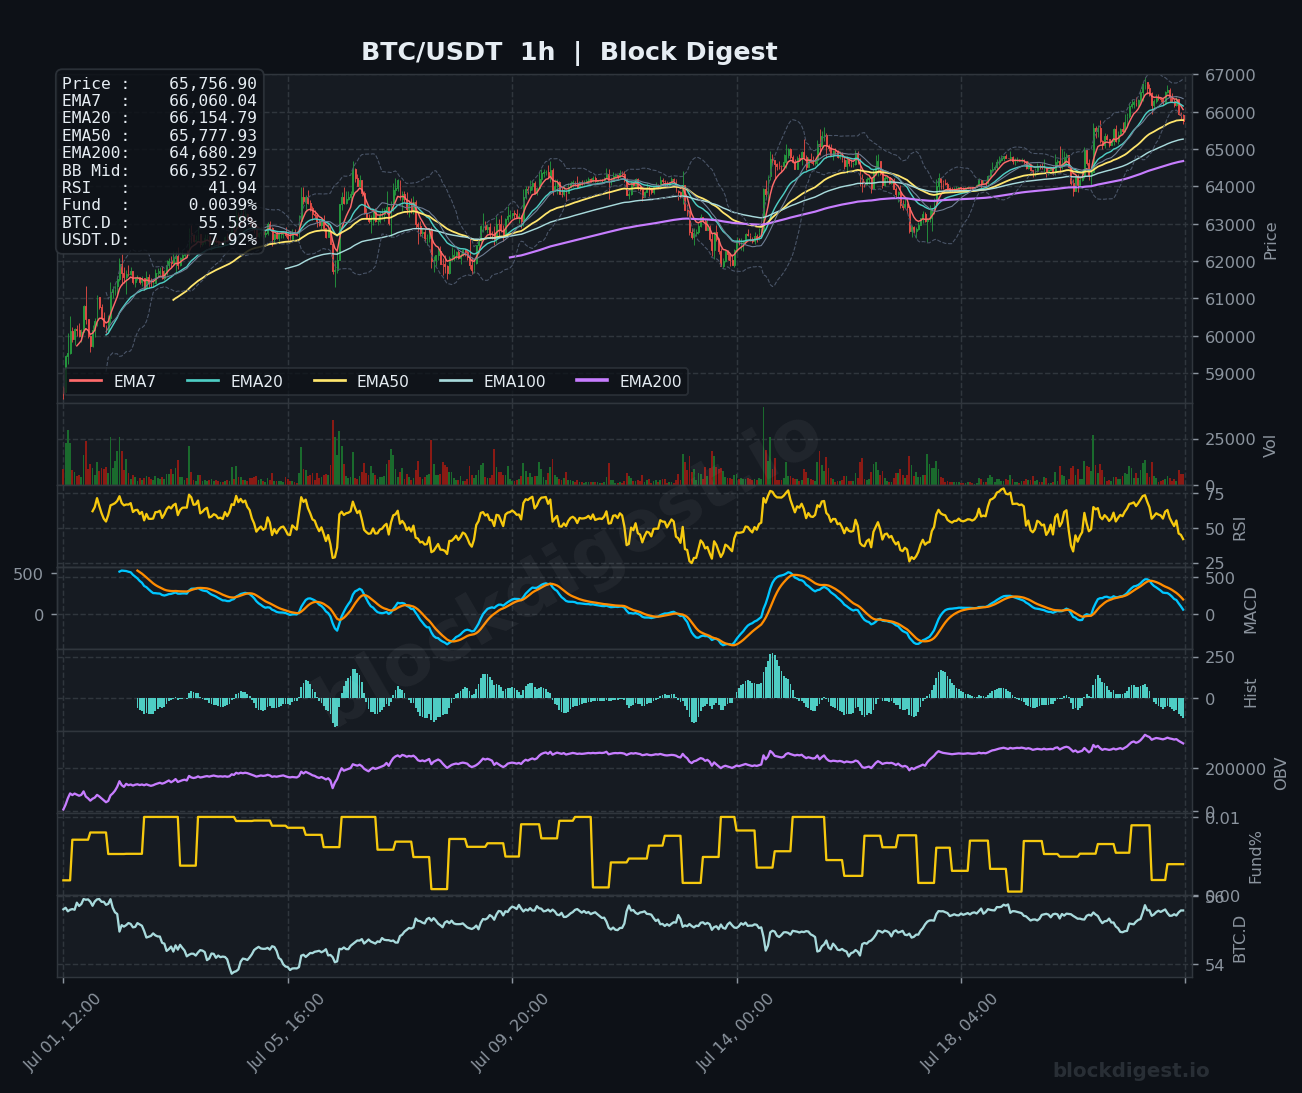
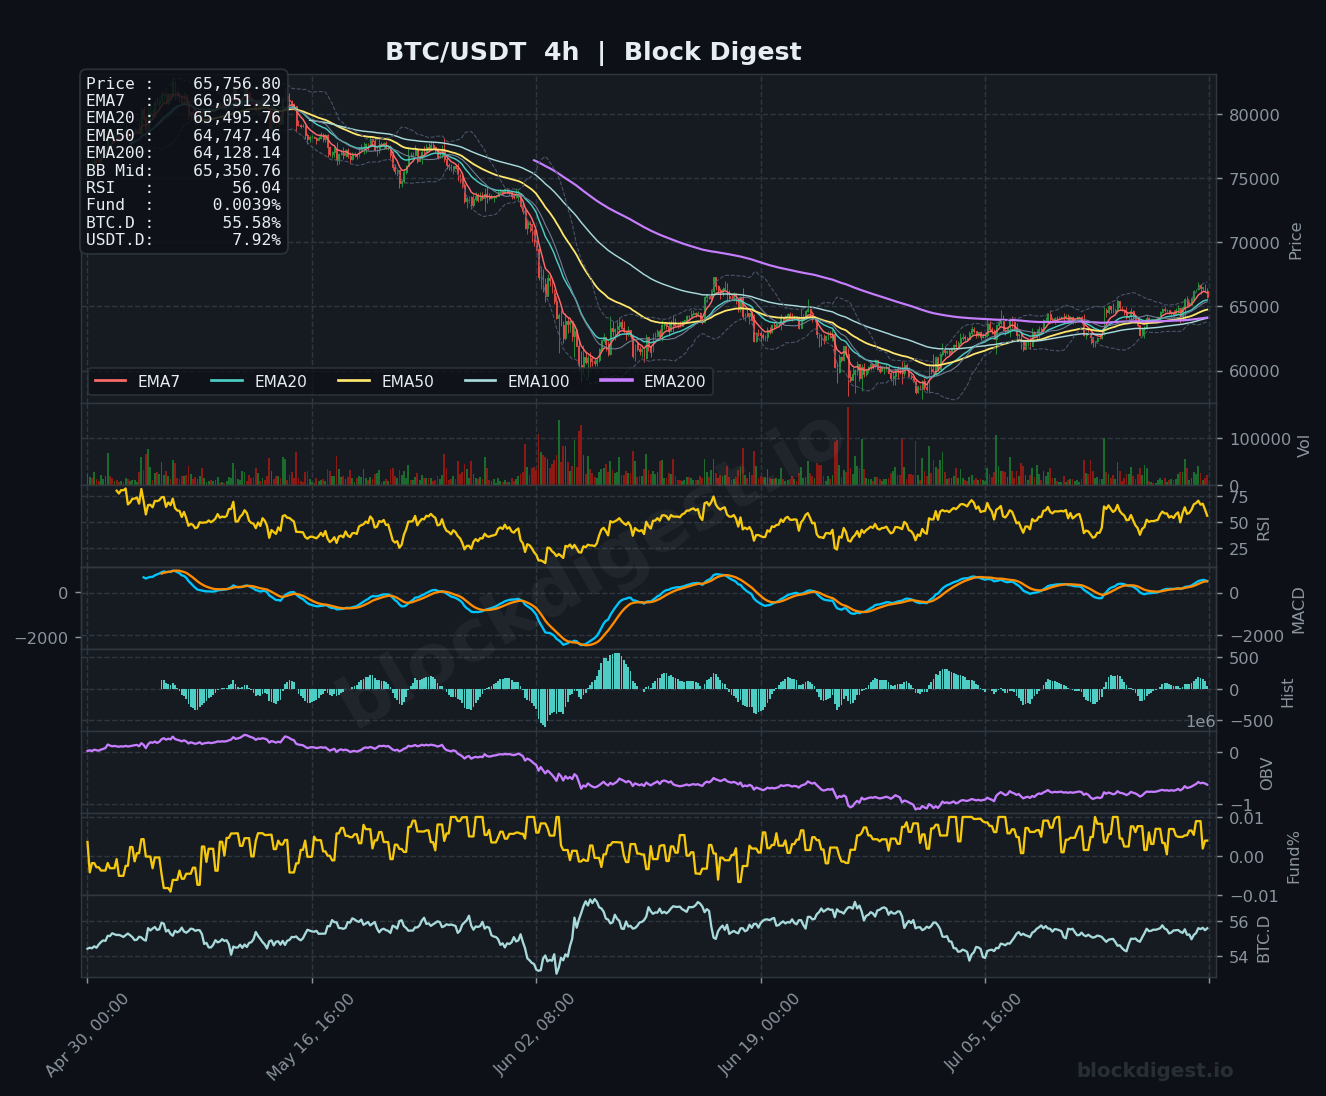
On the 4-hour chart, BTC has staged a meaningful recovery, with the EMA7 ($66,051), EMA20 ($65,495), and EMA50 ($64,747) now stacking in bullish order — a positive structural development after months of bearish EMA compression. However, the 1-hour chart tells a more cautious story: price at $65,757 sits below the EMA7 ($66,060) and EMA20 ($66,154), and also below the 1H Bollinger Band midpoint at $66,352, indicating that short-term momentum is fading after the recent push toward $67,000. The daily and 4-hour timeframes broadly align in a recovery bias, but the hourly pullback suggests the market is digesting recent gains rather than accelerating higher.
Key Levels to Watch
- Resistance: $66,352 — the 1H Bollinger Band midline and immediate overhead supply zone where sellers have reasserted control in recent sessions
- Resistance: $67,000–$67,200 — the recent swing high and a psychologically significant level where Bitcoin briefly traded before retreating; clearing this on volume would mark a multi-week breakout
- Resistance: $73,813 — the daily EMA200, representing the dominant macro resistance and the ceiling of the longer-term downtrend structure
- Support: $65,097–$65,191 — confluence of the daily EMA50 and EMA7, a key near-term floor that has recently been reclaimed and must hold on any retest
- Support: $64,128–$64,195 — the 4H EMA200 and daily EMA20 cluster, offering a deeper but still constructive support zone
- Support: $62,500–$63,000 — prior consolidation lows and the lower Bollinger Band region on the daily chart; a breakdown here would significantly damage the recovery thesis
Momentum & On-Chain Signals
The daily RSI sits at 57.50, reflecting moderate bullish momentum with room to run before reaching overbought territory — consistent with Block Digest’s proprietary BD Pulse score of 61/100, which currently reads bullish. However, the BD Extreme Index at +1.28σ flags that the market is approaching overbought conditions on a statistical basis, warranting caution on fresh long entries at current levels. The 4H MACD is in a slow but continuing bullish crossover, with histogram bars printing positive but shrinking — suggesting momentum is building rather than peaking on that timeframe. On-chain OBV has been trending negatively (BD Pulse OBV Trend: -1), which is a mild divergence worth monitoring; distribution pressure beneath the surface could limit the magnitude of any near-term rally.
BTC Dominance & Market Sentiment
BTC Dominance sits at 55.56%, a level that reflects Bitcoin’s continued grip on market capital flows as altcoins struggle to attract rotation. USDT.D at 7.92% suggests a moderate degree of capital sitting on the sidelines, which could serve as potential dry powder for BTC if sentiment improves. In the current environment, elevated BTC dominance is a double-edged signal — it confirms relative strength in Bitcoin specifically, but also implies broad risk appetite in the crypto market remains suppressed, limiting the likelihood of a sustained altcoin-led rally that typically accompanies more euphoric bull phases.
Risk Scenarios
- Bullish case: A clean reclaim of $66,352 on the 1H chart followed by a high-volume break above $67,000–$67,200 would confirm continuation toward the $69,000–$70,000 range. Legislative tailwinds cited by Standard Chartered in renewing their $100,000 year-end target could serve as the macro catalyst needed to sustain that move.
- Bearish case: Failure to hold the $65,097–$65,191 EMA confluence on a daily close would expose the $64,128 support cluster; a break below $63,000 would invalidate the recovery structure entirely and likely shift sentiment back toward the bearish camp, particularly given the Fear & Greed Index’s recent drop to 29.
Outlook
The overall setup for BTC on July 22, 2026 is cautiously constructive: the daily and 4-hour structures favor bulls, but the 1-hour pullback and the BD Extreme Index reading of +1.28σ suggest the market needs to consolidate before the next leg higher. The key trigger to watch over the next 24–48 hours is whether price can reclaim and sustain above $66,352, which would open the door to another test of the $67,000 resistance. Conversely, a daily close below $65,097 would be the first meaningful warning sign that this recovery attempt is losing steam. Until BTC can mount a credible challenge of the daily EMA200 near $73,813, the macro trend remains bearish, and rallies should be treated as recoveries within a downtrend rather than confirmed trend reversals.
Disclaimer: This analysis is for informational purposes only and does not constitute financial advice. Cryptocurrency markets are highly volatile and unpredictable. All trading decisions should be made based on your own research and risk tolerance. Block Digest is not responsible for any financial losses incurred as a result of acting on this content.