ETH Daily Analysis — 2026-07-22 (Full Archive)
Market Overview
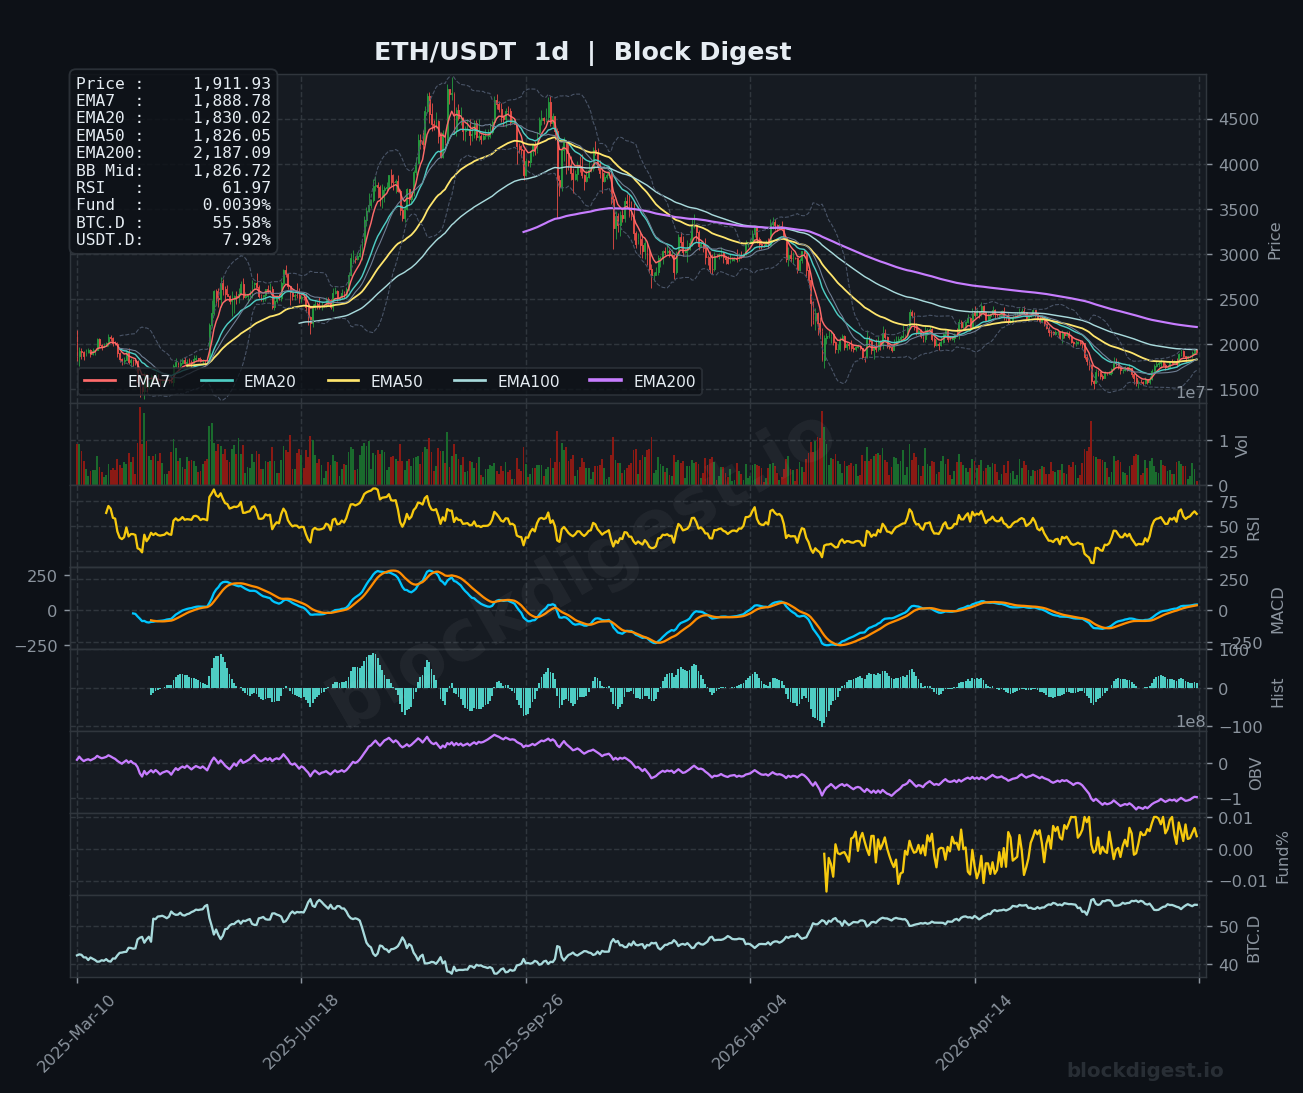
Ethereum is trading at $1,912.12 as of July 22, 2026, attempting to consolidate after a sharp recovery from multi-month lows near $1,600 seen earlier in the summer. On the daily timeframe, price has reclaimed the EMA7 ($1,888.78), EMA20 ($1,830.02), and EMA50 ($1,826.05) — a meaningful structural shift — though it remains well beneath the EMA200 at $2,187.09, which continues to exert significant overhead pressure and underlines the broader bearish macro context. Price is trading above the daily Bollinger Band midline of $1,826.72, suggesting short-term bullish momentum is intact. The dominant daily trend remains a recovery within a longer-term downtrend, and the $1,900–$2,000 zone is shaping up as the critical battleground.
Multi-Timeframe Confluence
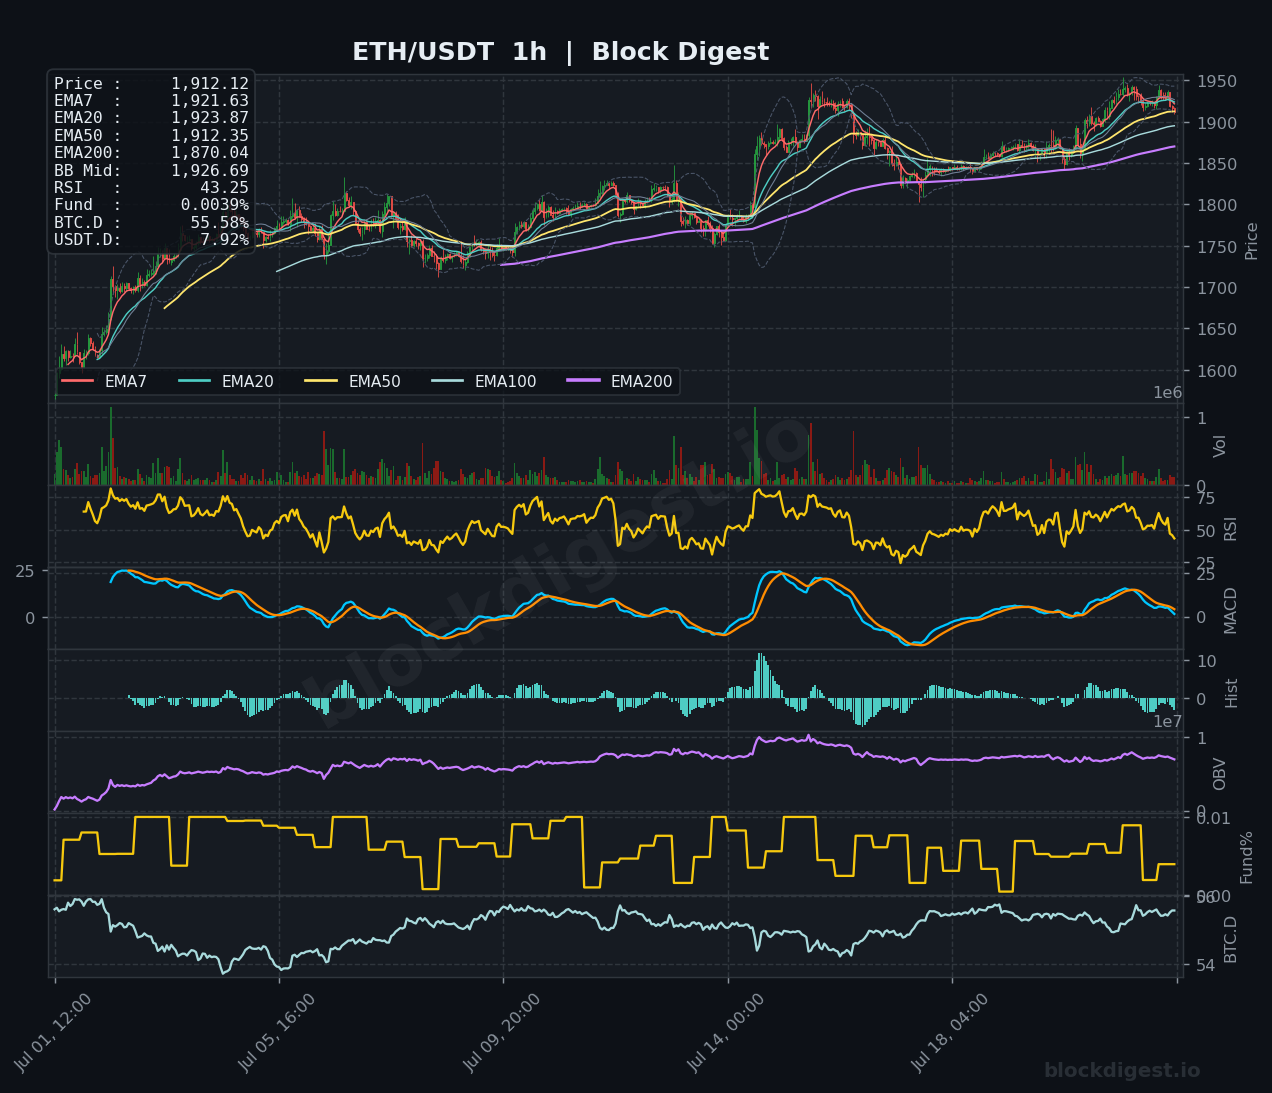
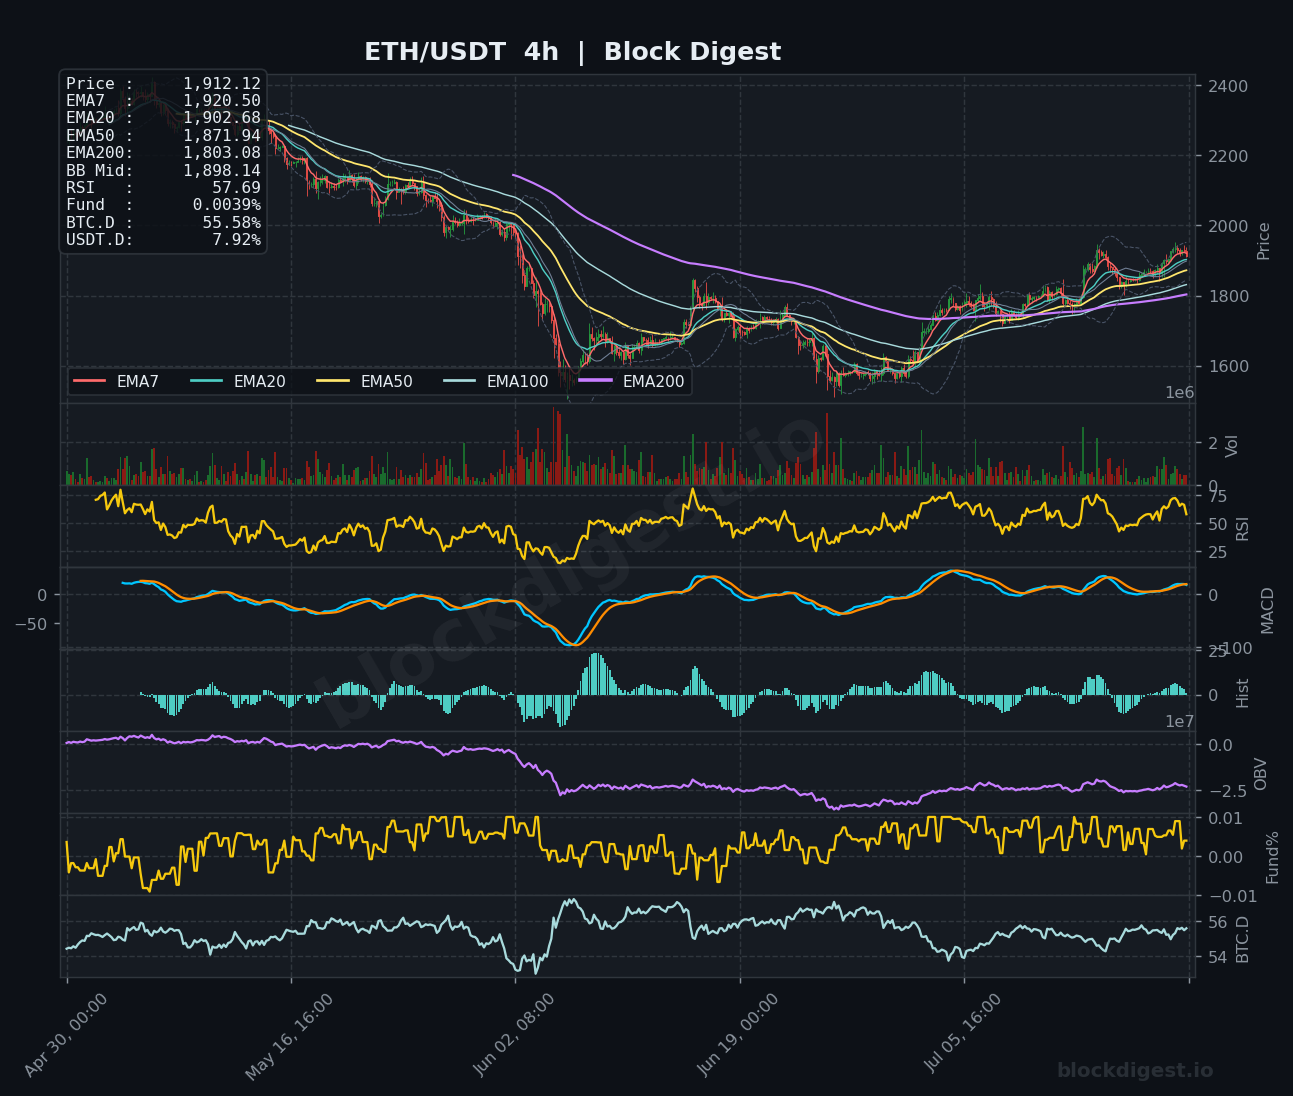
On the 4-hour chart, the EMA structure is turning constructive: price is above EMA7 ($1,920.50), EMA20 ($1,902.68), and EMA50 ($1,871.94), with the 4H BB midline at $1,898.14 now acting as near-term support. The 1-hour chart presents a slightly softer picture — price at $1,912.12 has slipped below the 1H EMA7 ($1,921.63) and EMA20 ($1,923.87), suggesting intraday exhaustion after the recent push toward $1,940–$1,950. Across all three timeframes, the $1,870–$1,900 zone represents a dense cluster of EMA confluence, making it the pivotal near-term support that bulls must defend. Short-term momentum is mildly corrective against the higher-timeframe recovery trend, pointing to a potential consolidation phase before the next directional move.
Key Levels to Watch
- Resistance: $1,940–$1,950 — recent intraday swing high visible on the 1H chart and aligns with the upper Bollinger Band compression zone; first meaningful ceiling to clear.
- Resistance: $2,000 — a major psychological level and area of prior consolidation visible on the 4H chart; reclaiming this would mark a significant structural shift.
- Resistance: $2,187 — the daily EMA200, the dominant overhead barrier that has capped every recovery attempt in the current macro downtrend.
- Support: $1,895–$1,902 — 4H EMA20 and BB midline cluster; immediate floor on any near-term pullback.
- Support: $1,870–$1,872 — 4H EMA50 and 1H EMA200 ($1,870.04) confluence; loss of this zone would materially weaken the near-term recovery thesis.
- Support: $1,800–$1,803 — 4H EMA200 and prior range support; a test here would indicate the rally has fully stalled.
Momentum & On-Chain Signals
The daily RSI sits at 61.97, confirming recovering momentum without yet entering overbought territory, while the 4H RSI at 57.69 is similarly constructive and has room to extend. The 1H RSI at 43.25 reflects the current short-term pullback and suggests intraday bears hold a slight edge in the immediate term. On the MACD, the 4H histogram remains positive and the signal line is in bullish territory, though the daily MACD lines are only just beginning to converge above zero after a prolonged bearish cross — still early-stage. Block Digest’s BD Pulse Score of 61/100 aligns with the bullish recovery narrative, but the BD Extreme Index reading of +1.28σ flags that ETH is approaching overbought conditions on shorter timeframes, warranting caution on new long entries at current levels. The OBV on the 1H has been trending upward through the recovery, offering mild accumulation confirmation, though the 4H OBV remains in negative territory — a reminder that the broader distribution cycle has not yet been fully reversed.
BTC Dominance & Market Sentiment
BTC dominance sits at 55.56%, holding near multi-month highs, which historically limits aggressive altcoin outperformance — ETH included. While the broader risk-on tone (supported by two consecutive weeks of positive Bitcoin ETF inflows and correlation with the Nasdaq-100 rally) is lifting all boats, sustained ETH upside will likely require BTC.D to roll over from current levels. USDT.D at 7.92% reflects a moderate but not extreme degree of cash on the sidelines, meaning there is potential dry powder available should sentiment shift more decisively toward risk assets.
Risk Scenarios
- Bullish case: A clean hourly close back above $1,930 reclaiming the 1H EMA cluster, followed by consolidation above $1,900–$1,902 on a retest, would set up a push toward the $1,940–$1,950 resistance and open the door to a test of $2,000.
- Bearish case: Failure to hold the $1,895–$1,902 support zone on the current intraday pullback, combined with a 4H candle close beneath $1,870, would signal the recovery rally has exhausted and bring the $1,803–$1,800 EMA200/4H support zone back into play.
Outlook
ETH’s near-term bias is cautiously bullish, but the setup demands patience — the asset is consolidating just beneath a key short-term resistance cluster after a strong recovery from the summer lows, and the BD Extreme Index reading of +1.28σ suggests the easy momentum money from the latest leg up may already be priced in. The critical triggers to watch over the next 24–48 hours are whether bulls can reclaim and hold above $1,930 on the hourly timeframe and whether the broader market risk appetite — currently supported by BTC ETF inflows and macro tailwinds — continues to hold amid ongoing U.S.-Iran war uncertainty. A failure of the $1,870 EMA confluence would invalidate the short-term bullish structure, while a decisive daily close above $1,950 would significantly improve the probability of a run toward the psychologically important $2,000 level. The macro backdrop remains a recovery-within-a-downtrend narrative until ETH can mount a credible challenge of the daily EMA200 at $2,187.
Disclaimer: This analysis is for informational purposes only and does not constitute financial advice. Cryptocurrency markets are highly volatile and unpredictable. All trading decisions should be made based on your own research and risk tolerance. Block Digest is not responsible for any financial losses incurred as a result of acting on this content.