BTC Daily Analysis — 2026-07-23 (Full Archive)
Market Overview
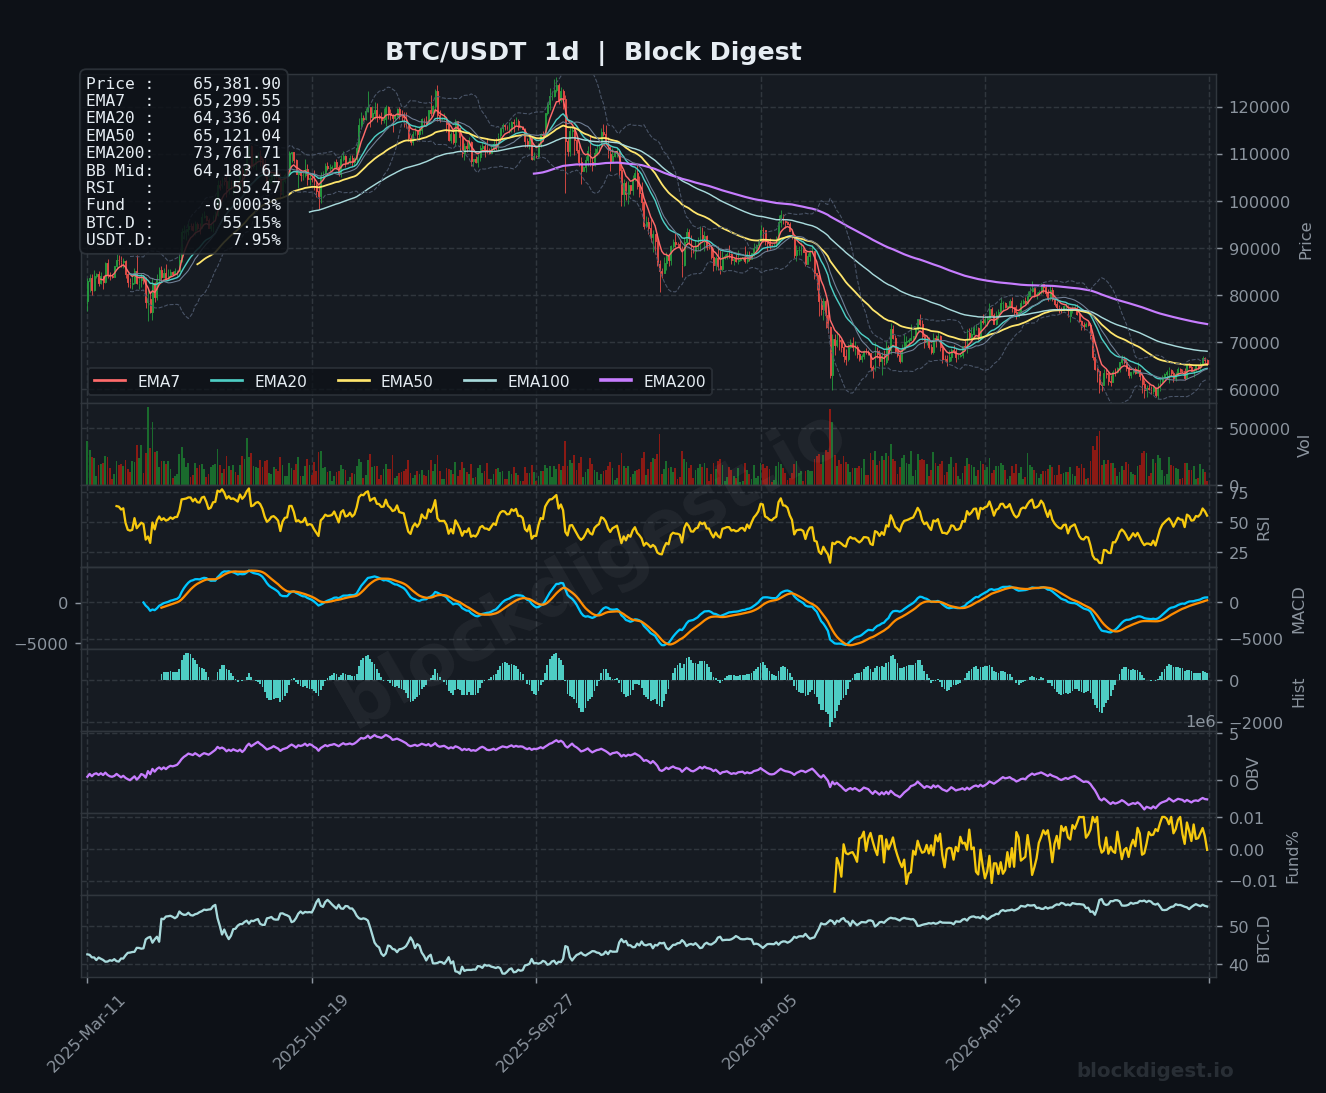
Bitcoin is trading at approximately $65,382 as of July 23, 2026, pulling back roughly 1% after touching a seven-week high near $67,000 earlier this week. On the daily timeframe, price has reclaimed the EMA7 ($65,300) and EMA50 ($65,121), a constructive structural shift following the extended correction from the all-time high region. However, BTC remains well beneath its daily EMA200 ($73,762), confirming the broader macro trend is still in recovery mode rather than a full bull resumption. Price is currently pressing against the Bollinger Band midline at $64,184, and the daily upper band has been tested but not convincingly broken, suggesting the near-term rally is losing some steam.
Multi-Timeframe Confluence
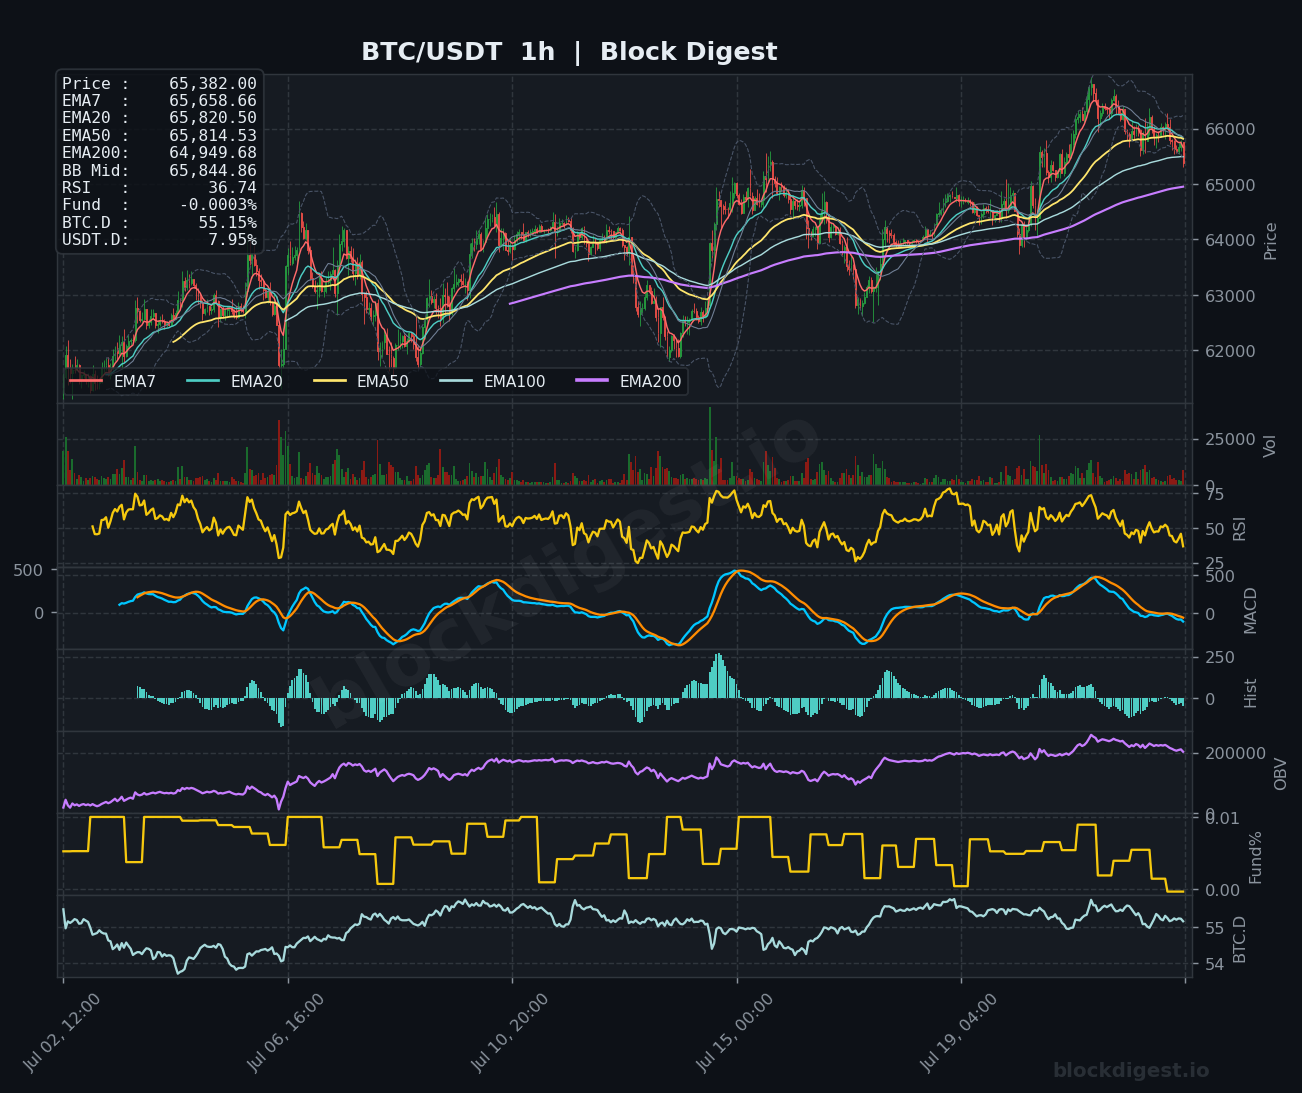
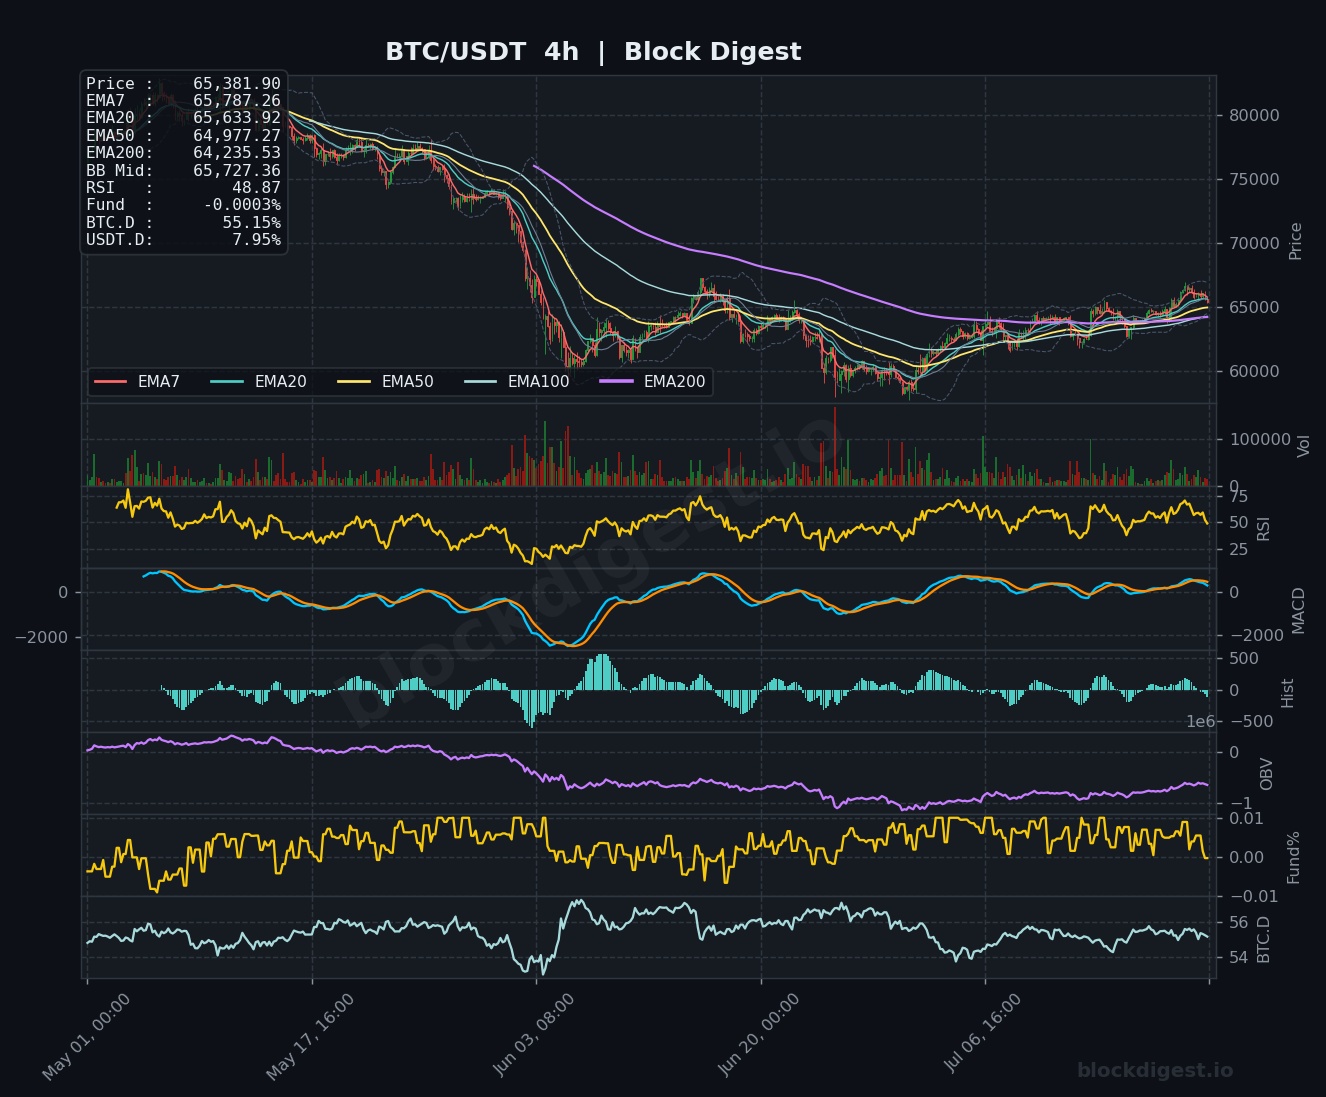
On the 1-hour chart, price has slipped below the EMA7 ($65,659), EMA20 ($65,821), and EMA50 ($65,815), all of which are now acting as a layered resistance cluster between $65,650 and $65,850 — a short-term bearish development. The 4-hour chart tells a more nuanced story: price is hovering just beneath the EMA7 ($65,787) and EMA20 ($65,634), with the EMA50 ($64,977) providing a meaningful higher-timeframe support shelf below. The daily chart, meanwhile, remains constructively above key short-term EMAs, meaning the intraday weakness is best read as a pullback within a recovering trend rather than a structural reversal.
Key Levels to Watch
- Resistance: $65,800–$65,850 — confluent 1h EMA20/EMA50 cluster and the 4h EMA7; this zone needs to be reclaimed for bullish momentum to reassert itself
- Resistance: $66,500–$67,000 — the recent swing high and weekly resistance area where selling pressure resurfaced following the US crypto legislation optimism rally
- Resistance: $73,762 — the daily EMA200, representing the defining macro overhead barrier for a full trend reversal
- Support: $64,977–$65,121 — the 4h EMA50 and daily EMA50 form a critical confluence zone; losing this area would shift the intermediate-term outlook negative
- Support: $64,184 — the daily Bollinger Band midline, a level that has repeatedly acted as pivot support during this recovery phase
- Support: $62,500–$63,000 — the prior consolidation base and a key demand zone where buyers emerged strongly in recent weeks
Momentum & On-Chain Signals
The 1-hour RSI has declined to 36.74, approaching oversold territory and hinting that the immediate selling pressure may be nearing exhaustion. On the daily timeframe, the RSI sits at 55.47, consistent with our BD Pulse score of 63/100 — broadly bullish but not overextended on the higher timeframe. The daily MACD shows the signal line and MACD line converging near the zero axis with a modestly positive histogram, suggesting momentum is building but fragile. Notably, our BD Extreme Index reading of +1.32σ flags a mild overbought condition at the macro level, which aligns with the stalling action seen after the $67,000 test — caution is warranted on aggressive long entries at current levels.
BTC Dominance & Market Sentiment
BTC dominance sits at 55.15%, a multi-month high that reflects continued capital concentration in Bitcoin relative to altcoins. USDT.D at 7.95% remains elevated, indicating a meaningful portion of market participants are still holding stablecoins on the sidelines rather than rotating aggressively into risk assets. Together, these readings suggest the market is in a cautious accumulation phase for BTC specifically, with broader altcoin rotation not yet underway — a dynamic that could amplify any Bitcoin breakout if dominance begins to compress.
Risk Scenarios
- Bullish case: A clean reclaim of the $65,800–$65,850 EMA cluster on the 1-hour chart, followed by a daily close above $66,500, would re-open the path toward the $67,000–$68,500 range and suggest the recent pullback was a healthy consolidation. Continued positive momentum from US crypto legislation and reduced exchange inflows would further support this scenario.
- Bearish case: A decisive 4-hour close below the $64,977–$65,121 confluence zone would likely trigger accelerated selling toward the $63,000 support area, and a break of that level would raise the prospect of retesting the $62,000–$61,500 demand zone.
Outlook
The directional bias remains cautiously constructive on the intermediate timeframe, but the short-term picture has softened following the failed attempt to sustain above $67,000. The key trigger to watch over the next 24–48 hours is whether BTC can reclaim the 1h EMA cluster at $65,800 with conviction — that would restore the bullish short-term structure. Equally important is whether the daily EMA50 at $65,121 holds as support on any further dips, as a sustained close below that level would challenge the recovery narrative. Until BTC resolves this EMA compression zone with a directional break, rangebound chop between approximately $64,200 and $66,500 remains the path of least resistance.
—
Disclaimer: This analysis is for informational purposes only and does not constitute financial advice. Cryptocurrency markets are highly volatile and unpredictable. All trading decisions should be made based on your own research and risk tolerance. Block Digest is not responsible for any financial losses incurred as a result of acting on this content.