Bitcoin Daily Analysis: Bitcoin stabilizes below EMA50 after multi-month decline
Market Overview
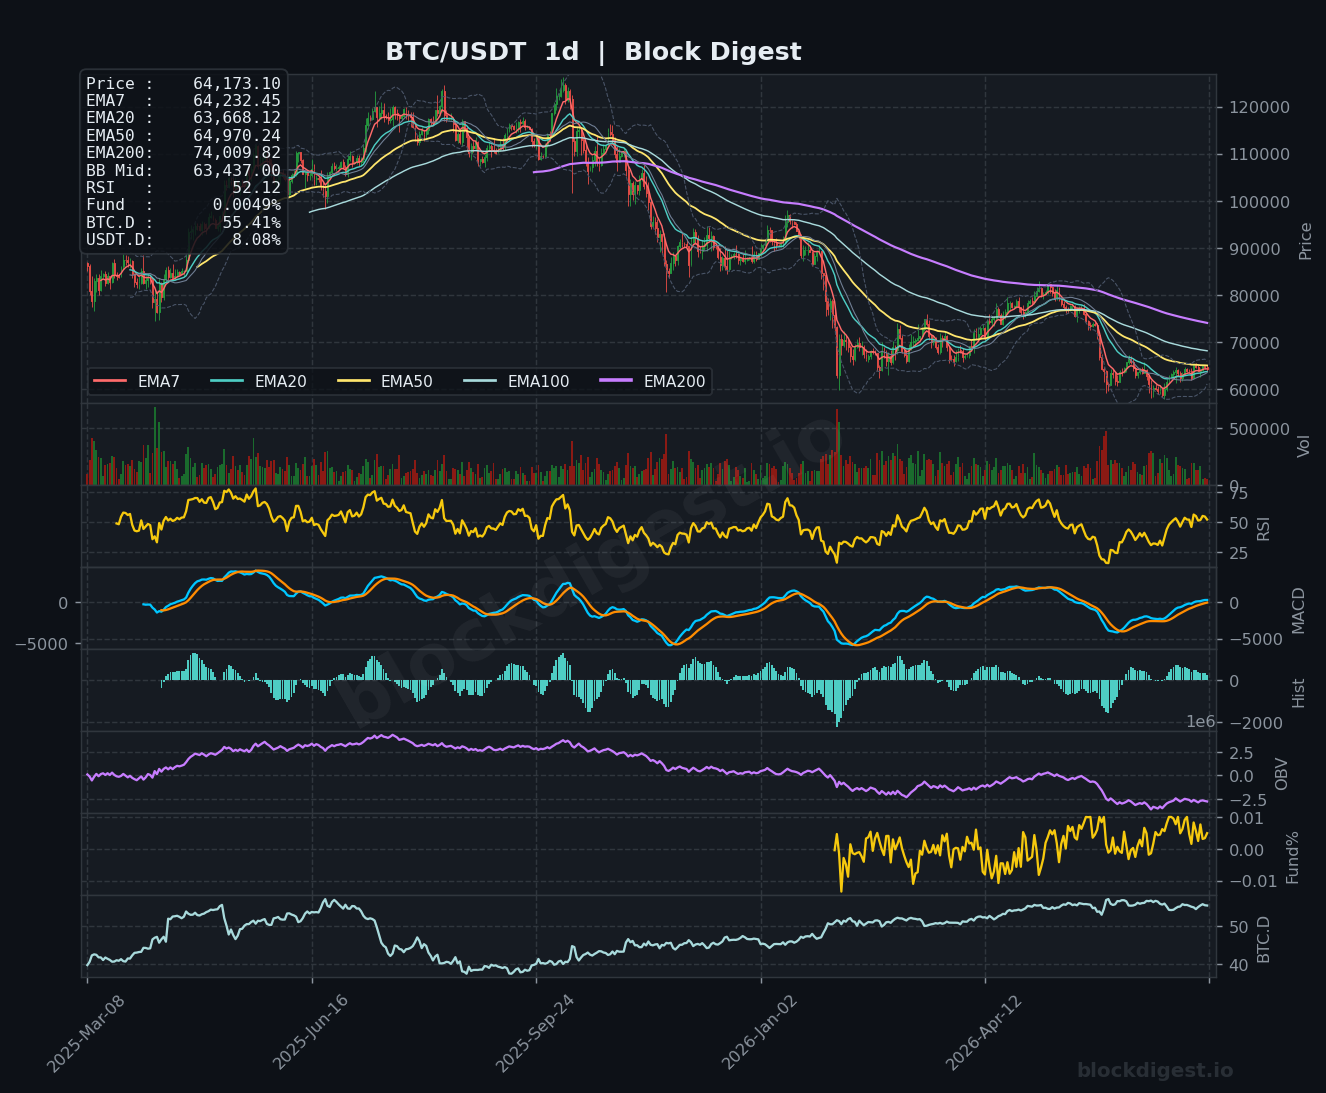
Bitcoin is trading at $64,180 as of July 20, 2026, navigating a structurally delicate zone as it attempts to stabilize following a prolonged multi-month downtrend from highs above $100,000. On the daily timeframe, price sits just below the EMA50 ($64,970) while holding marginally above the EMA7 ($64,232) and EMA20 ($63,668), suggesting the market is in a tentative recovery phase rather than a confirmed trend reversal. The Bollinger Band midline on the daily sits at $63,437, and price trading above it offers a modest constructive signal, though the EMA200 at $74,009 remains a towering overhead obstacle that underscores the dominant macro bearish structure. The broader picture is one of a market searching for direction within a compressed range, consistent with the 0.89% 24-hour decline reported today.
Multi-Timeframe Confluence
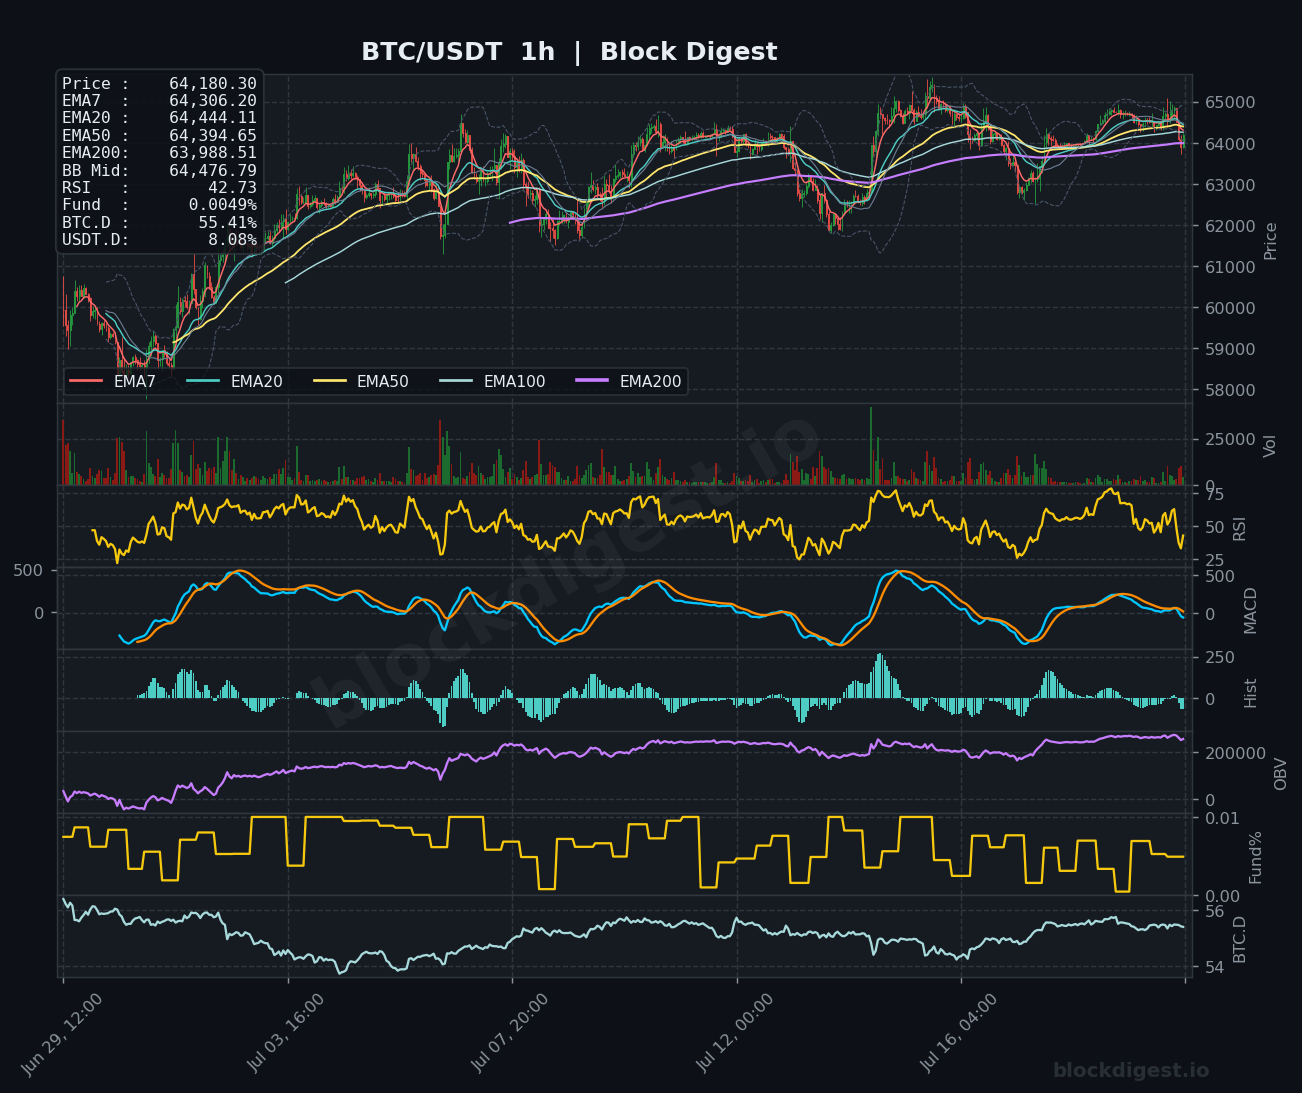
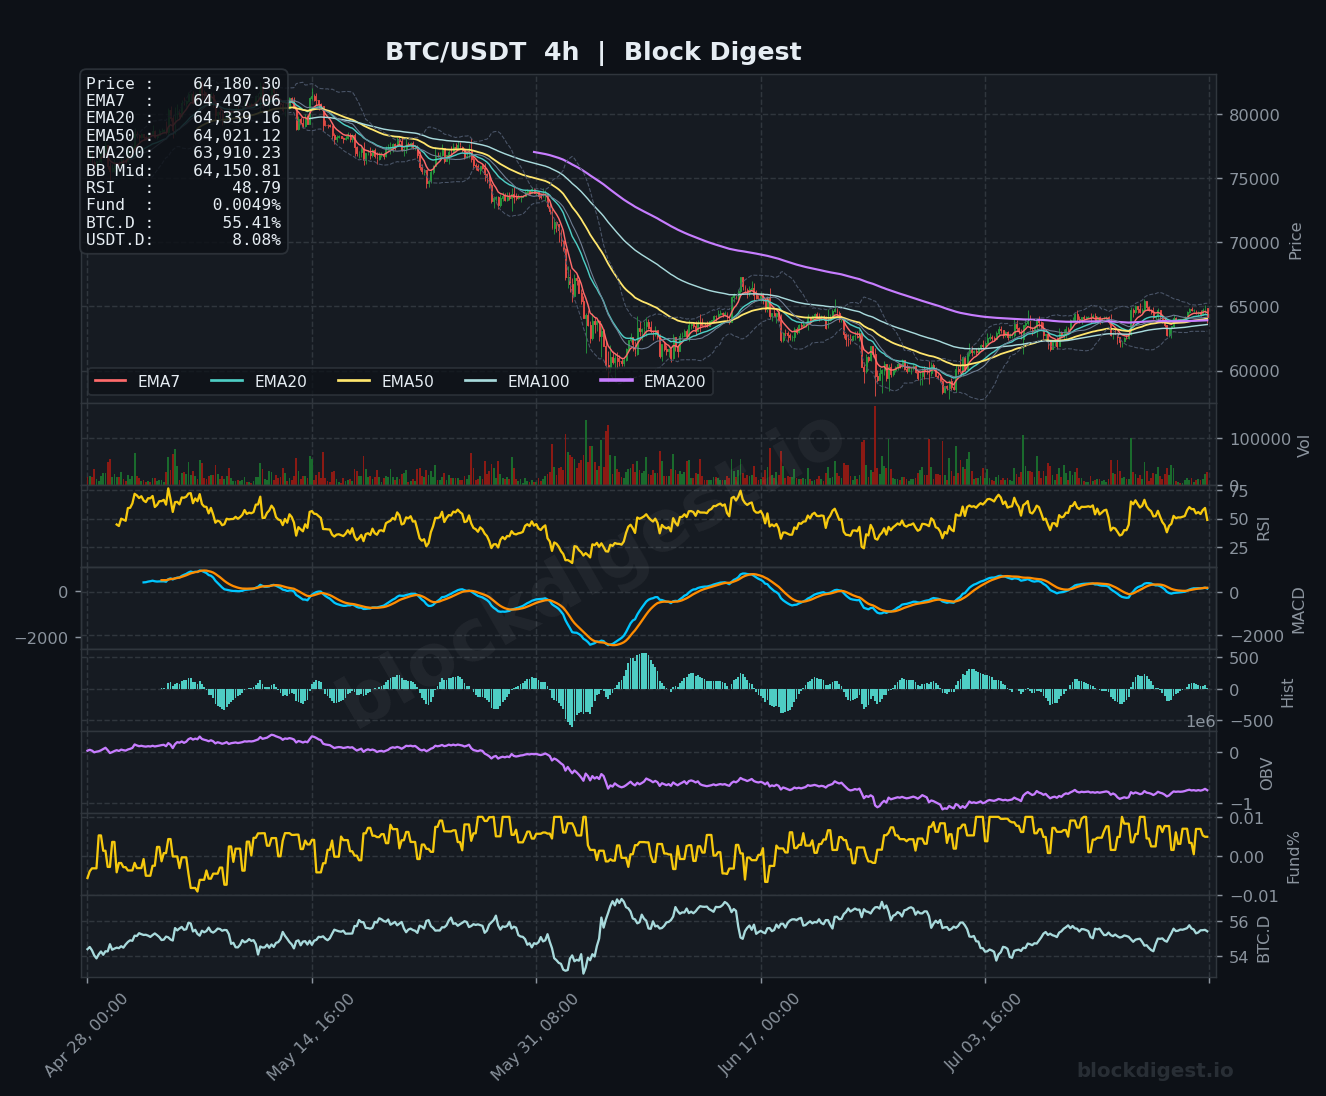
On the 1-hour chart, price at $64,180 sits below the EMA7 ($64,306), EMA20 ($64,444), and EMA50 ($64,394), indicating short-term bearish momentum as bulls struggle to reclaim intraday moving averages. The 4-hour chart presents a mixed picture: EMAs are in tight compression between $63,910 (EMA200) and $64,497 (EMA7), with price oscillating just below the upper cluster — a zone where rejection risk remains elevated. The daily timeframe shows the clearest recovery attempt, with price reclaiming the EMA7 and EMA20 from below in recent sessions, though the EMA50 at $64,970 has capped advances and continues to act as the key battleground. All three timeframes converge around the $63,900–$64,500 band as the decisive near-term pivot region.
Key Levels to Watch
- Resistance: $64,970 — the daily EMA50, which has consistently rejected upside attempts and represents the most critical short-term barrier to recovery; $65,500 — recent intraday swing high visible on the 1-hour chart where sellers stepped in with force; $67,000–$68,000 — a broader consolidation zone from prior price action that would need to be reclaimed to shift the intermediate-term bias bullish.
- Support: $63,437 — the daily Bollinger Band midline, a loss of which would expose the lower band and signal renewed selling pressure; $63,000 — a psychologically significant round number that aligns with recent swing lows on the 4-hour chart; $61,500–$62,000 — deeper structural support where the market previously found demand during the recovery phase off the cycle lows.
Momentum & On-Chain Signals
The daily RSI sits at 52.18 per our BD Pulse data, firmly in neutral territory and consistent with the 1-hour chart reading of 42.73 — which is drifting toward oversold conditions on the shorter timeframe, suggesting intraday sellers currently have the edge. The 4-hour MACD shows the signal and MACD lines converging near zero, with the histogram printing small positive bars, hinting at a potential momentum shift that has yet to gather conviction. Notably, our BD Pulse OBV trend registers at -1, indicating ongoing distribution pressure beneath the surface — a cautionary signal that volume is not yet confirming price stabilization. The funding rate of +0.0057% is mildly positive, reflecting a slight long bias in perpetuals without the excess leverage that typically precedes sharp corrections.
BTC Dominance & Market Sentiment
BTC dominance sits at 55.38% according to our BD Pulse readings, a level that reflects Bitcoin’s continued relative strength over altcoins during a period of macro uncertainty, though the 4-hour chart shows dominance has been gradually trending lower from recent highs near 56%, suggesting some tentative rotation beginning to occur. USDT dominance at 8.08% remains elevated, indicating a meaningful portion of the market is still sitting in cash — a dynamic that could act as dry powder for a bullish catalyst but also signals lingering risk-off positioning that is capping upside enthusiasm.
Risk Scenarios
- Bullish case: A decisive hourly close above $64,970 (daily EMA50), accompanied by improving OBV and a funding rate that remains measured, would validate the recovery attempt and open a path toward $67,000–$68,000. Large trader positioning toward a $72,000 target by month-end would gain credibility if the upcoming Fed meeting delivers a dovish tone.
- Bearish case: A breakdown below the $63,437 daily BB midline, particularly on elevated volume, would signal that the recovery has stalled and bring $61,500–$62,000 back into focus. Continued ETF inflow weakness combined with macro headwinds from AI sector volatility and oil price movements could accelerate selling pressure into that support zone.
Outlook
The directional bias for the next 24–48 hours is cautiously neutral with a slight bearish lean in the very short term, given the 1-hour EMA stack sitting above price and the BD Pulse BD Extreme Index at a benign +0.79σ — not signaling panic, but not signaling conviction either. The $64,970 EMA50 on the daily remains the thesis-defining level: bulls need to reclaim and hold it to keep the recovery narrative intact, while bears need a clean break below $63,437 to resume control. Traders should monitor the Long/Short account ratio, currently at 1.45 (59.2% longs), as any sharp deleveraging of that crowded long positioning could accelerate downside moves. The Fed meeting at month-end looms as a critical macro catalyst that could ultimately determine whether Bitcoin tests the $67,000–$72,000 range or revisits deeper support.
Disclaimer: This analysis is for informational purposes only and does not constitute financial advice. Cryptocurrency markets are highly volatile and unpredictable. All trading decisions should be made based on your own research and risk tolerance. Block Digest is not responsible for any financial losses incurred as a result of acting on this content.