Ethereum Daily Analysis: ETH at $1,676 Faces Major EMA Resistance Levels
Market Overview
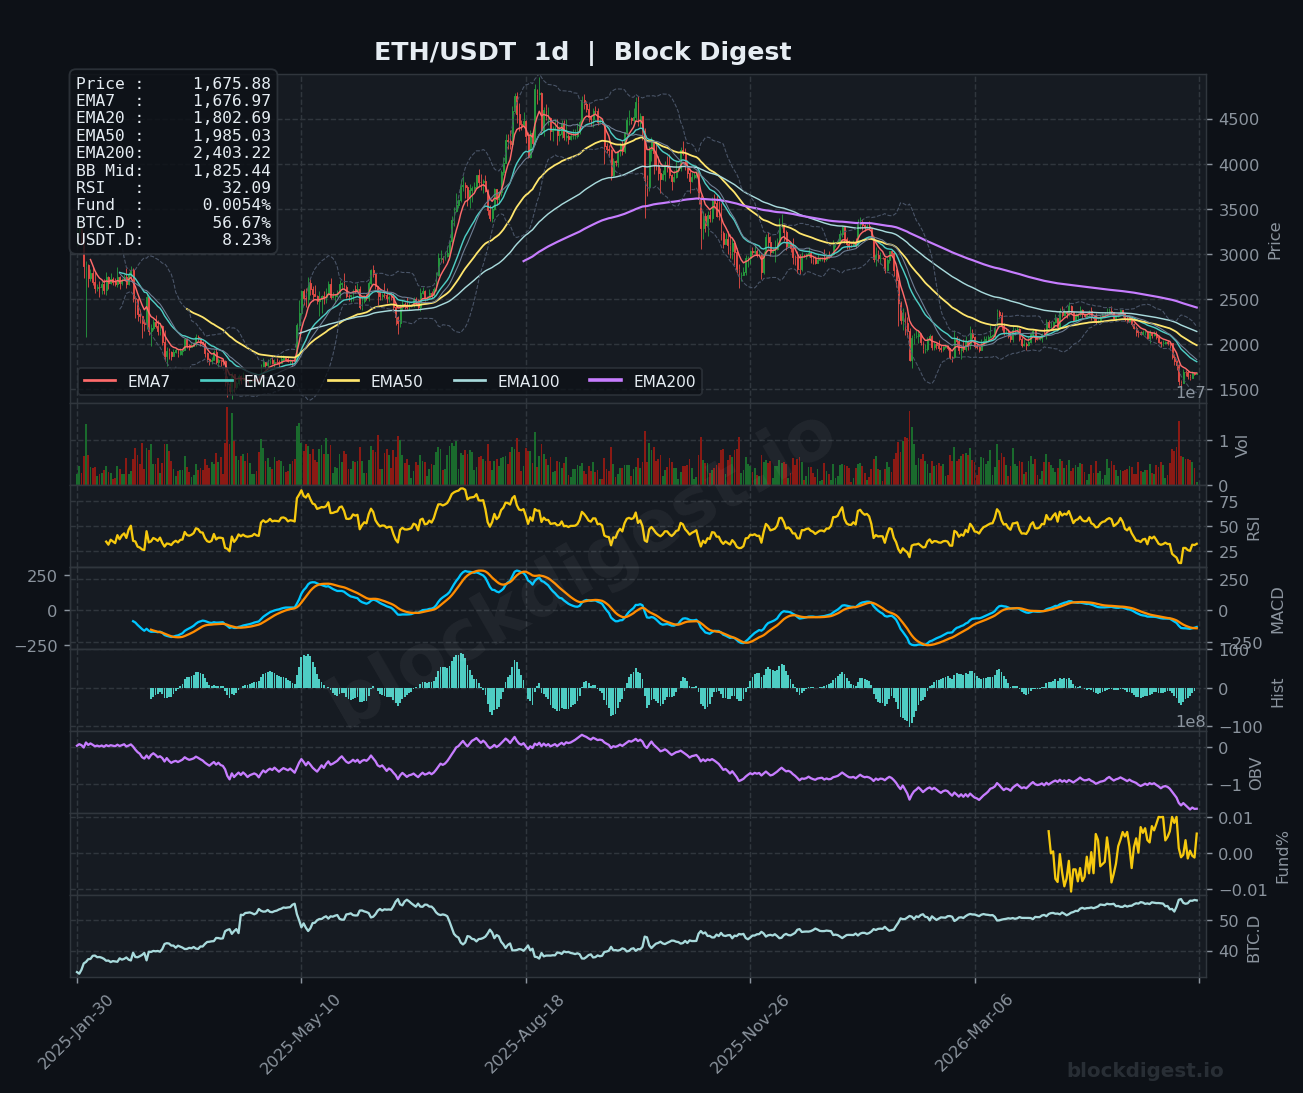
ETH/USDT is currently trading at $1,676.21, attempting a modest recovery after an extended downtrend that pushed prices from above $2,000 to multi-month lows near the $1,550–$1,580 range. On the daily timeframe, price remains deeply below all major EMAs — the EMA20 sits at $1,802.69, EMA50 at $1,985.03, and the EMA200 at a distant $2,403.22 — confirming a structurally bearish market environment. Price is hugging the lower Bollinger Band on the daily chart, with the BB midline at $1,825.44 acting as a significant overhead obstacle. The dominant daily trend remains unambiguously bearish, and any current bounce should be treated as a potential relief rally within a larger downtrend until proven otherwise.
Multi-Timeframe Confluence
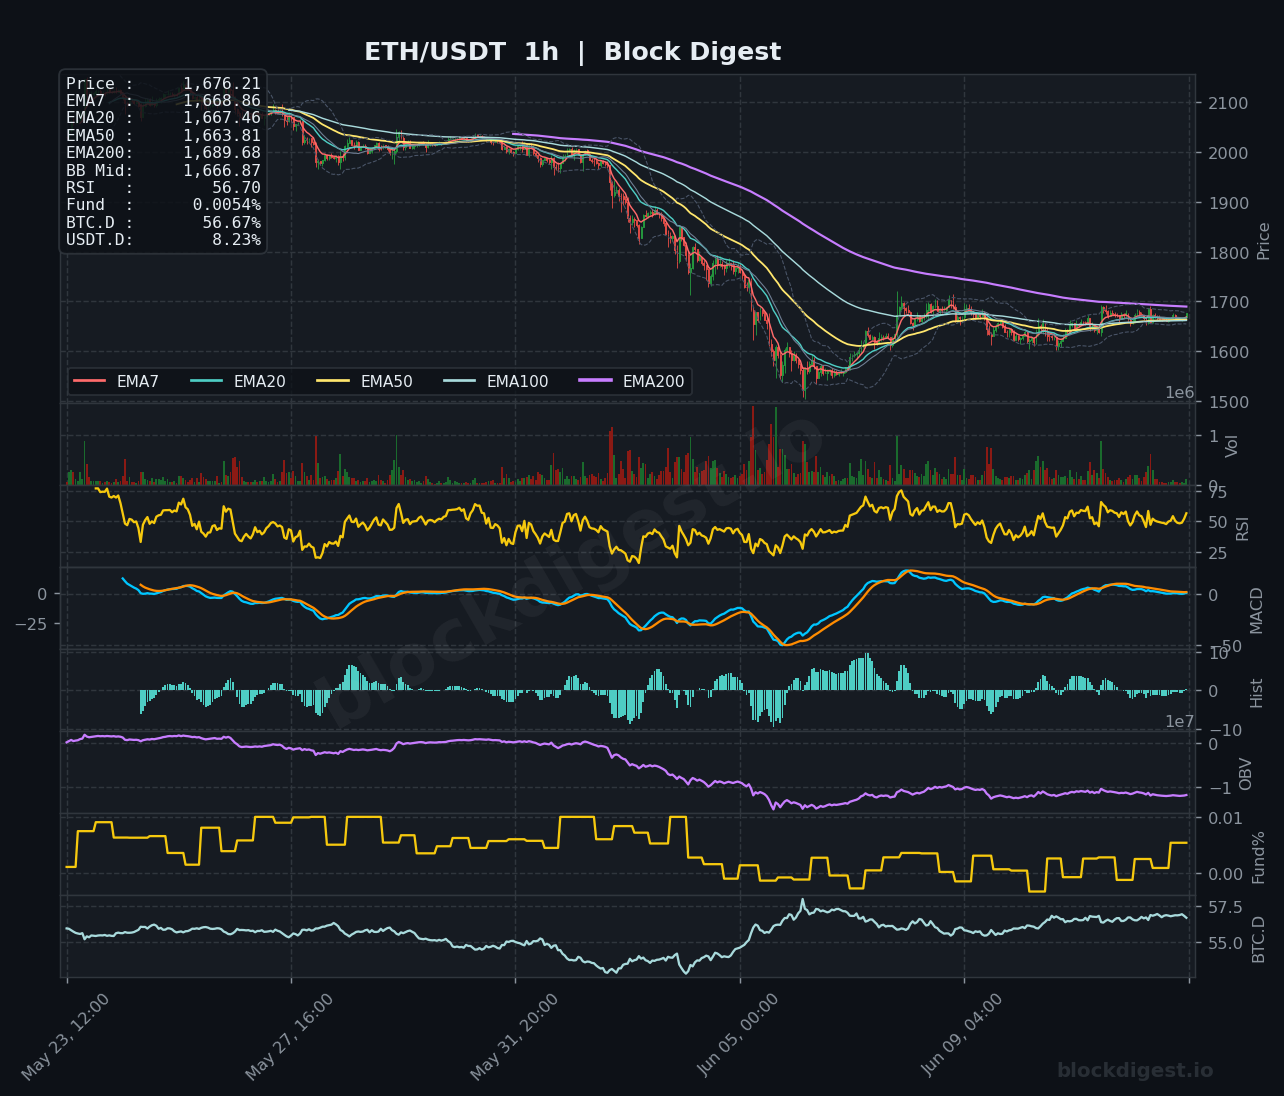
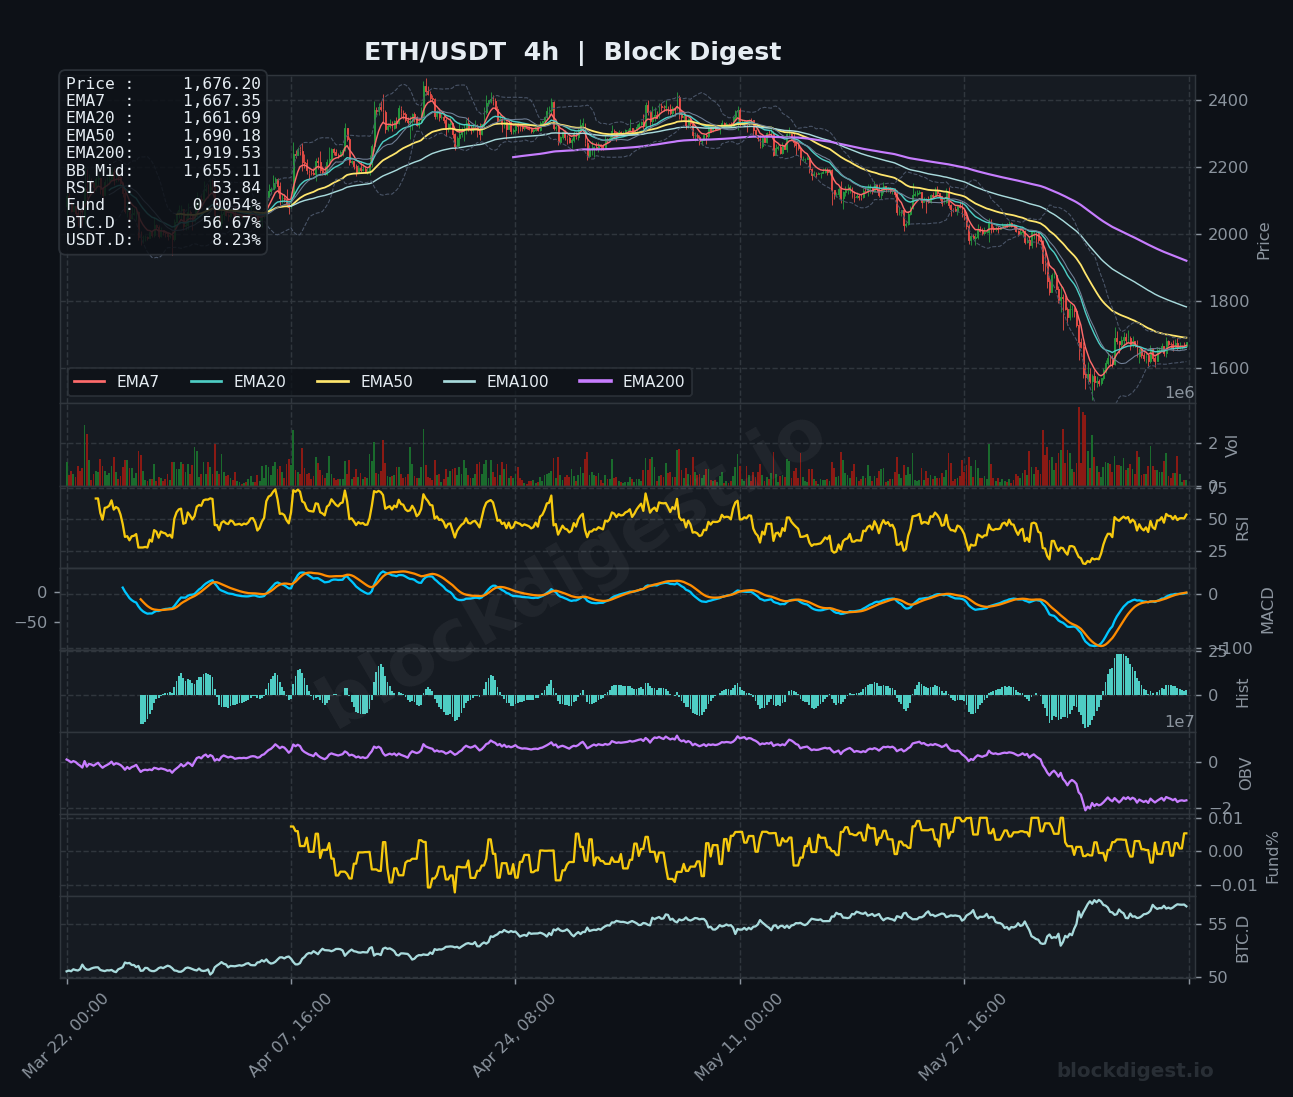
On the 1-hour chart, ETH has managed to reclaim its short-term EMAs, with price trading above EMA7 ($1,668.86), EMA20 ($1,667.46), and EMA50 ($1,663.81), suggesting near-term bullish momentum building from the recent lows. However, the 1-hour EMA200 at $1,689.68 presents an immediate resistance hurdle that price has yet to convincingly clear. The 4-hour chart tells a more cautious story — price is consolidating just above EMA7 ($1,667.35) and EMA20 ($1,661.69), but remains well beneath the 4h EMA50 at $1,690.18 and the EMA200 at $1,919.53, reflecting the persistent macro bearish structure. Short-term momentum marginally supports a continuation of the bounce, but the higher timeframe trend strongly caps upside potential in the near term.
Key Levels to Watch
- Resistance: $1,689–$1,690 — Confluence of the 1h EMA200 and 4h EMA50; a sustained close above here would be an early positive signal
- Resistance: $1,750–$1,760 — Prior consolidation zone and psychological round number that capped multiple recovery attempts during the recent decline
- Resistance: $1,802–$1,825 — Daily EMA20 and BB midline; reclaiming this zone would represent a meaningful structural shift
- Support: $1,650–$1,655 — Near-term intraday support aligning with the 4h BB midline at $1,655.11 and recent price consolidation
- Support: $1,600–$1,610 — Psychological support and a key cluster from the recent capitulation wick lows
- Support: $1,550–$1,560 — Multi-month structural low; a breach of this level would signal accelerated selling pressure and open the door to sub-$1,500 territory
Momentum & On-Chain Signals
The RSI readings reveal a notable divergence across timeframes: the 1-hour RSI sits at 56.70 (neutral-to-bullish), the 4-hour RSI reads 53.84 (neutral), while the daily RSI has collapsed to an oversold-adjacent 32.09 — approaching levels historically associated with meaningful bottoms, though not yet confirming one. On the 4-hour MACD, the signal line and MACD line are converging near the zero line after a deep trough, with histogram bars beginning to flip positive — a tentative bullish crossover is forming but lacks conviction. OBV on both the 4h and daily charts continues to trend lower, indicating that distribution has outpaced accumulation throughout the decline and that the current price bounce has not yet attracted sufficient buying volume to confirm a trend reversal. The funding rate at +0.0054% is modestly positive but essentially neutral, suggesting the market is not overcrowded in either direction.
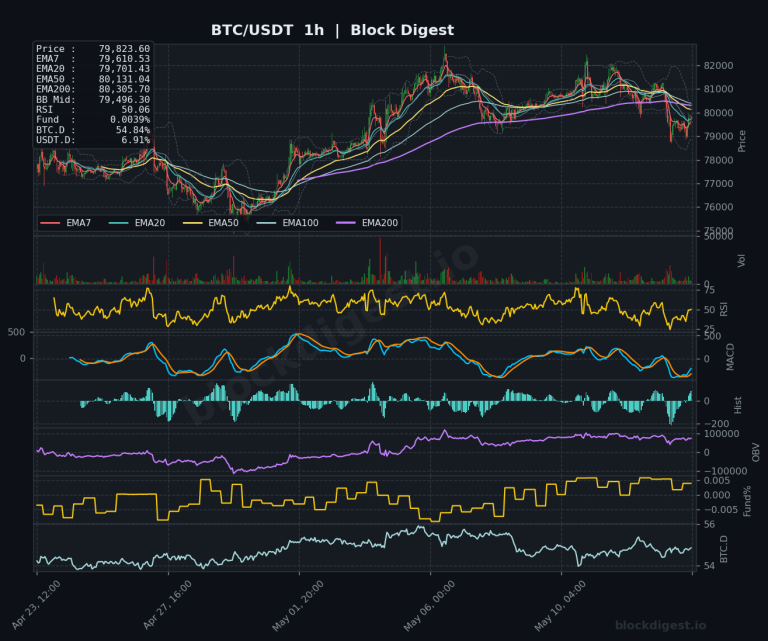
BTC Dominance & Market Sentiment
BTC dominance is elevated at 56.67%, reflecting a sustained rotation out of altcoins and into Bitcoin — a macro headwind for ETH specifically. USDT dominance at 8.23% indicates a meaningful portion of market participants remain in stablecoins, signaling risk-off positioning that has yet to fully rotate back into risk assets. Until BTC.D shows clear signs of peaking or declining, ETH is likely to continue underperforming on a relative basis, making outsized altcoin rallies difficult to sustain.
Risk Scenarios
- Bullish case: A confirmed daily close above $1,720–$1,750, accompanied by rising OBV and 4h MACD holding its bullish crossover, would suggest the worst of the selling is over and open a path toward the $1,802–$1,825 resistance cluster. Sustained BTC.D compression below 55% would further strengthen this scenario.
- Bearish case: A rejection at the $1,689–$1,690 EMA confluence zone followed by a 4h close below $1,640 would signal the relief rally is exhausting, risking a retest of the $1,550–$1,560 structural lows. A daily close beneath $1,550 would be a significant bearish development with limited technical support until the $1,400 region.
Outlook
The overall bias remains cautiously bearish on the higher timeframe, with ETH in a deep structural downtrend and trading well below all major daily EMAs. The near-term picture is modestly constructive — short-term EMAs are aligned bullishly on the 1-hour chart and the daily RSI approaching oversold territory may attract dip-buyers — but this appears more consistent with a counter-trend bounce than a confirmed reversal. The critical trigger to watch over the next 24–48 hours is whether ETH can sustain a break above the $1,689–$1,700 zone and close a 4-hour candle above the EMA50; failure there would quickly reintroduce downside risk. Traders should approach this setup with disciplined position sizing, as the macro structure firmly favors sellers until a meaningful reclaim of the $1,800+ range is achieved.
Disclaimer: This analysis is for informational purposes only and does not constitute financial advice. Cryptocurrency markets are highly volatile and unpredictable. All trading decisions should be made based on your own research and risk tolerance. Block Digest is not responsible for any financial losses incurred as a result of acting on this content.