Bitcoin Daily Analysis: BTC Below Key EMAs at $63,782
Market Overview
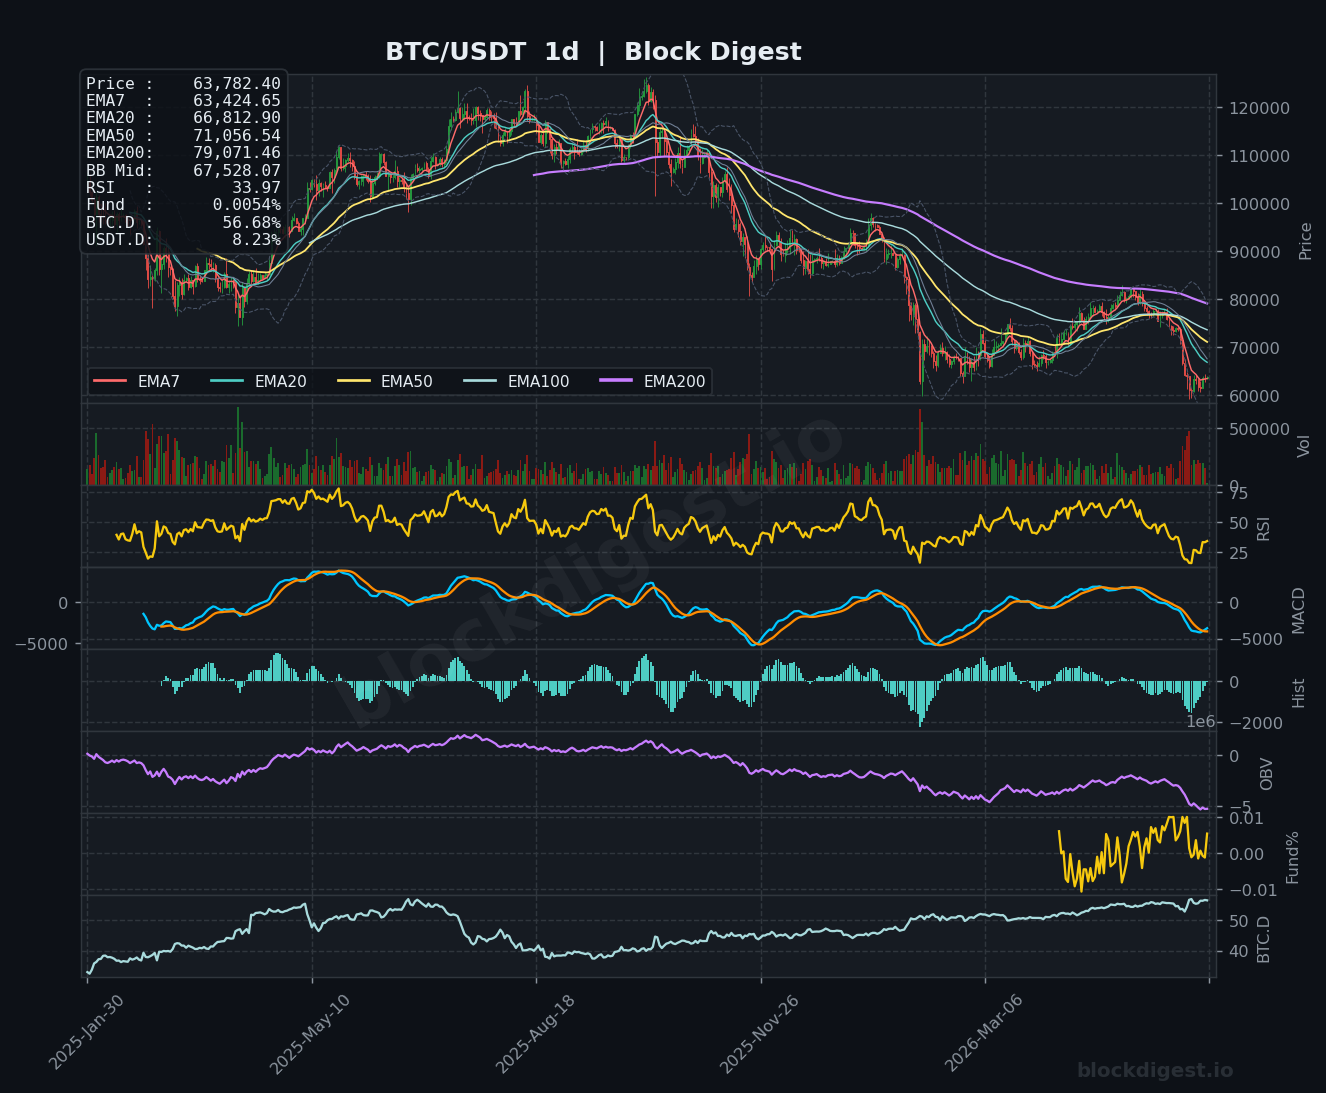
BTC/USDT is currently trading at approximately $63,782, sitting in a technically precarious position following an extended multi-week corrective decline from highs above $109,000. On the daily timeframe, price remains well below all major EMAs — the EMA20 at $66,812, EMA50 at $71,056, and EMA200 at $79,071 — confirming that the dominant trend on the higher timeframe is firmly bearish. Price is also trading beneath the Bollinger Band midline of $67,528, reflecting sustained selling pressure and a lack of bullish mean-reversion momentum. The recent stabilization near $63,000–$64,000 suggests an attempt at base-building, but structural resistance overhead remains heavy.
Multi-Timeframe Confluence
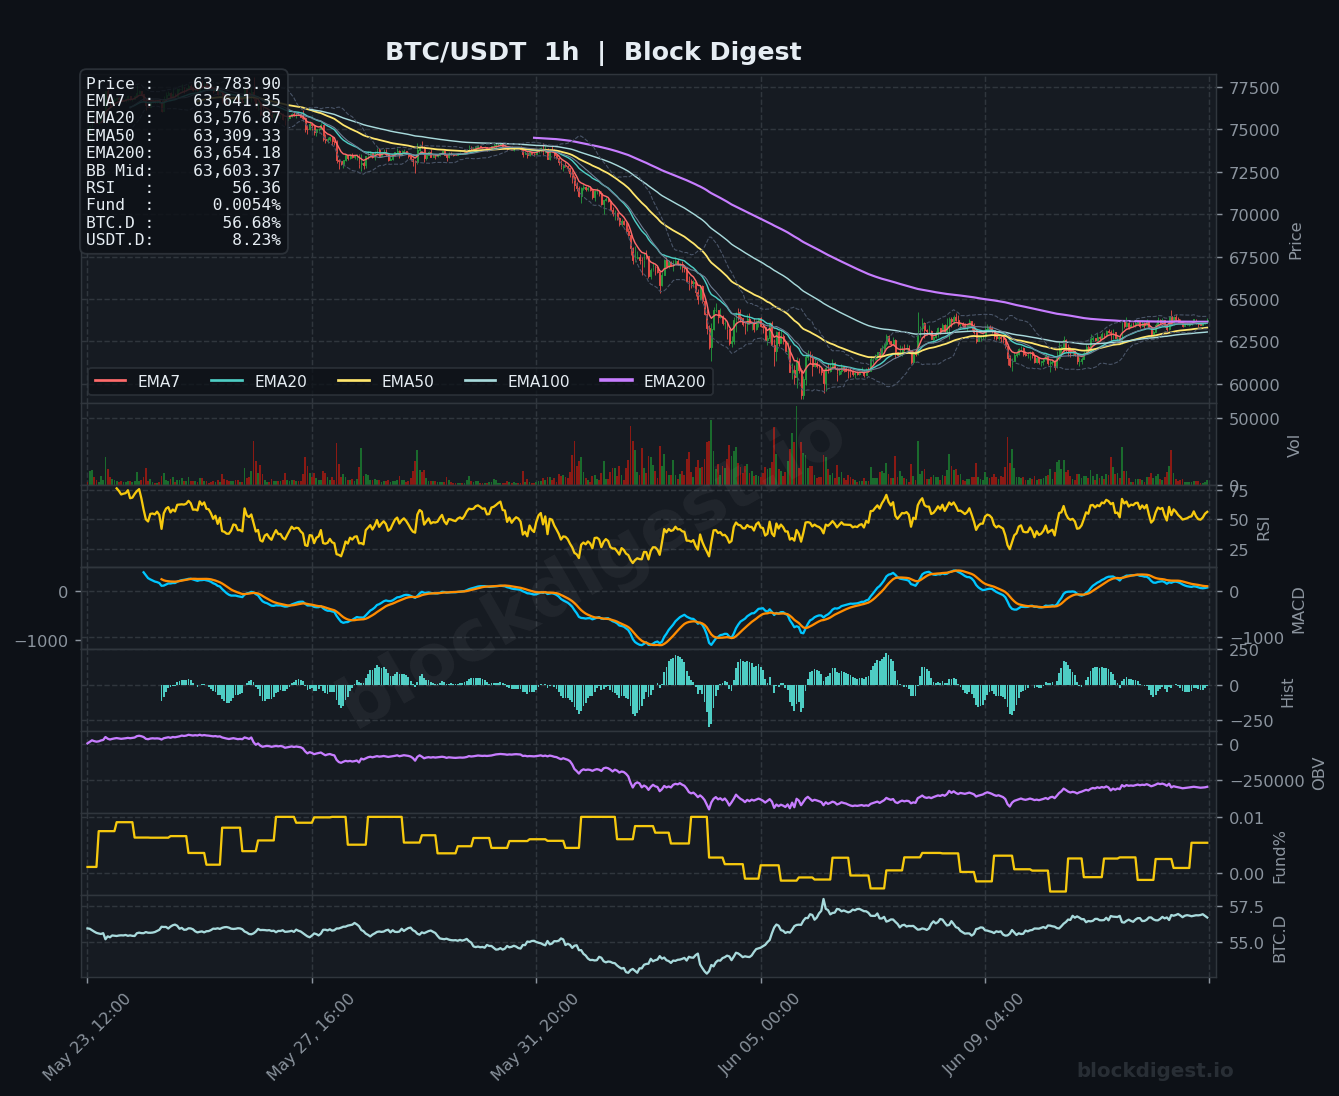
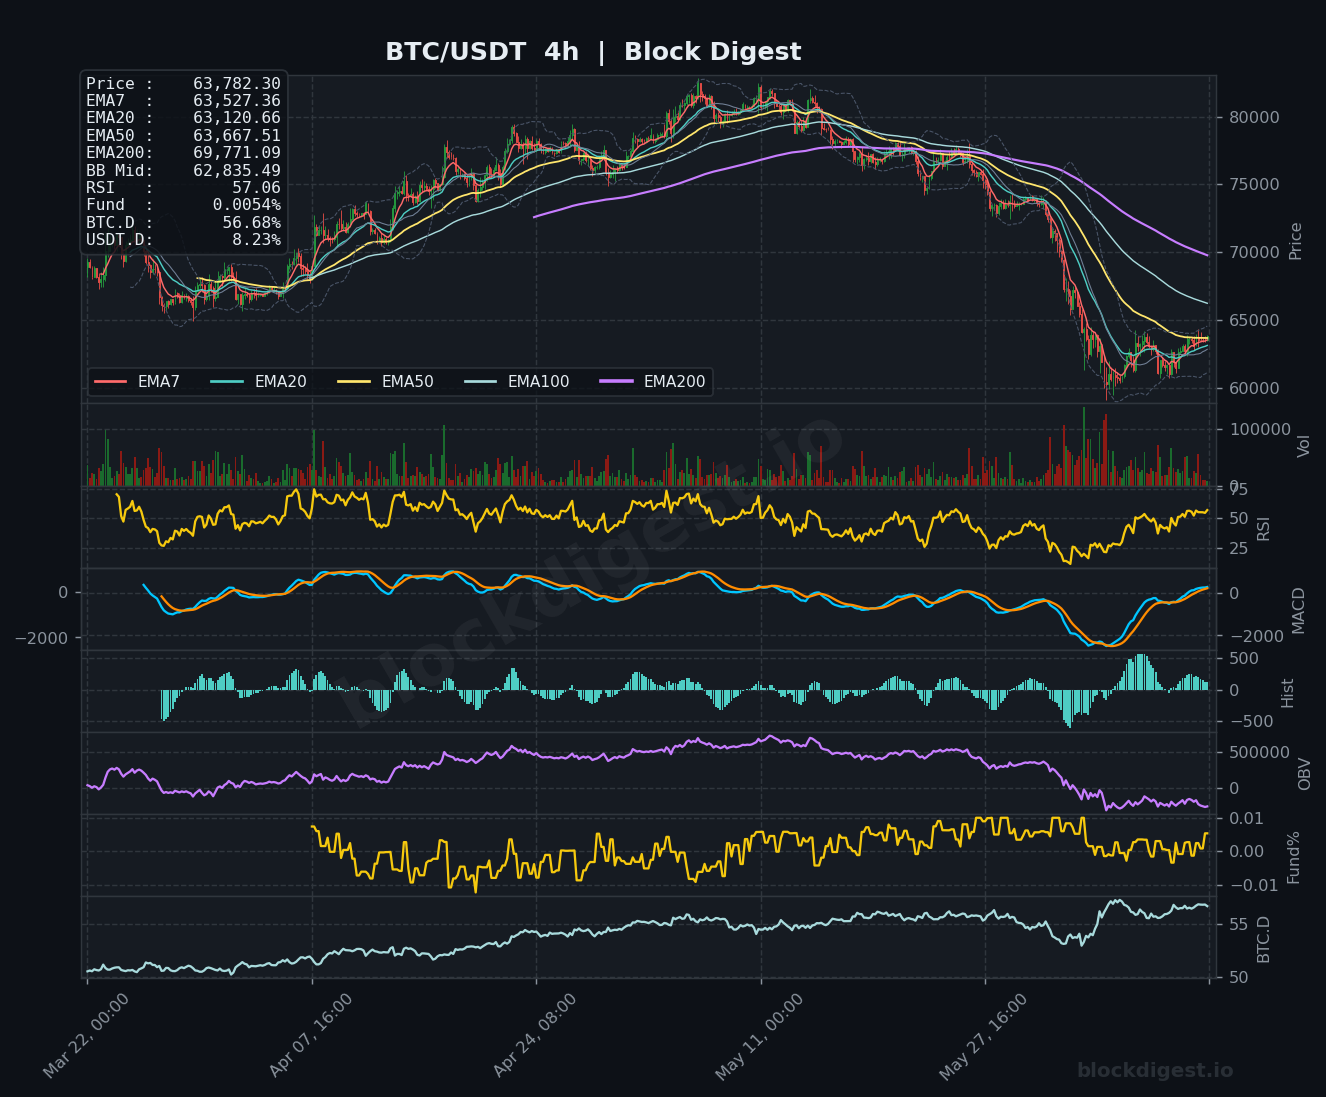
Across all three timeframes, the bearish structure is broadly aligned, though short-term signals show tentative stabilization. On the 1h chart, price has reclaimed its EMA7 ($63,641) and EMA20 ($63,576), with the shorter-term EMAs beginning to flatten and converge — a potential early sign of exhaustion in the downtrend. The 4h timeframe shows price attempting to recover above its EMA7 ($63,527) and EMA20 ($63,120), but the EMA200 at $69,771 remains a formidable macro ceiling. The daily chart paints the starkest picture: all EMAs are stacked in a bearish waterfall formation, and any near-term bounce should be treated as a counter-trend move unless price can reclaim the $66,800–$67,500 zone with conviction.
Key Levels to Watch
- Resistance:
- $65,000–$65,500 — Near-term overhead supply zone where recent consolidation occurred before the latest leg down; first meaningful hurdle for any recovery attempt
- $66,812 — Daily EMA20, currently acting as dynamic resistance and the first key reclaim level required to shift short-term sentiment
- $69,771–$71,056 — Confluence of the 4h EMA200 and daily EMA50; this zone would need to be cleared to signal a genuine trend reversal
- Support:
- $62,835 — 4h Bollinger Band midline; current near-term support acting as a pivot for the developing recovery
- $61,000–$61,500 — Recent swing low area that marked the nadir of the most recent capitulation wick; loss of this zone would signal further downside
- $58,000–$59,000 — Major structural support from prior consolidation range; a macro-level demand zone that would likely attract significant buying interest
Momentum & On-Chain Signals
The RSI readings paint a divergent picture across timeframes: the 1h RSI at 56.36 and the 4h RSI at 57.06 suggest recovering short-term momentum, which is mildly bullish in isolation. However, the daily RSI at 33.97 is approaching oversold territory without yet triggering a confirmed bounce signal, indicating that the broader downtrend has not yet fully exhausted itself. The 4h MACD shows the MACD line crossing above its signal line with expanding positive histogram bars — a nascent bullish crossover that warrants attention. OBV on both the 1h and 4h charts has been declining steadily throughout the corrective phase, reflecting persistent distribution; any sustained OBV uptick would be needed to confirm genuine accumulation. The funding rate at +0.0054% is mildly positive but near neutral, suggesting the market is not excessively overleveraged in either direction.
BTC Dominance & Market Sentiment
BTC Dominance (BTC.D) is currently reading 56.68%, a notably elevated level that suggests capital continues to rotate toward Bitcoin relative to altcoins — a risk-off dynamic within crypto markets where participants are seeking relative safety in BTC over more speculative assets. USDT.D at 8.23% indicates a meaningful portion of market capital remains parked in stablecoins, reflecting cautious positioning and hesitancy to deploy aggressively into risk assets at current levels. Together, these readings suggest broader market sentiment remains defensive, which could limit the upside for altcoins even if BTC stabilizes.
Risk Scenarios
- Bullish case: A confirmed 4h close above $65,500 followed by a reclaim of the daily EMA20 at $66,812 would signal a credible counter-trend recovery, with an initial target of $69,771 (4h EMA200) and an extended target toward the $71,000–$73,000 range.
- Bearish case: A failure to hold the $62,835 support and a daily close below $61,000 would confirm renewed downside pressure, opening a path toward the $58,000–$59,000 macro support zone with risk of further deterioration if that level also fails.
Outlook
The short-term picture shows tentative stabilization and early recovery signals on the 1h and 4h timeframes, but these must be weighed carefully against the dominant bearish daily trend with all major EMAs overhead acting as resistance. The most critical trigger to watch over the next 24–48 hours is whether BTC can sustain price action above $63,500 and build toward a test of the $65,500 resistance — failure at this level would likely reinforce the bear case. Given the broader macro context of recovering ETF inflows and a constructive regulatory backdrop, a relief rally remains plausible, but a full trend reversal would require reclaiming the $67,000–$71,000 zone on a closing basis. Until that occurs, the bias remains cautiously neutral-to-bearish on the daily timeframe, with any short-term long positions requiring tight risk management.
Disclaimer: This analysis is for informational purposes only and does not constitute financial advice. Cryptocurrency markets are highly volatile and unpredictable. All trading decisions should be made based on your own research and risk tolerance. Block Digest is not responsible for any financial losses incurred as a result of acting on this content.