Ethereum Daily Analysis: ETH tests $1,784 below EMA20 in bearish decline
Market Overview
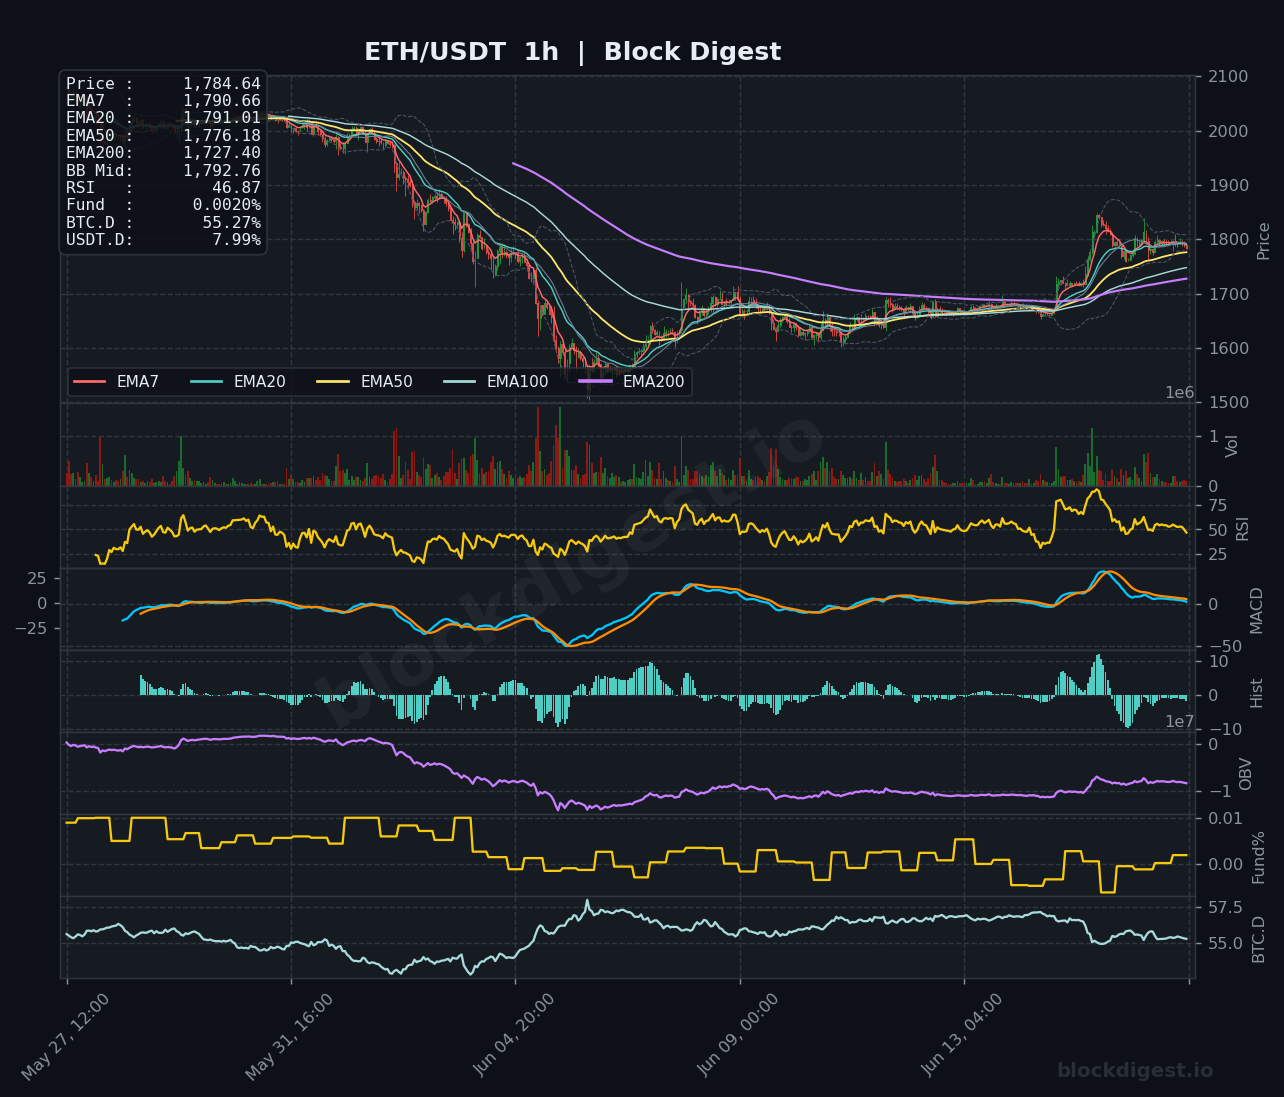
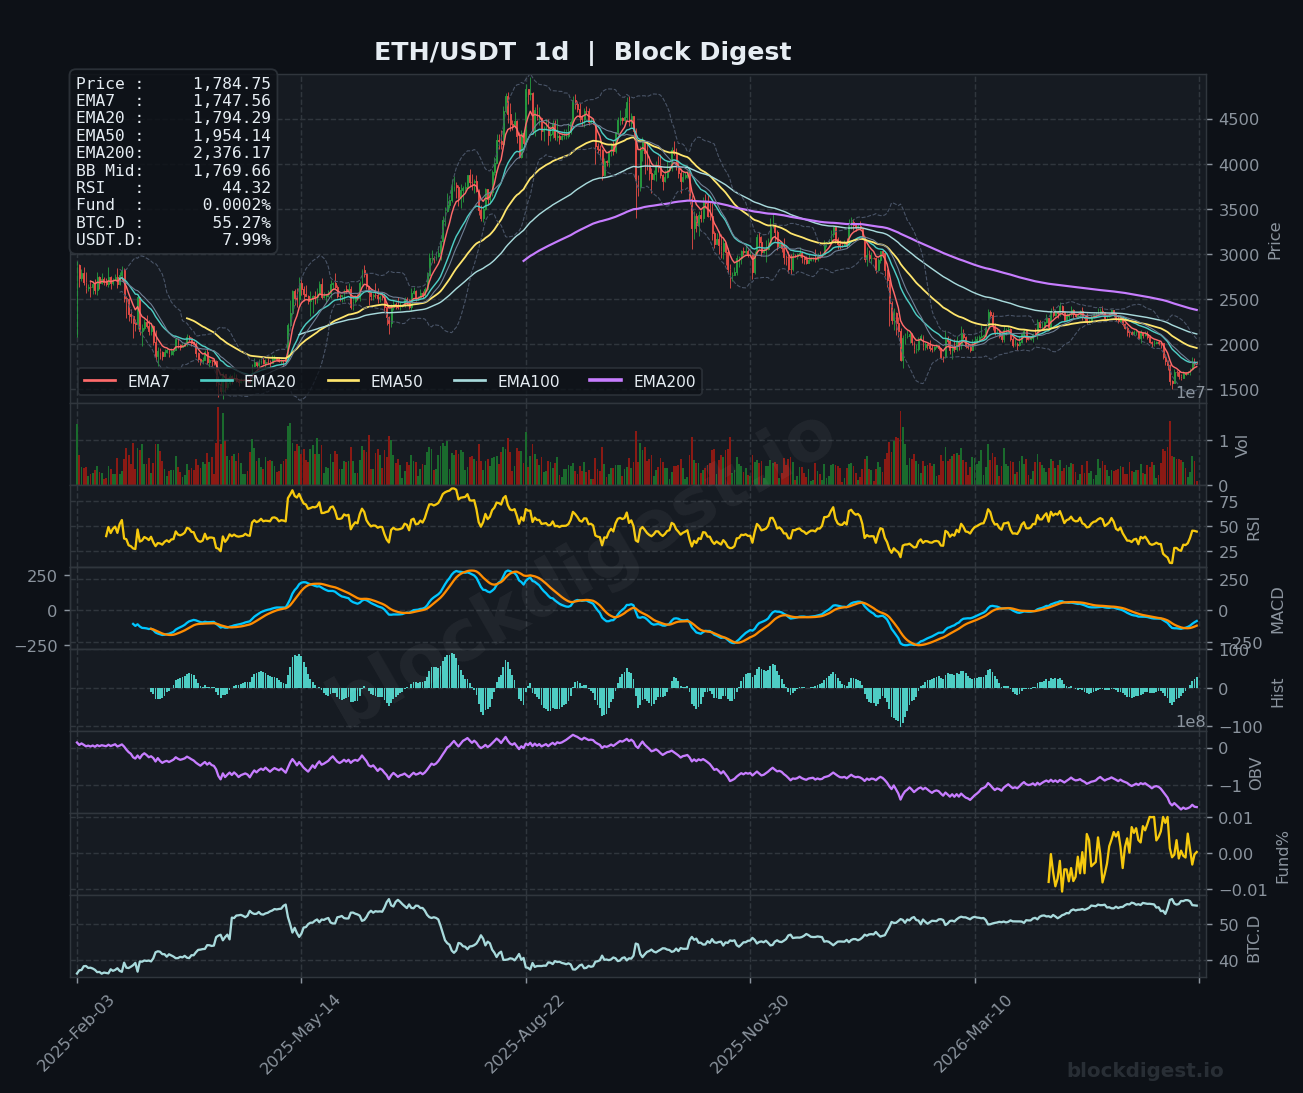
ETH/USDT is currently trading at $1,784.75, navigating a technically precarious zone following a sharp multi-week decline from levels above $2,400. On the daily timeframe, price sits just below the EMA20 ($1,794.29) and well beneath both the EMA50 ($1,954.14) and the EMA200 ($2,376.17), confirming the dominant macro trend remains firmly bearish. The Bollinger Band midline on the daily sits at $1,769.66, with price attempting to consolidate just above it — a marginal positive, though insufficient on its own to signal trend reversal. The recent recovery from the sub-$1,600 lows represents a corrective bounce rather than a structural trend change at this stage.
Multi-Timeframe Confluence
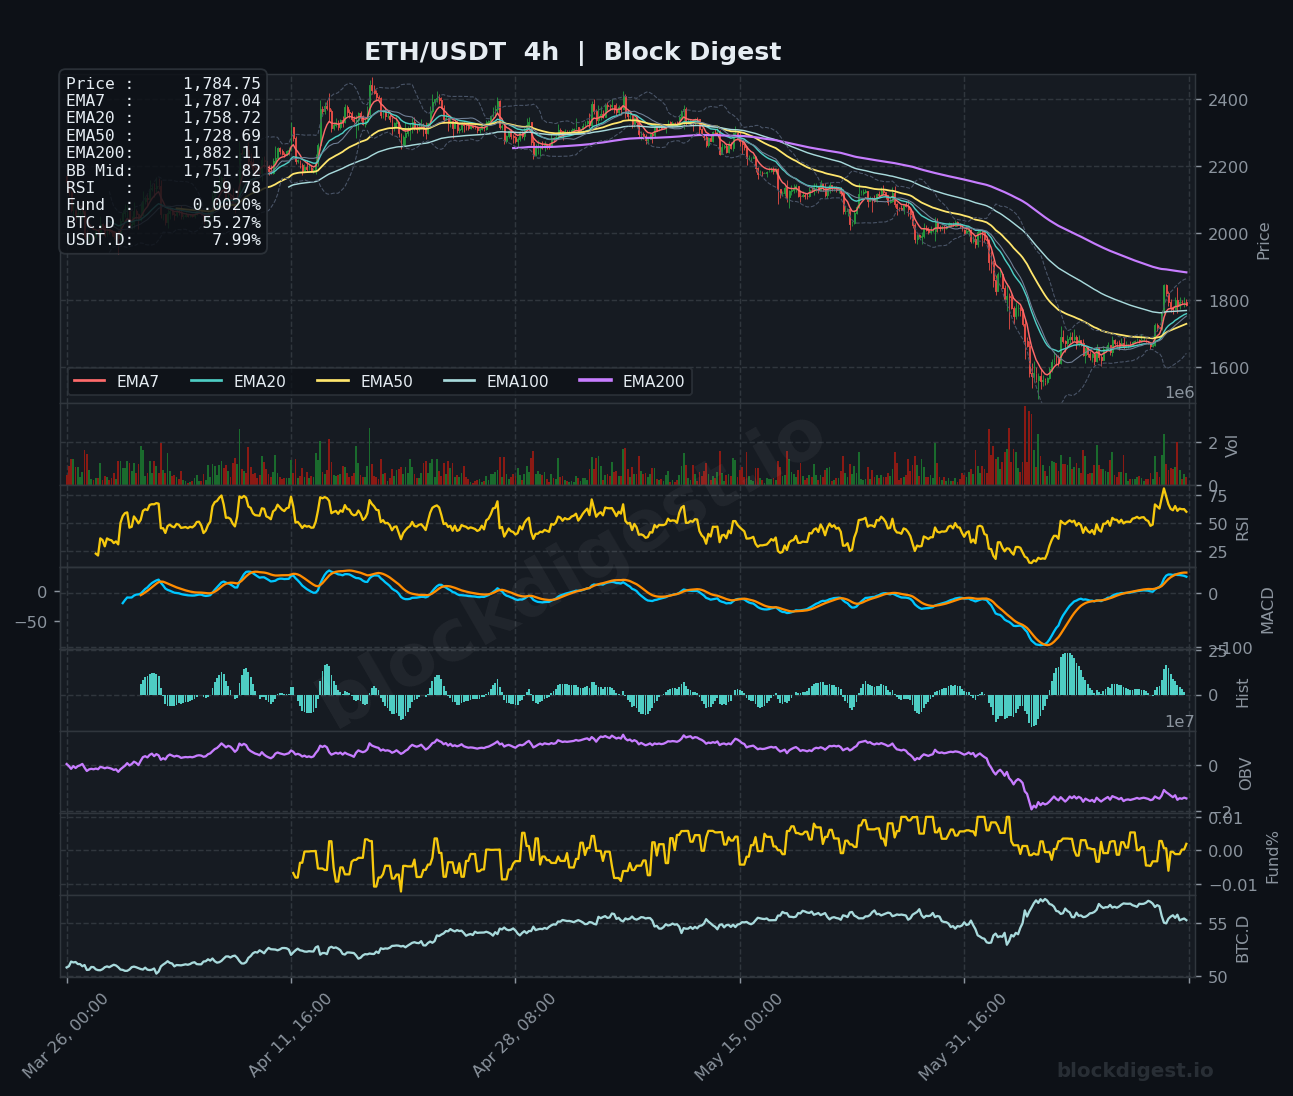
Across timeframes, the picture is one of short-term recovery meeting longer-term resistance. On the 1-hour chart, price is hugging the EMA7 ($1,790.66), EMA20 ($1,791.01), and BB midline ($1,792.76) in a tight cluster — a zone of near-term indecision. The 4-hour timeframe shows more constructive momentum, with RSI at 59.78 and price trading above its EMA7 ($1,787.04) and EMA20 ($1,758.72), suggesting the intermediate recovery has legs. However, the daily RSI at 44.32 and the steep EMA stack overhead — particularly the EMA50 at $1,954 — indicate that bulls face significant structural resistance before any meaningful trend reclamation is possible.
Key Levels to Watch
- Resistance: $1,794–$1,795 — confluence of 1h EMA20, BB midline, and daily EMA20; immediate overhead barrier where sellers may reassert control
- Resistance: $1,882 — 4h EMA200, a key dynamic level that capped prior recovery attempts and represents the next meaningful hurdle should the bounce extend
- Resistance: $1,954 — daily EMA50, a macro resistance zone that would need to be reclaimed to shift the medium-term bias to neutral/bullish
- Support: $1,769 — daily BB midline; near-term floor that has been tested and held, critical for sustaining the current recovery
- Support: $1,727–$1,728 — 1h EMA200 and recent consolidation base; a break below here would signal the bounce is failing
- Support: $1,600–$1,620 — the swing low region established during the recent capitulation; macro structural support and the line in the sand for longer-term bulls
Momentum & On-Chain Signals
The RSI divergence across timeframes is notable: the 4h reading at 59.78 reflects recovering intermediate momentum, while the daily RSI at 44.32 and the 1h at 46.87 both remain below the neutral 50 level, suggesting the broader trend pressure has not been resolved. The 4h MACD shows a bullish crossover in progress with the histogram printing positive bars — an encouraging near-term signal — though the daily MACD remains in negative territory with the signal lines still separated to the downside. OBV on the daily continues to trend lower, consistent with ongoing distribution and indicating that volume has not yet confirmed the price recovery. The funding rate sits at a near-neutral +0.0020%, which implies no excessive leverage in either direction — a relatively clean positioning environment.
BTC Dominance & Market Sentiment
BTC dominance at 55.27% remains elevated and has been trending higher over the observed period, reflecting continued capital rotation away from altcoins and into Bitcoin. USDT dominance at 7.99% suggests a meaningful portion of market participants remain in stablecoins, indicating cautious risk appetite rather than aggressive re-entry. For ETH specifically, the elevated BTC.D environment historically suppresses ETH’s ability to sustain strong rallies independently, making BTC price action a critical co-determinant of ETH’s near-term trajectory.
Risk Scenarios
- Bullish case: A decisive hourly close above $1,800 followed by reclaiming the daily EMA20 at $1,794 on sustained volume would open a run toward $1,882 (4h EMA200), with an extended target toward $1,954 if broader market risk appetite improves and BTC.D begins to pull back.
- Bearish case: Failure to hold the $1,769 BB midline on the daily, combined with a 4h MACD bearish crossover, would signal the bounce is exhausted and put the $1,727 EMA200 zone in immediate jeopardy, with a retest of $1,620–$1,600 as the logical downside target.
Outlook
The near-term bias is cautiously neutral-to-mildly constructive, as the 4h structure suggests a developing recovery, but the daily trend remains bearish with heavy EMA resistance overhead. The next 24–48 hours are pivotal: ETH needs to convert the $1,794–$1,795 resistance cluster into support to sustain any bullish narrative. A failure at this level, or a deterioration in broader crypto sentiment driven by BTC weakness, would likely abort the current bounce quickly. Traders should monitor daily closes closely — a confirmed close above $1,800 with expanding OBV would materially improve the short-term setup, while a drop back below $1,750 would suggest the corrective structure remains intact.
Disclaimer: This analysis is for informational purposes only and does not constitute financial advice. Cryptocurrency markets are highly volatile and unpredictable. All trading decisions should be made based on your own research and risk tolerance. Block Digest is not responsible for any financial losses incurred as a result of acting on this content.